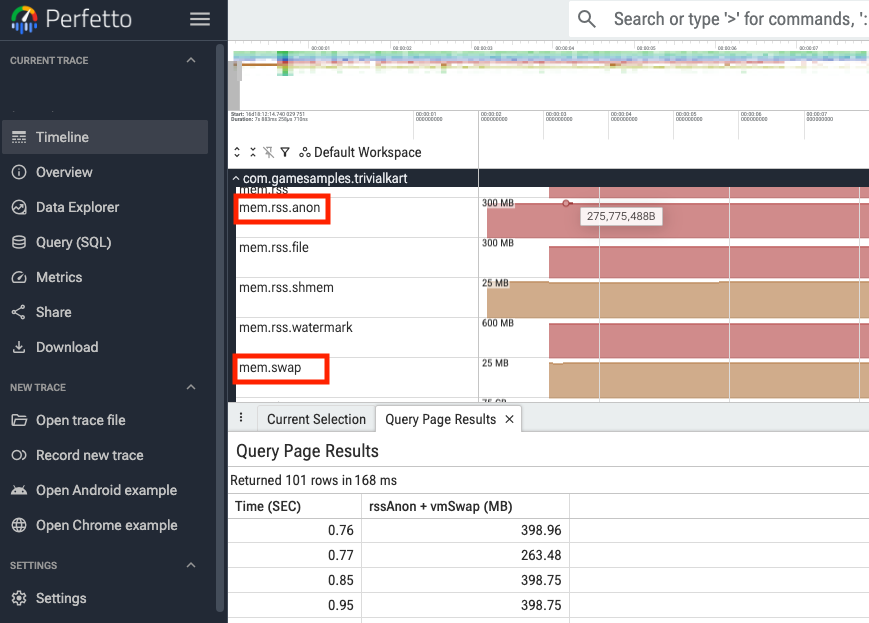
In the Android system, the memory limit threshold for Memory Limiter (Android 17+) and the benchmark value for memory vital in Google Play Console is 'anonymous RSS + swap'. This value represents the physical memory pressure level actually occupied by the process and is a critical metric that must be monitored for stable app operation.
Currently, it's difficult to measure memory usage that exactly matches 'anonymous RSS + swap' either at runtime or statically within the Unity Engine.
To address this, this page introduces how to track the 'anonymous RSS + swap' value with high reliability through approximation using the Unity Profiler, ProfileRecorder API, and Unity Memory Profiler in a Unity Engine environment.
Check memory usage at runtime
In Unity, directly measuring Android's exact 'anonymous RSS + swap' memory usage at runtime without overhead can be challenging. However, you can closely estimate this value (within ~10% variance) using Unity's built-in Profiler APIs.
Method 1: Use the Profiler
You can estimate total memory usage by summing the values returned by the following Profiler APIs:
using UnityEngine;
using UnityEngine.Profiling;

public class MemoryMonitor : MonoBehaviour
{
    public long GetEstimatedMemoryUsageBytes()
    {
        long totalReserved = Profiler.GetTotalReservedMemoryLong();
        long monoHeapSize = Profiler.GetMonoHeapSizeLong();

        return totalReserved + monoHeapSize;
    }
}
Method 2: Use the ProfilerRecorder class
You can track Total Reserved Memory and Gfx Reserved Memory metrics using ProfilerRecorder:
In Development builds: Calculate 'Total Reserved Memory' - 'Gfx Reserved Memory'.
In Release builds: Use 'Total Reserved Memory' directly.
using Unity.Profiling;
using UnityEngine;

public class MemoryMonitor : MonoBehaviour
{
    ProfilerRecorder totalRecorder;

#if DEVELOPMENT_BUILD
    ProfilerRecorder gfxRecorder;
#endif

    private void OnEnable()
    {
        totalRecorder = ProfilerRecorder.StartNew(ProfilerCategory.Memory, "Total Reserved Memory");

#if DEVELOPMENT_BUILD
        gfxRecorder = ProfilerRecorder.StartNew(ProfilerCategory.Memory, "Gfx Reserved Memory");
#endif
    }

    private void OnDisable()
    {
        totalRecorder.Dispose();

#if DEVELOPMENT_BUILD
        gfxRecorder.Dispose();
#endif
    }

    public long GetEstimatedMemoryUsageBytes()
    {
#if DEVELOPMENT_BUILD
        if (totalRecorder.Valid && gfxRecorder.Valid)
        {
            return totalRecorder.LastValue - gfxRecorder.LastValue;
        }
#else
        if (totalRecorder.Valid)
        {
            return totalRecorder.LastValue;
        }
#endif
        return 0;
    }
}
Limitation:
Memory allocations that bypass Unity's Memory Manager (e.g., NativeMalloc(IntPtr size)) can't be tracked by these APIs.
These APIs might not be supported depending on your Unity version.
Analyze memory breakdown (static analysis)
If high memory usage is detected at runtime, you need to identify where memory is being consumed. Analyzing memory distribution lets you to eliminate unnecessary allocations and reduce the game's overall memory footprint.
Unity Memory Profiler
To perform an in-depth memory analysis and optimize your game, use the Unity Memory Profiler package. To locate the items corresponding to Android OS 'anonymous RSS + swap' usage:
- Capture a snapshot using the Unity Memory Profiler.
- Open the snapshot and navigate to All of Memory > Resident Memory on Device.
Calculate the sum of the following items:
- Untracked
- Android Runtime
- Native
- Managed
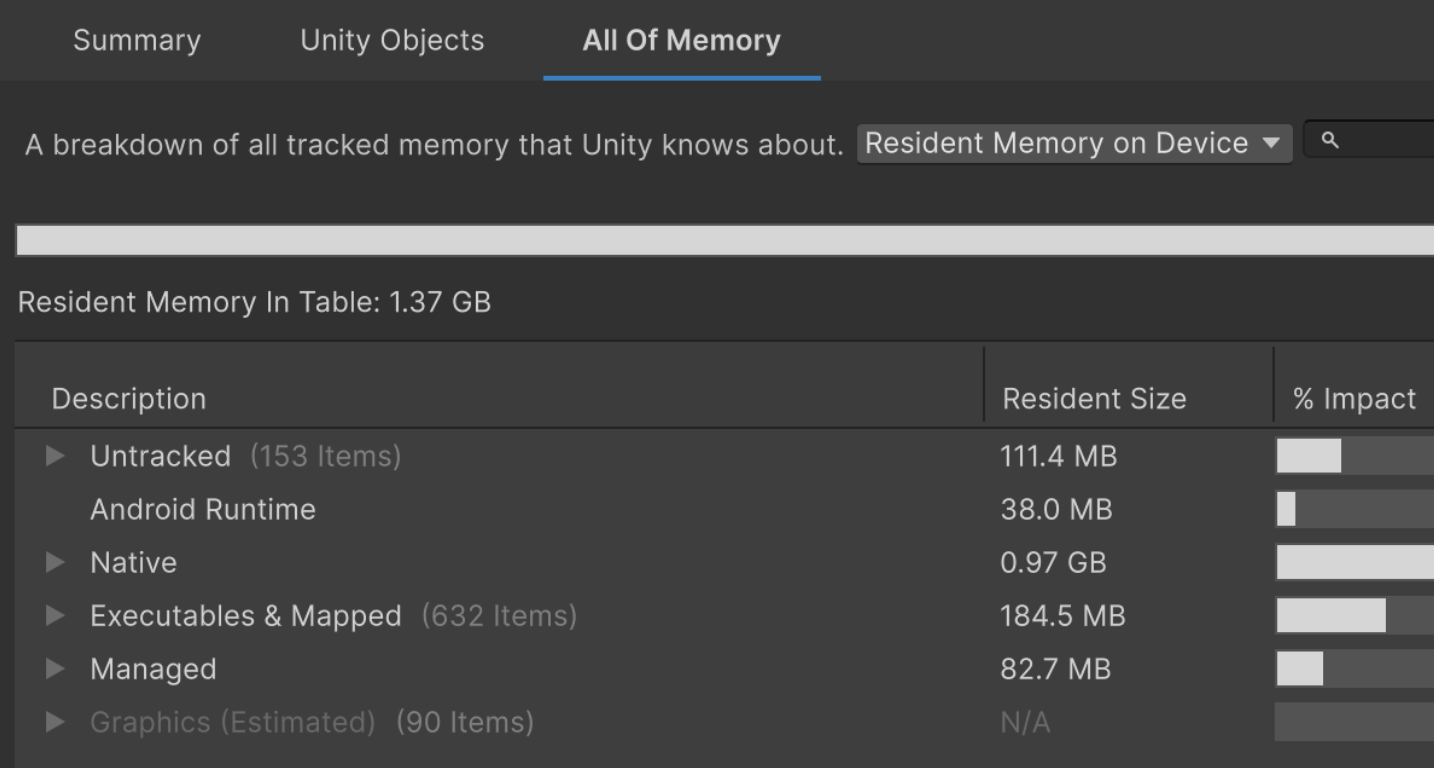
Figure 1. Memory Descriptions are stored in resident memory
The total sum serves as a practical substitute for Android OS 'anonymous RSS + swap', delivering actionable insights for game memory analysis.
Limitation:
Under heavy memory pressure, the Android OS might compress or swap active memory pages to free up RAM. Because the Unity Memory Profiler can't track swapped memory, discrepancies might arise during high memory usage scenarios.
These features might be limited depending on your Unity version.
Example C# scripts
You can refer to the AndroidAndroidProcessStats.cs and
GameMemoryMonitor.cs scripts for examples on how to monitor the state and
memory footprints of your game's processes at runtime.
- The
AndroidProcessStatsscript demonstrates how to use JNI (Java Native Interface) to link into the AndroidActivityManagerAPIs and provides functionality to fetch running processes, their importance, and OS-level state. It also contains lightweight methods to read memory stats directly from the Linux/procfile system. - The
GameMemoryMonitorscript shows how to hook this information up for continuous monitoring and debugging, including how to poll the Android APIs on a background thread to prevent performance overhead (since using JNI and polling for memory information can be costly), and how to hook into lifecycle events likeOnApplicationPauseto track memory changes when the app is backgrounded or resumed.
To use these tools, add both scripts to your Assets folder, and attach the
GameMemoryMonitor script to a GameObject in your scene.
More accurate assessment
To verify exact Android OS 'anonymous RSS + swap' values, use Perfetto. It lets you measure precise system-level memory usage and thoroughly analyze your game's memory footprint.