
Effective use of 3D graphics enables user-pleasing visual enhancement for apps. Android developers have a range of options for rendering 3D models. When introducing 3D to your app, it's important to pay attention to the performance and memory implications, ensuring your users continue to have a smooth and stable experience.
To avoid an unpleasant user experience, 3D model rendering should update at a high frame rate. This helps prevent stuttering visual presentation, or perceived input lag when the 3D elements are part of an interactive interface. If your 3D assets are not rendering at a sufficiently high frame rate, you might need to optimize the assets, change rendering feature options, or combine the two approaches.
Android Performance Analyzer is a tool that helps you profile and understand graphics performance and memory consumption. This study examines profiles captured with Android Performance Analyzer to demonstrate some of the ways you can use it to understand bottlenecks and identify ways to improve runtime performance, memory usage and power consumption. We will explore interpreting Graphics Processing Unit (GPU) performance counter data to assess rendering performance.
All profiles in this study were captured from a 3D model viewer for the popular GLTF model format built using Google's open source Filament rendering engine. Filament includes an Android library to integrate a high quality physically-based 3D rendering engine directly into your app. Profiling was done using a Pixel 9 Pro device running Android 17. The optimizations and improvements demonstrated are generally applicable to all Android devices, but the baseline performance and amount of improvement in a particular scenario is device dependent.
Initial test
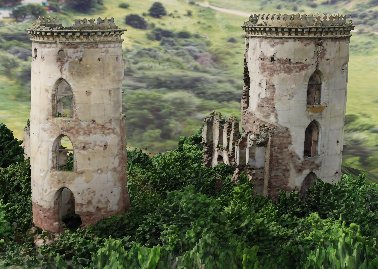
Our initial profile uses a high fidelity 3D model made up of a large number of geometric primitives, nearly 2,000,000 triangles, rendered with multiple high resolution textures.
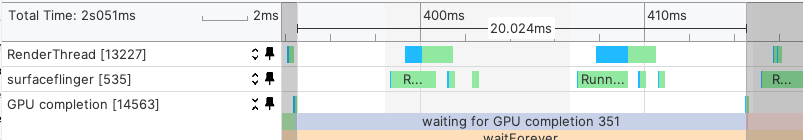
Filament spawns a utility thread it names “GPU Completion” that emits marker data for the profiler signalling when Filament is waiting on the GPU. We can select this thread in the profiler and pin it to keep it as a track at the top of the capture as shown below.
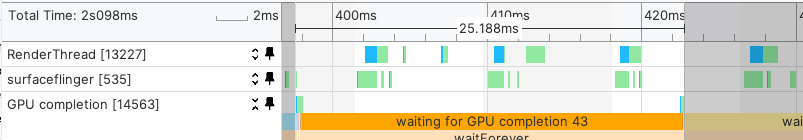
In the timeline at the top, by drag selecting we can see that for a particular frame, Filament was waiting on GPU completion on the frame for approximately 25 milliseconds. This translates to a frame rate of 40 frames per second. For an optimal user experience, consider targeting 60 frames per second. Modern devices often feature high refresh rate displays, which can update at 120 frames per second or higher. Rendering 3D content at 120 frames per second can greatly increase power consumption and device heating, and is not recommended for all but the simplest 3D content.
We will now explore ways to improve performance to reach or exceed 60 frames per second (16.66 millisecond maximum frame time). The profiler also reports the amount of graphics memory used by the application; in the initial profile the graphics memory usage totals 1,372 MB of RAM.
Introducing dynamic rendering
In some scenarios, it may not be possible to make modifications to the model assets being rendered. In this case, you may have to disable or turn down rendering options to achieve a target frame rate. One common technique for improving performance is to use an upscaling algorithm. In Filament this is exposed through a Dynamic Resolution feature.
A modern handheld device features a high resolution display with tiny pixels. Rendering at the native resolution of the display can be very computationally expensive, rendering details that may be barely perceptible to the naked eye. When using upscaling, the scene is rendered at a lower effective resolution, saving computation and memory bandwidth. The end result is then processed by an upscaling algorithm that resizes the image to the native resolution while applying enhancements to make the scaling less noticeable.
Modern graphics processors can run sophisticated upscaling algorithms that are still more efficient than rendering at the raw display resolution.
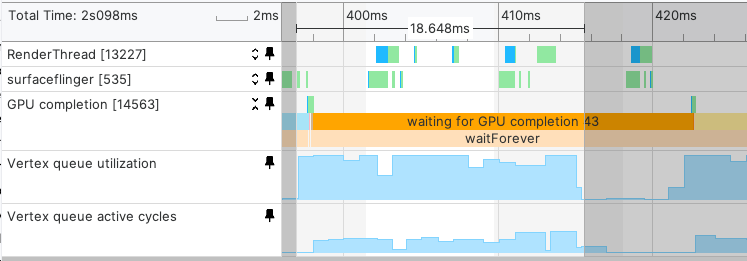
Examining a new profile with dynamic resolution enabled, we can see that the waiting for GPU completion is now around 20 milliseconds, down from 25:
Dynamic rendering gave a significant improvement without altering the 3D assets, but wasn’t enough for us to reach our target. The next step will be to look at other data available in the profile to determine which aspects of our assets are most in need of optimization. In this study we will constrain our explorations to two basic elements of the 3D rendering process: vertex (geometry) processing and pixel (fragment) processing.
The vertex processing step calculates mathematical transformations on the geometric primitives, usually triangles, that make up the model data, as well as performing other steps like skeleton bone and mesh transforms for animated models. The fragment processing step is where the transformed triangles are rendered, or shaded, into a render target, which might be a buffer to be sent to the screen, or a texture as part of an intermediate rendering step. GPUs typically have different hardware for each of these stages, the fragment stage being dependent on the output of the vertex stage.
Many GPUs, including the one in the Pixel 9 Pro used for this study, take advantage of this hardware split and try to pipeline: while the fragment stage is processing vertex stage output, the GPU can start work on new vertex data for the next frame, working in parallel. However, if one stage takes significantly longer to compute than the other, the GPU is limited in parallelization by the slower stage.
Optimizing geometry
Starting with the vertex stage, if we pin counters that show vertex stage activity to the top of our trace we can see the following:
Vertex processing is taking around 18.5 milliseconds, suggesting it is the limiting factor for performance. Dynamic resolution optimizes the fragment stage of rendering, the same number of geometry data still needs to be processed when rendering to a lower effective resolution. Our source model is nearly 2,000,000 primitives, which for this application, suggests it has a level of fine-grained detail that takes computational time, but may be too small to further enhance the visual impact of the model.
After using a tool to generate a reduced geometry ‘level of detail’ version of the model data, we profile again, this time rendering around 860,000 primitives, a reduction of slightly more than half:
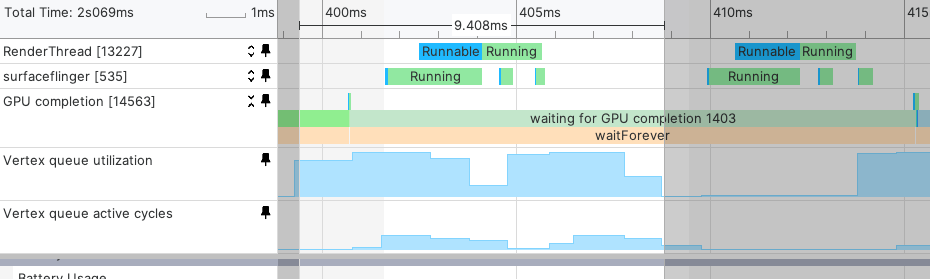
The waiting for GPU completion now measures 14.7 milliseconds, below our 16.6 millisecond target. Vertex stage processing was cut nearly in half, to around 9.4 milliseconds. In this scenario the geometry count had a nearly direct correlation with the vertex stage processing time. The reduced geometry count also saves memory, the graphics memory statistic in the new trace has reduced to 1,120 MB, down from 1,372 MB.
Compressed textures
Image data drawn onto the surfaces of models are represented in the form of texture objects. These texture objects have an underlying pixel format. A common base format, known as RGBA8888, defines red, green, blue and alpha channels as a byte each, and combines them into a 32-bit pixel value. This detail allows for high color fidelity when creating or editing content, but requires significant memory for high resolution images. A 2048x2048 pixel RGBA8888 texture uses 16 megabytes of RAM. In addition to the memory overhead, this format uses a large amount of memory bandwidth when rendering, decreasing rendering performance and increasing power consumption.
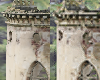
Graphics processors support compressed textures. These textures are processed with specialized algorithms that perform lossy compression to reduce texture size to a fixed bit-per-pixel count. The most popular current algorithms on Android for compression RGBA8888 data are ETC2 and ASTC (4x4), which result in 8 bits per pixel instead of 32, quarter of the size of an uncompressed texture. Compression artifacts are introduced by the lossy texture compression algorithms, but for most content will be minimal to imperceptible, and worth the performance tradeoff.
GLTF model files have optional support for texture compression, which is compatible with Filament.
When profiling compressed textures using the original models, the time is reduced from approximately 20.5 milliseconds, down from 25. Graphics memory usage is reduced to 1,094 MB, down from 1,372 MB.
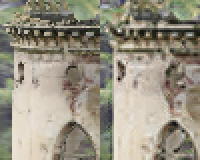
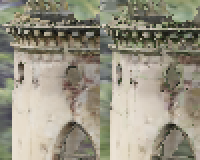
Finally, we profile against both optimized geometry and reduced textures. In this configuration, rendering time is only 13.5 milliseconds, and graphics memory is 840 MB. These optimizations have resulted in reaching a target 60 frames per second, with headroom, and a large reduction in graphics memory usage. The visual difference between the two is relatively small in comparison:

Summary
Adding 3D graphics can enhance the visual impact of your app for users. When incorporating 3D graphics, evaluate the memory and performance impact of your 3D scenes. Android Performance Analyzer can help you identify suboptimal performance in your graphics and guide you to the appropriate area to optimize.