
This guide describes the process for analyzing and optimizing game performance on Android devices for a smooth user experience. It covers identifying performance bottlenecks, distinguishing between CPU and GPU issues, and verifying optimization results.
No matter how fun or engaging a game is, if it doesn't run well on mobile devices, players won't enjoy it, and it won't be as successful. Even fun games can have problems like low frames per second (FPS) or the device getting too hot. These issues make players unhappy. Therefore, improving game performance is essential and you must understand how to optimize it.
The process for performance optimization involves the following steps:
Measuring overall game performance. Quantify performance degradation on a per-scene basis to pinpoint anomalies.
CPU and GPU bound check. Ascertain the underlying cause, whether CPU-bound or GPU-bound.
Tools: Unreal Insight, Unity Profiler, Perfetto, and Performance measurement tools.
CPU optimization. Rectify the identified performance bottlenecks.
Tools: Unreal Insight, Unity Profiler, Perfetto, and Simpleperf.
GPU optimization. Rectify the identified performance bottlenecks.
Tools: RenderDoc, Arm mobile studio, AGI, Vendor specific tool.
A/B testing. Conduct A/B testing to rigorously validate the efficacy of the implemented optimizations.
Tools: Unreal Insight, Unity Profiler, Perfetto, and Performance measurement tools, CPU or GPU frequency lock, and RenderDoc.
This iterative process (1-5) is maintained until the targeted FPS and thermal parameters are successfully achieved.
Prerequisites
Have a game build ready for testing on an Android-powered device.
Install the following tools:
Analyze comprehensive game performance
You must check the game's overall performance and identify any scene-based performance degradation or abnormalities. Before optimizing your game, check its current performance. Because games include many UIs and scenes, analyze scenes with high CPU or GPU usage, or layouts that perform unexpectedly, to monitor performance degradation and CPU or GPU utilization per scene.
- Quantify performance degradation: Use performance measurement tools to measure the game's overall performance. Measure performance on a per-scene basis to identify specific areas with degradation or abnormalities.
- Identify problematic scenes: Analyze the data to find scenes with high CPU or GPU usage, or where screen layouts fail to yield expected performance.
- Gather trace data: Use trace tools to collect detailed performance data for the identified problematic scenes.
Identify CPU or GPU bottlenecks
If the game doesn't hit its target FPS, determine if it's CPU-bound or GPU-bound. Analyzing CPU and GPU behavior is crucial for finding optimization opportunities, even when the device gets hot or uses too much power during gameplay. You can use various methods to find out if the system is CPU-bound or GPU-bound.
Analyze trace data: Use your preferred tool to analyze trace data:
- Unreal Insight (Unreal Engine): Analyze the trace to see timing for
GameThread,RenderThread, andRHIThread.- If
GameThreadorRenderThreadexceed the frame time limit (for example, 33.3ms for 30 FPS), the game is CPU-bound. - If
RHIThreadexhibits prolonged execution or accounts for the majority of the frame time, the game is GPU-bound.
- If
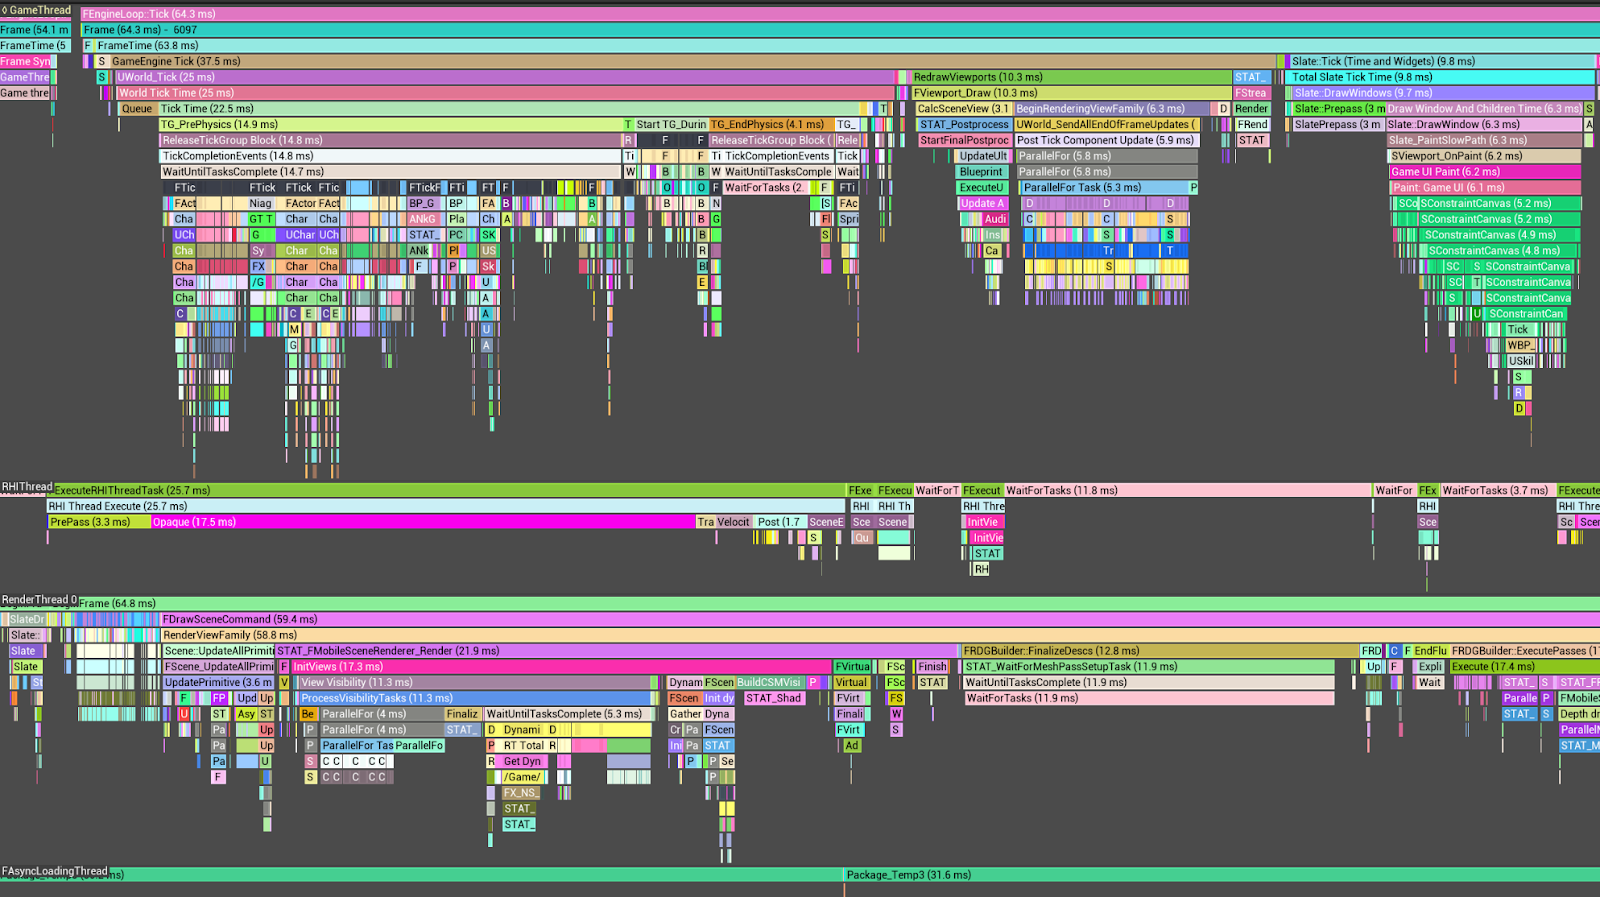
Figure 2. Unreal insight trace with GameThread, RenderThread, and RHIThread (click to enlarge). - Unity Profiler (Unity): If the main thread consumes substantial time
on markers like
Gfx.WaitForPresentOnGfxThreadwhile the render thread showsGfx.PresentFrameor<GraphicsAPIName>.WaitForLastPresent, the game is GPU-bound.
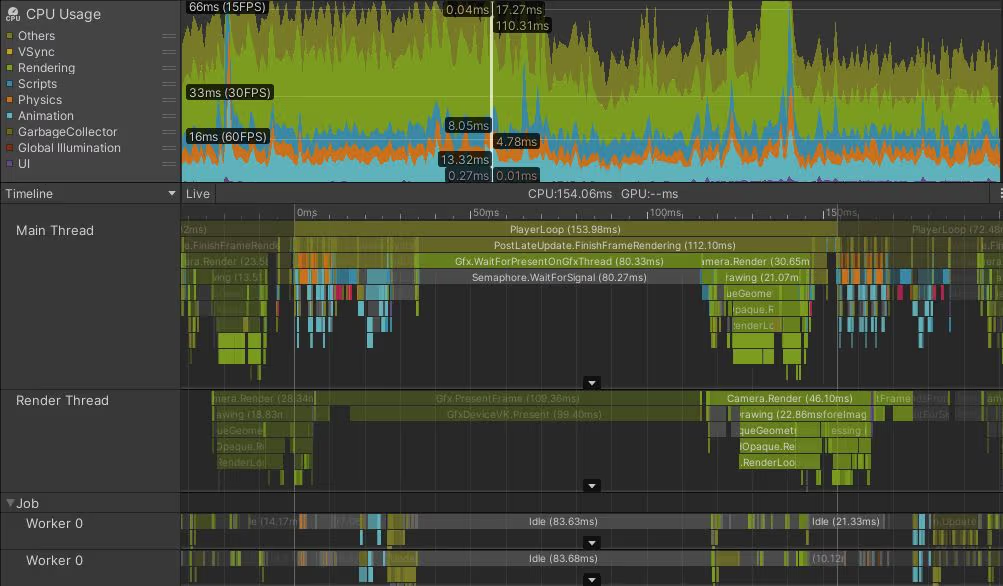
Figure 3. GPU bound example for Unity Profiler (click to enlarge). - Perfetto: Analyze CPU core assignments and thread execution details. This analysis facilitates the identification of performance bottlenecks through the detailed review of thread execution information.
CPU overhead: The trace indicates that the workload on the
GameThreadandRenderThread, in conjunction with VSync, is responsible for delays in the RHI Thread'sQueuePresent, thereby signifying a CPU-bound scenario.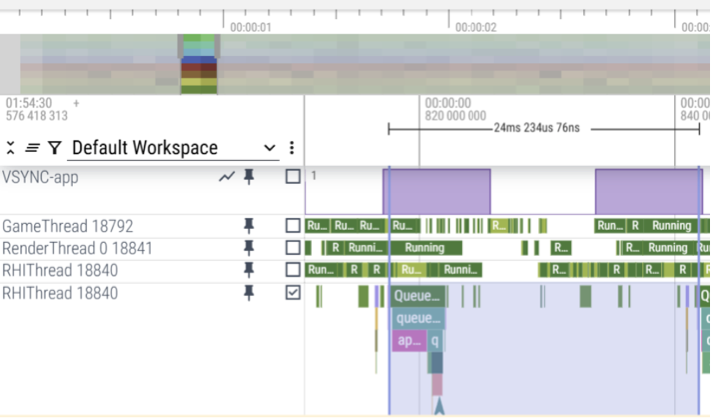
Figure 4. Perfetto traces with CPU execution details (click to enlarge). GPU overhead: If GPU completion time exceeds the frame time limit, for example, 25ms, the game is GPU-bound. The trace indicates that GPU completion exceeds 25ms, which signifies a GPU-bound scenario.
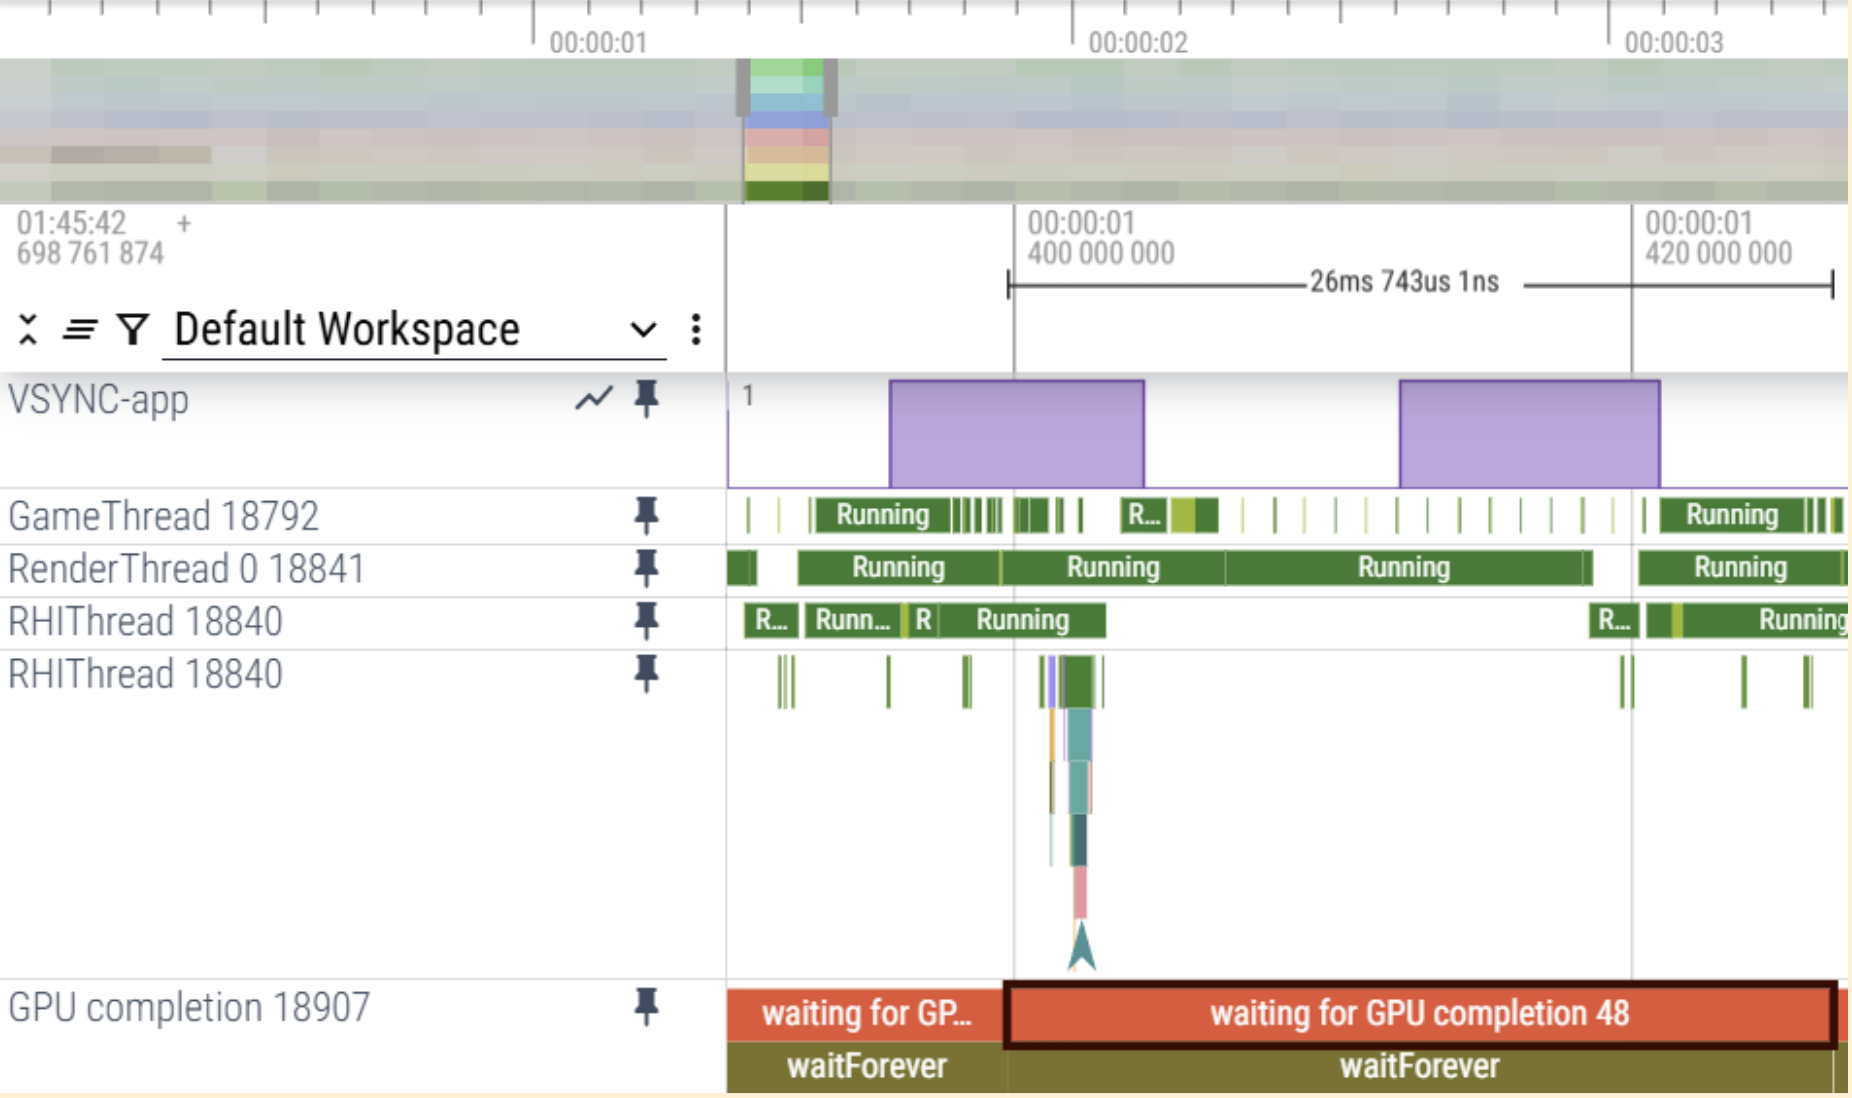
Figure 5. Perfetto traces with GPU overhead details (click to enlarge).
- Unreal Insight (Unreal Engine): Analyze the trace to see timing for
Use Unreal Engine stat commands:
stat unit: Compare time allocated to Game, Draw, and RHI threads. If Game and Draw times are low but RHI time consistently exceeds the frame time limit, the game is GPU-bound. For example, if the required FPS is 30 (equivalent to 33.33ms per frame), and both Game and Draw threads consistently remain within a 10-15 ms range, yet the RHI consistently exceeds 30ms, it strongly suggests a GPU-bound scenario.
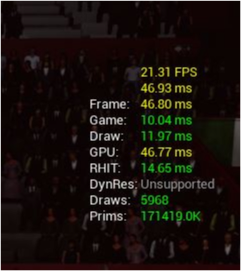
Figure 6. Stat unit facilitates the estimation of GPU-bound conditions. stat VulkanRHI: Check Queue Submit and Queue Present durations.
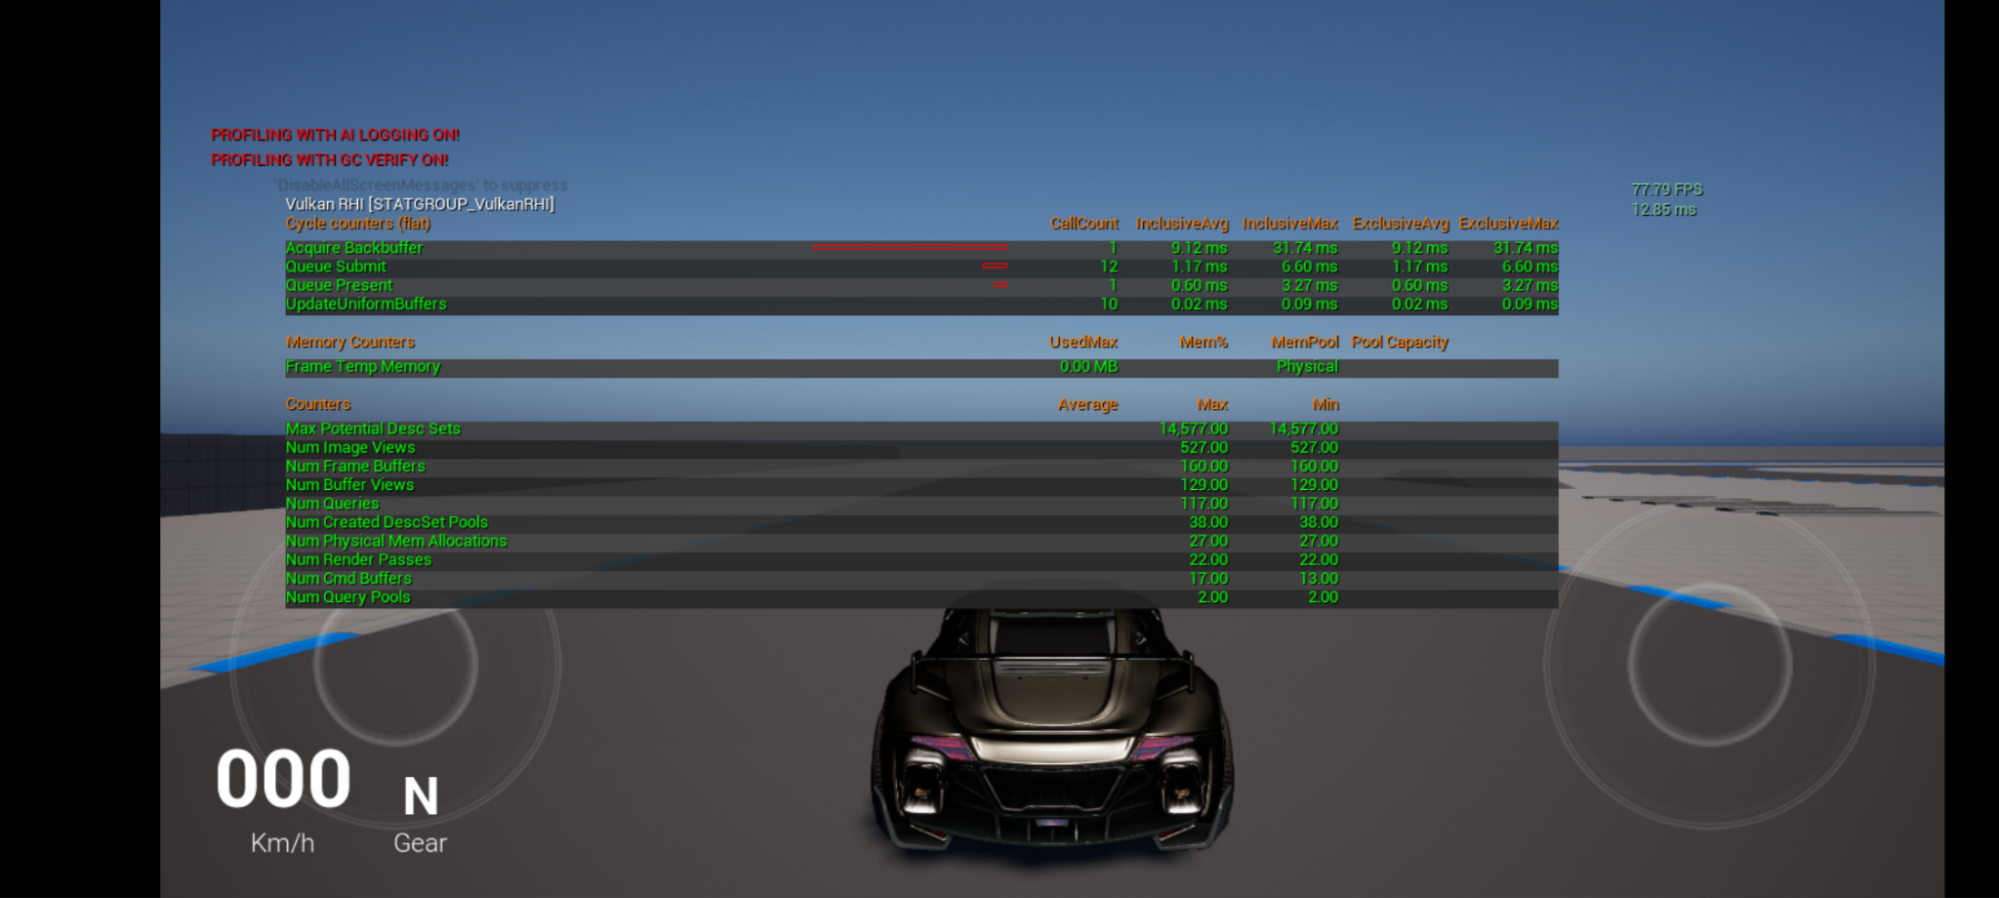
Figure 7. Stat VulkanRHI facilitates the estimation of GPU-bound conditions (click to enlarge). stat slow: Scrutinize time allocated to Game, Render, and RHI threads to pinpoint impediments.
Check performance metrics: Use the results from your comprehensive game performance analysis. On Android:
- CPU-bound: CPU (normalized) usage greater than 15%, with low GPU usage and low FPS.
- GPU-bound: GPU usage greater 90%.
Typically, if the FPS and GPU usage are low while the CPU usage exceeds 15%, the situation can be considered CPU-bound.
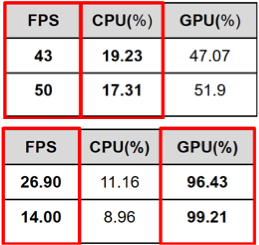
Figure 8. Performance metrics with CPU and GPU usage.
Optimize CPU performance
If the analysis indicates the game is CPU-bound, investigate further to pinpoint specific threads or APIs causing the bottleneck.
For detailed guidance, see CPU, GPU Optimization Tips for Android.
Optimize GPU performance
If the analysis indicates the game is GPU-bound, investigate further using frame debuggers to analyze the render pipeline and draw calls.
For detailed guidance, see CPU, GPU Optimization Tips for Android.
Verify optimization effectiveness
- Conduct A/B testing: Create a build with the implemented optimizations.
- Measure performance: Use the same tools and methods from the initial analysis to measure the performance of the optimized build.
- Compare results: Compare the new performance data with the initial data to confirm that the identified bottlenecks have been resolved and that FPS and thermal targets are met.
- Iterate: Repeat the analysis and optimization steps until the performance is achieved.