
The Performance pane displays GPU performance for different rendering events.
There are three components in this pane:
- Toolbar: contains functional buttons for customizing the Performance Table or kicking off an experiment.
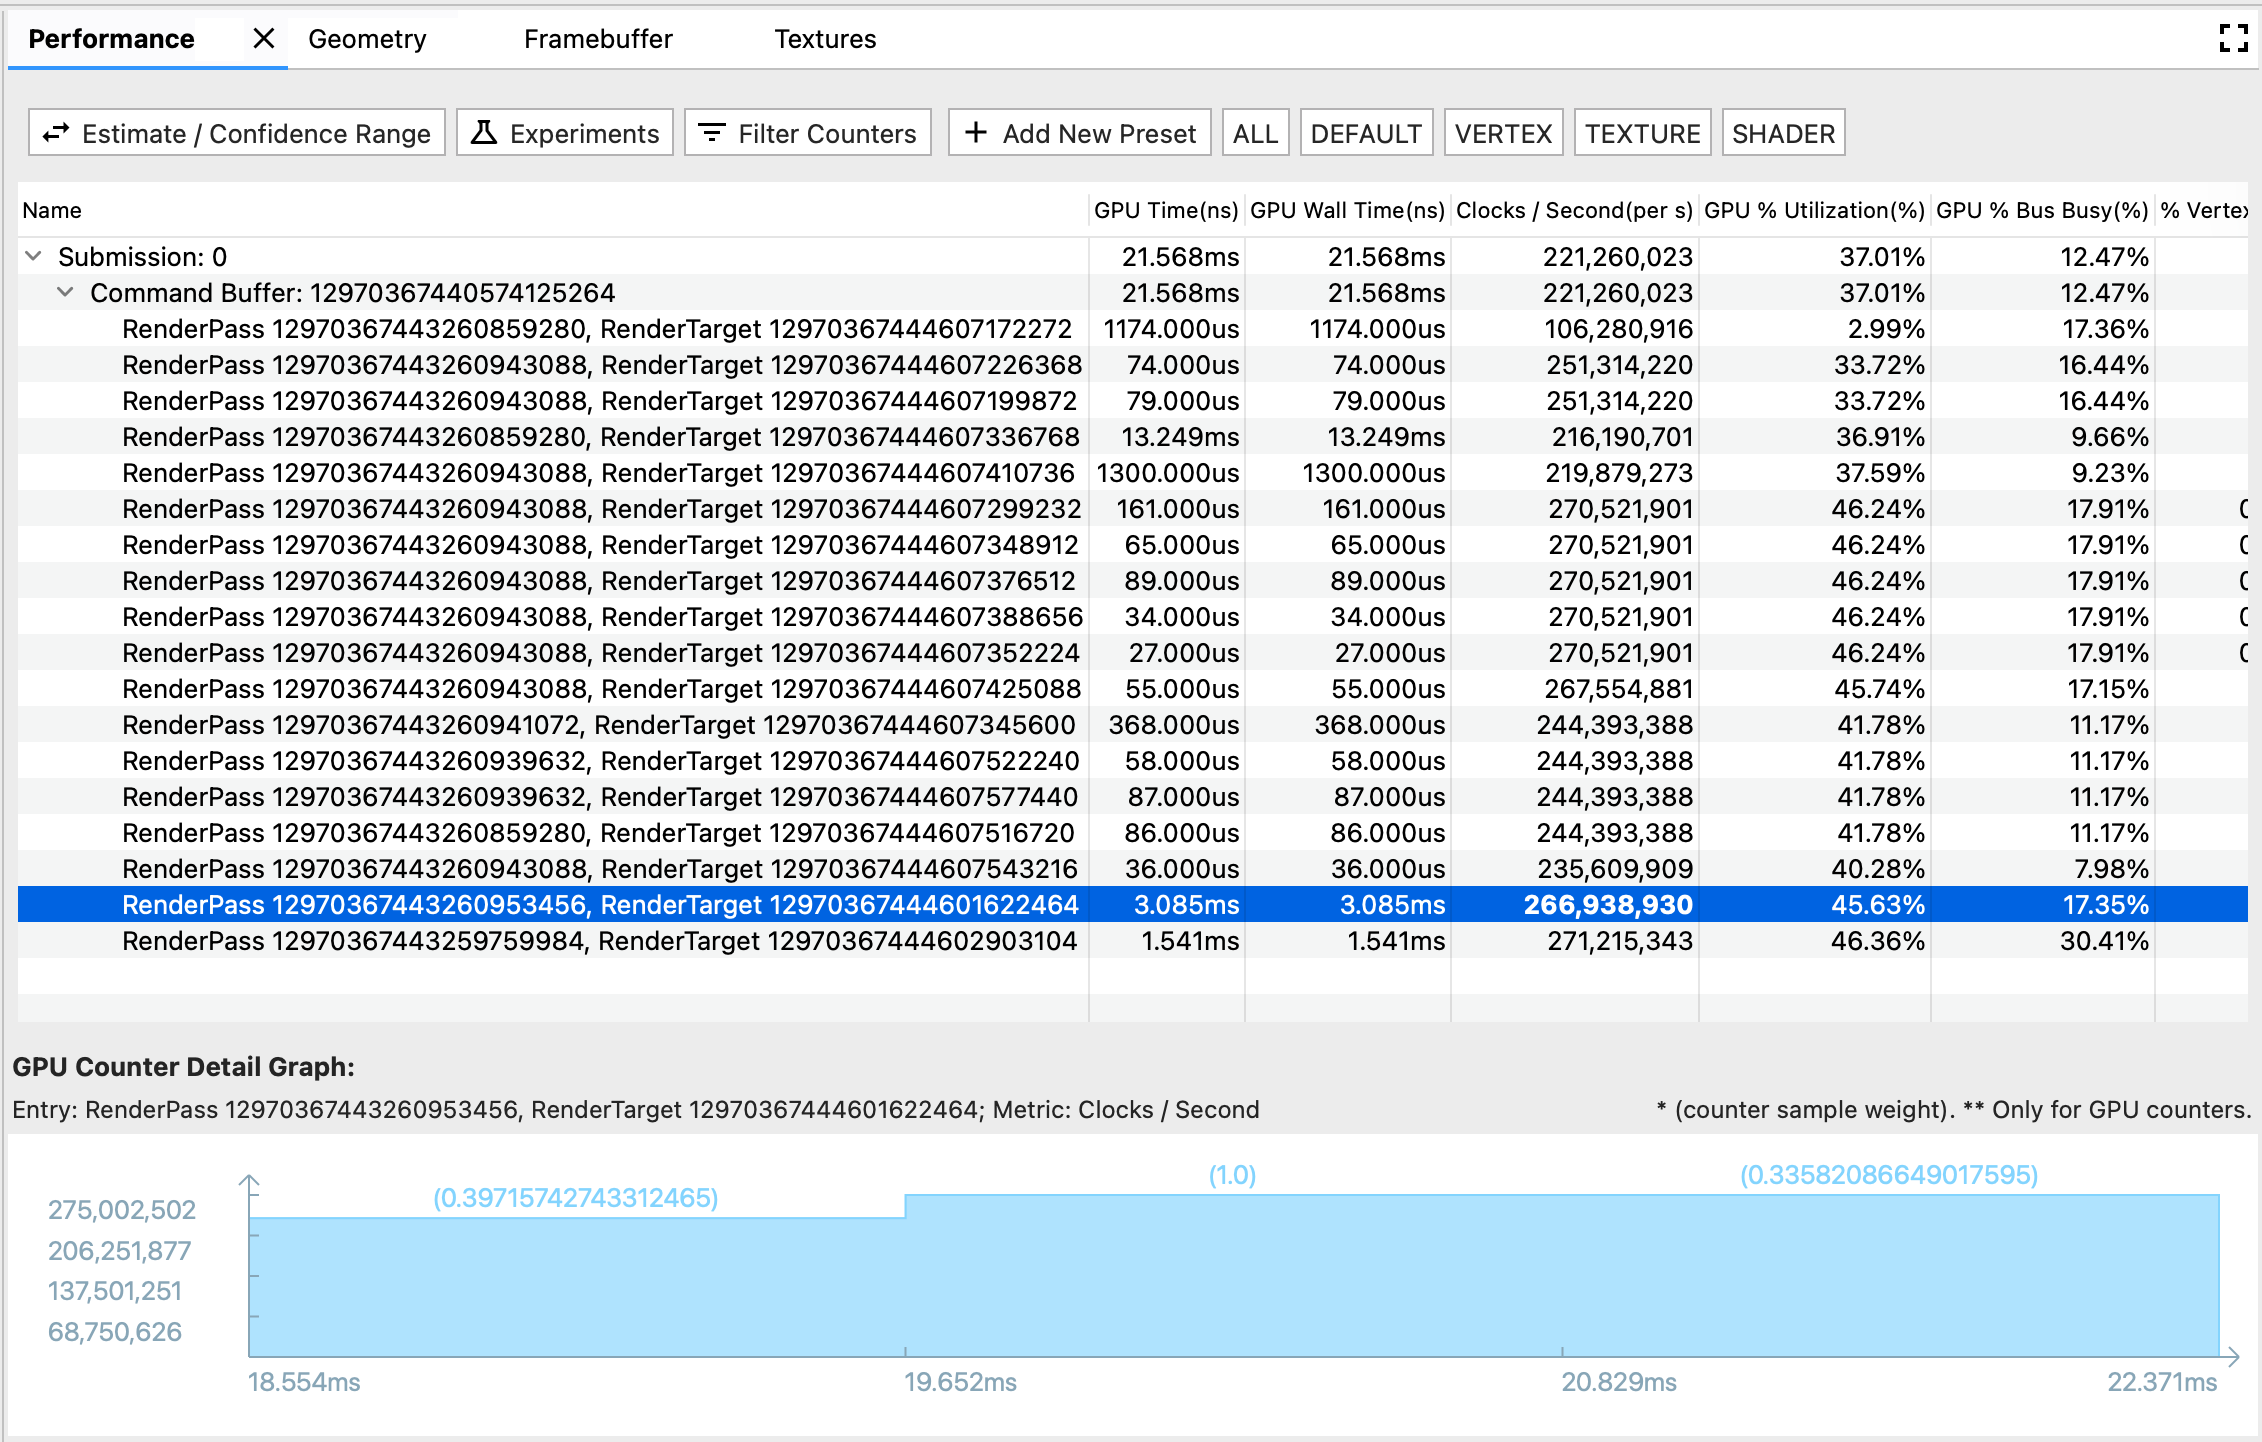
- Performance Table: Performance tab's main tabular view. Each row represents a rendering event, and each column represents a GPU metric (GPU time or GPU counter). In this way, a specific numerical cell represents the specific GPU metric's performance at the specific rendering event.
- GPU Counter Detail Graph: displays in detail how a GPU metric fluctuates during the time when a rendering event happens. The graph only refreshes for GPU counter metrics but not for GPU time metrics, since the time metric is self-explaining and doesn't fluctuate with time.
Toolbar
- Estimate / Confidence Range button: toggles how the performance number is shown. Since GPU counter samples are polled at their own pace, its timeframe may not align perfectly with a rendering event's timeframe. When they are partially overlapped, there may be multiple interpretations of how much the counter sample contributes to the rendering event, ranging from zero contribution to full contribution. Based on the edge cases, we calculated the Confidence Range; and based on overlapped time's weight, we calculated the Estimate.
- Experiment: opens a dialog for choosing the experiment you'd like to run. AGI give you options to try out some common optimization practices with no need of re-compiling your application. When you kick off an experiment, AGI replays the frame based with the new setting, and update the GPU performance table accordingly.
- Filter Counters: opens a dialog for choosing which metric columns you'd like to show in the Performance Table.
- Presets Bar: composed by an Add New Preset button with following customized preset buttons. A preset is a pre-defined combination of GPU metrics. When you click a preset button, the Performance Table shows a filtered list of the pre-defined metrics. You can also manage presets in the Add New Preset dialog.
Performance Table
This table links with Profile pane and Command pane. A rendering event has three representation formats in a trace: a row in Performance pane, a slice in Profile pane, and a node in Command pane. To make it easier for browsing, when you select either one of the formats, the other two are highlighted as well. For example, if you are interested in the longest slice in Profile pane, you could select it, and navigate to the highlighted Performance row to look at detailed GPU counter performances for this event.
GPU counter detail graph
- The x-axis shows counter samples' timestamps. Note that the time is based on the start time of the very first rendering event, so sometimes you may see negative timestamp in the counter detail graph for the first counter sample, which partially overlaps with the first rendering event.
- The y-axis shows counter samples' metric performance value.
- The parenthesized number above each bar shows the counter sample's weight, or how much contribution we consider the sample provides towards the rendering event, in the estimated scenario.