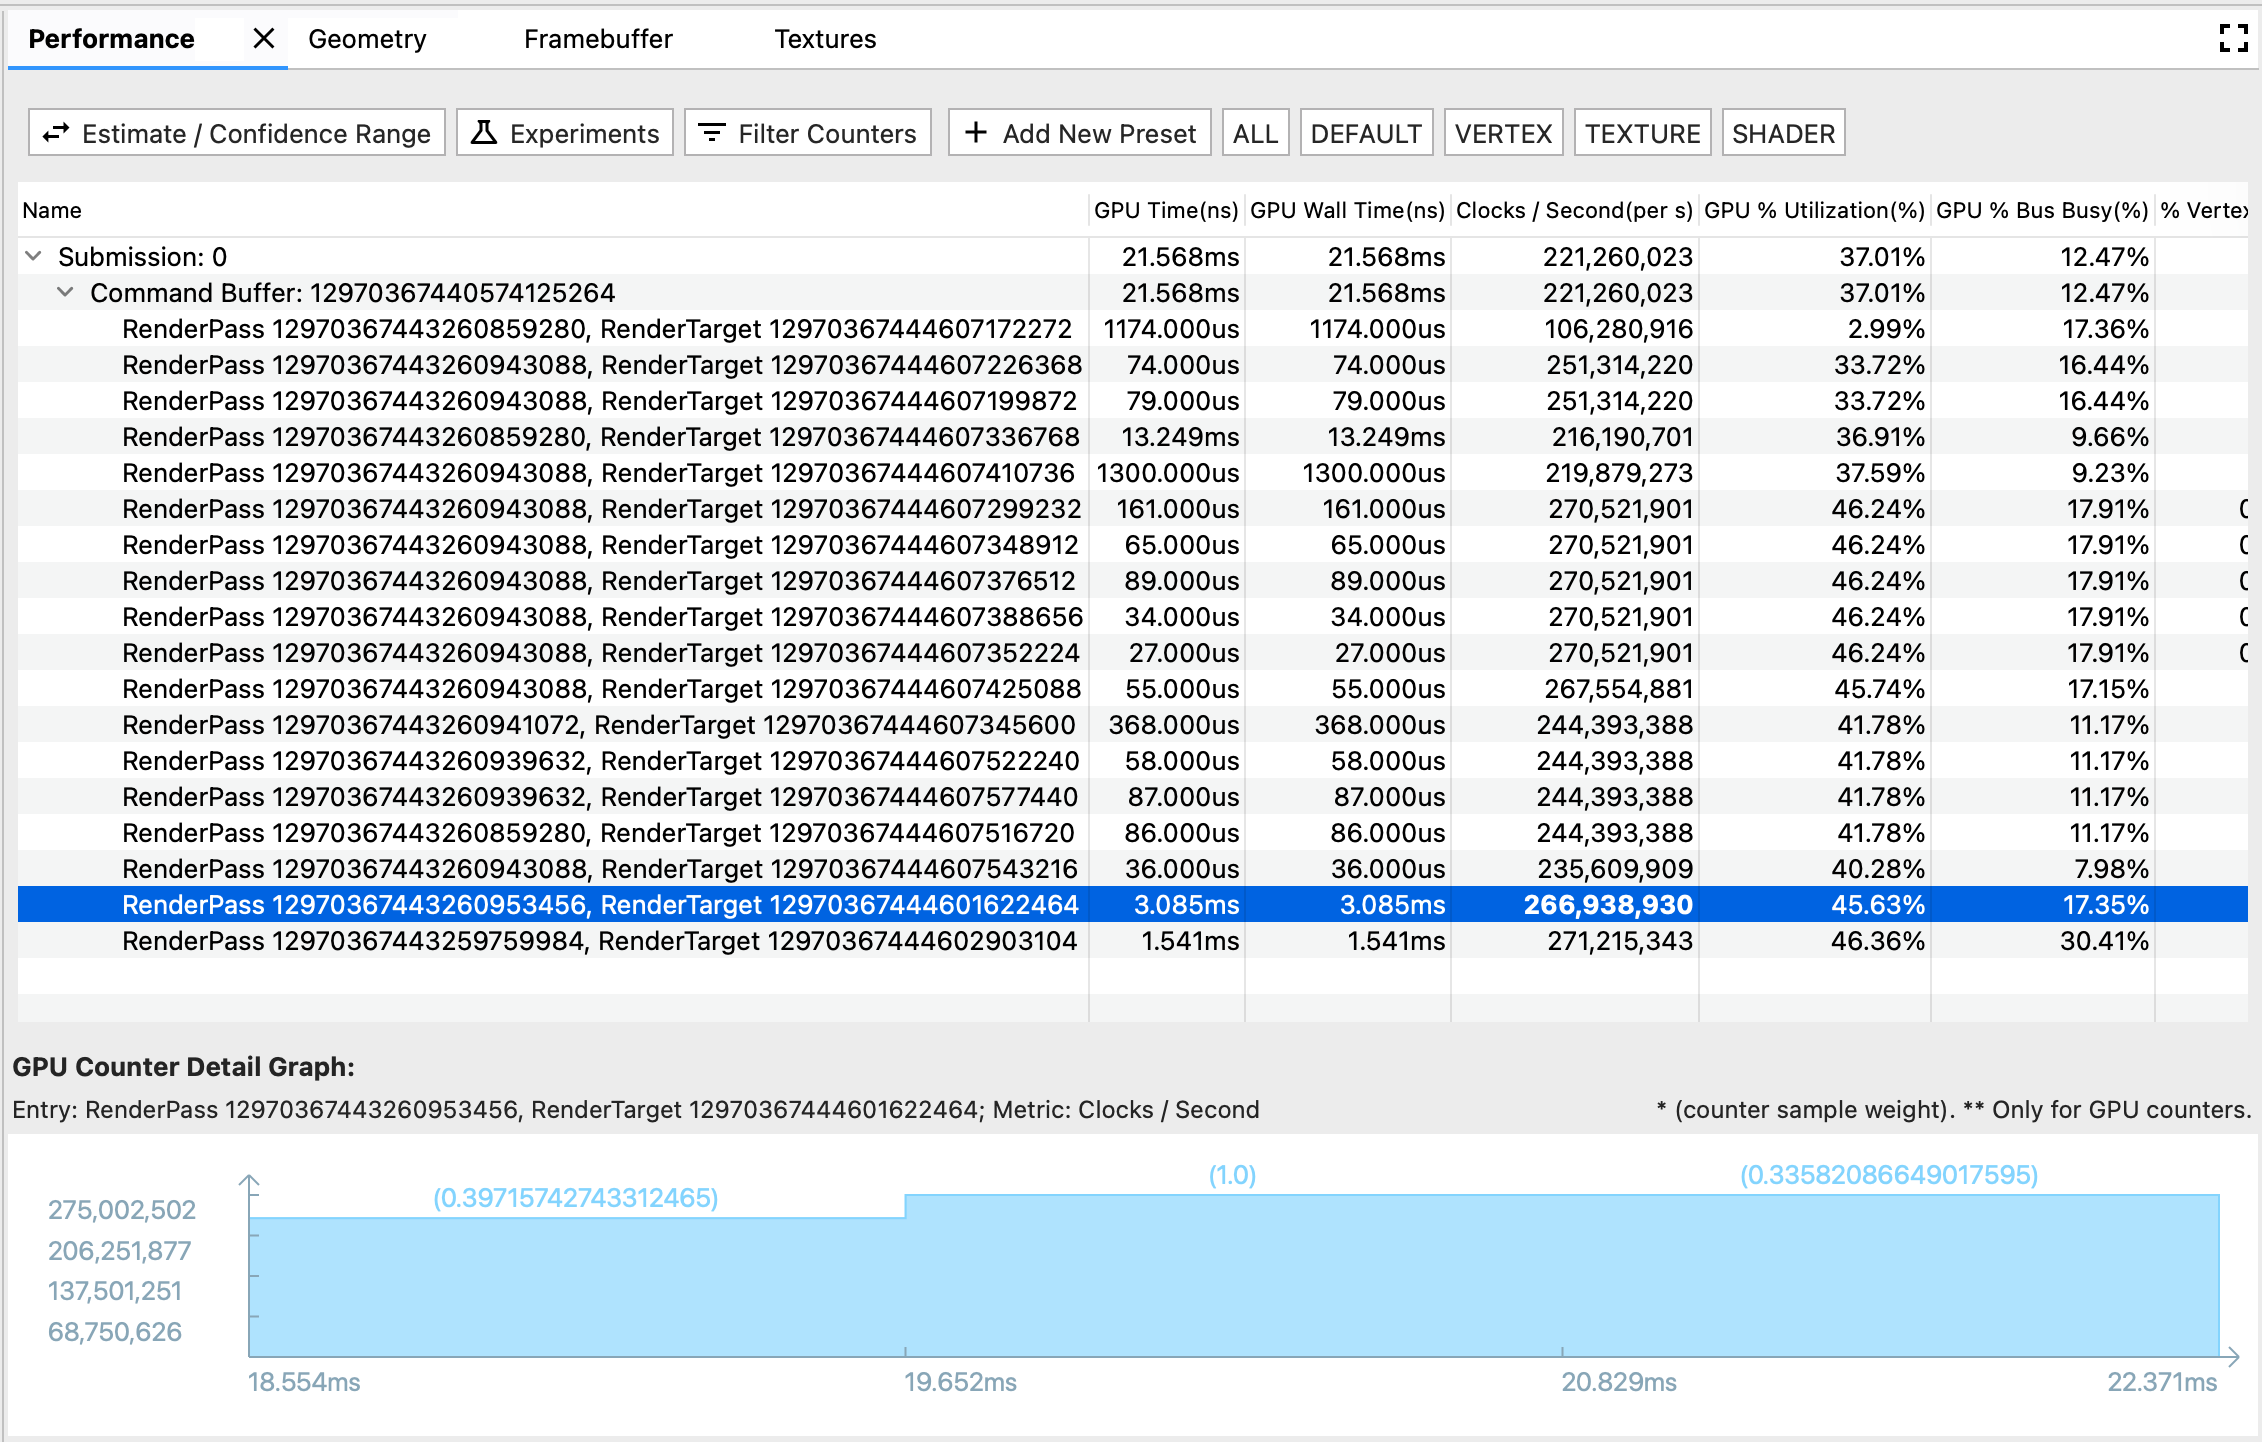
실적 표: 실적 탭의 기본 표 형식 보기입니다. 각 행은 렌더링 이벤트를 나타내며 각 열은 GPU 측정항목 (GPU 시간 또는 GPU 카운터)을 나타냅니다. 이러한 방식으로 특정 숫자 셀은 특정 렌더링 이벤트에서의 특정 GPU 측정항목의 성능을 나타냅니다.
GPU 카운터 세부정보 그래프: 렌더링 이벤트가 발생하는 동안 GPU 측정항목이 변동하는 방식을 자세히 보여줍니다. 그래프는 GPU 카운터 측정항목에 대해서만 새로고침되고 GPU 시간 측정항목은 새로고침되지 않습니다. 시간 측정항목은 스스로 설명할 수 있고 시간에 따라 변동하지 않기 때문입니다.
툴바
추정 / 신뢰 범위 버튼: 성능 수치가 표시되는 방식을 전환합니다. GPU 카운터 샘플은 자체 속도로 폴링되므로 테스트 기간이 렌더링 이벤트의 기간과 완벽하게 일치하지 않을 수 있습니다. 기여 분석이 부분적으로 겹치는 경우, 0의 기여도부터 완전한 기여도까지 카운터 샘플이 렌더링 이벤트에 얼마나 기여하는지 다양하게 해석할 수 있습니다. Google은 특이 사례를 바탕으로 신뢰도 범위를 계산하고, 겹치는 시간의 가중치를 기준으로 추정치를 계산했습니다.
실험: 실행할 실험을 선택하는 대화상자가 열립니다. AGI는 애플리케이션을 다시 컴파일할 필요 없이 몇 가지 일반적인 최적화 권장사항을 시도해 볼 수 있는 옵션을 제공합니다. 실험을 시작하면 AGI가 새 설정에 따라 프레임을 재생하고 그에 따라 GPU 성능 테이블을 업데이트합니다.
필터 카운터: 성능 표에 표시할 측정항목 열을 선택하는 대화상자가 열립니다.
사전 설정 막대: 맞춤설정된 사전 설정 버튼이 있는 새 사전 설정 추가 버튼으로 구성됩니다. 사전 설정은 GPU 측정항목의 사전 정의된 조합입니다. 사전 설정된 버튼을 클릭하면 성능 표에 사전 정의된 측정항목의 필터링된 목록이 표시됩니다. Add New Preset 대화상자에서 사전 설정을 관리할 수도 있습니다.
실적 표
이 테이블은 프로필 창 및 명령어 창에 연결됩니다. 렌더링 이벤트에는 Performance 창의 행, Profile 창의 슬라이스, Command 창의 노드 등 세 가지 표현 형식이 있습니다. 쉽게 탐색할 수 있도록 두 형식 중 하나를 선택하면 다른 두 가지 형식도 강조표시됩니다. 예를 들어 Profile 창에서 가장 긴 슬라이스에 관심이 있다면 이를 선택하고 강조 표시된 Performance 행으로 이동하여 이 이벤트의 자세한 GPU 카운터 성능을 살펴볼 수 있습니다.
GPU 카운터 세부정보 그래프
x축은 카운터 샘플의 타임스탬프를 보여줍니다. 시간은 첫 번째 렌더링 이벤트의 시작 시간을 기반으로 하므로, 첫 번째 카운터 샘플에 대한 카운터 세부정보 그래프에 음수의 타임스탬프가 나타날 수 있으며, 이 타임스탬프는 첫 번째 렌더링 이벤트와 부분적으로 겹칩니다.
y축은 카운터 샘플의 측정항목 성능 값을 보여줍니다.
각 막대 위에 괄호로 묶은 숫자는 카운터 샘플의 가중치 또는 추정된 시나리오에서 샘플이 렌더링 이벤트에 대해 제공하는 것으로 간주되는 정도를 나타냅니다.
이 페이지에 나와 있는 콘텐츠와 코드 샘플에는 콘텐츠 라이선스에서 설명하는 라이선스가 적용됩니다. 자바 및 OpenJDK는 Oracle 및 Oracle 계열사의 상표 또는 등록 상표입니다.
최종 업데이트: 2025-07-27(UTC)
[[["이해하기 쉬움","easyToUnderstand","thumb-up"],["문제가 해결됨","solvedMyProblem","thumb-up"],["기타","otherUp","thumb-up"]],[["필요한 정보가 없음","missingTheInformationINeed","thumb-down"],["너무 복잡함/단계 수가 너무 많음","tooComplicatedTooManySteps","thumb-down"],["오래됨","outOfDate","thumb-down"],["번역 문제","translationIssue","thumb-down"],["샘플/코드 문제","samplesCodeIssue","thumb-down"],["기타","otherDown","thumb-down"]],["최종 업데이트: 2025-07-27(UTC)"],[],[],null,["# Performance pane\n\n**Figure 1.**Performance pane\n\nThe **Performance** pane displays GPU performance for different rendering events.\n\nThere are three components in this pane:\n\n- Toolbar: contains functional buttons for customizing the **Performance Table** or kicking off an experiment.\n- **Performance Table** : **Performance** tab's main tabular view. Each row represents a rendering event, and each column represents a GPU metric (GPU time or GPU counter). In this way, a specific numerical cell represents the specific GPU metric's performance at the specific rendering event.\n- **GPU Counter Detail Graph**: displays in detail how a GPU metric fluctuates during the time when a rendering event happens. The graph only refreshes for GPU counter metrics but not for GPU time metrics, since the time metric is self-explaining and doesn't fluctuate with time.\n\nToolbar\n-------\n\n- **Estimate / Confidence Range** button: toggles how the performance number is shown. Since GPU counter samples are polled at their own pace, its timeframe may not align perfectly with a rendering event's timeframe. When they are partially overlapped, there may be multiple interpretations of how much the counter sample contributes to the rendering event, ranging from zero contribution to full contribution. Based on the edge cases, we calculated the **Confidence Range** ; and based on overlapped time's weight, we calculated the **Estimate**.\n- **Experiment**: opens a dialog for choosing the experiment you'd like to run. AGI give you options to try out some common optimization practices with no need of re-compiling your application. When you kick off an experiment, AGI replays the frame based with the new setting, and update the GPU performance table accordingly.\n- **Filter Counters** : opens a dialog for choosing which metric columns you'd like to show in the **Performance Table**.\n- **Presets Bar** : composed by an **Add New Preset** button with following customized preset buttons. A preset is a pre-defined combination of GPU metrics. When you click a preset button, the **Performance Table** shows a filtered list of the pre-defined metrics. You can also manage presets in the **Add New Preset** dialog.\n\nPerformance Table\n-----------------\n\nThis table links with **Profile** pane and **Command** pane. A rendering event has three representation formats in a trace: a row in **Performance** pane, a slice in **Profile** pane, and a node in **Command** pane. To make it easier for browsing, when you select either one of the formats, the other two are highlighted as well. For example, if you are interested in the longest slice in **Profile** pane, you could select it, and navigate to the highlighted **Performance** row to look at detailed GPU counter performances for this event.\n\nGPU counter detail graph\n------------------------\n\n- The x-axis shows counter samples' timestamps. Note that the time is based on the start time of the very first rendering event, so sometimes you may see negative timestamp in the counter detail graph for the first counter sample, which partially overlaps with the first rendering event.\n- The y-axis shows counter samples' metric performance value.\n- The parenthesized number above each bar shows the counter sample's weight, or how much contribution we consider the sample provides towards the rendering event, in the estimated scenario."]]