הכלי AGI Frame Profiler מאפשר לבחון מעברי רינדור נפרדים שמשמשים להרכבת פריים יחיד באפליקציה. הוא עושה זאת על ידי יירוד ותיעוד של כל המצב שנדרש להפעלת כל קריאה ל-API של הגרפיקה. ב-Vulkan, הפעולה הזו מתבצעת באופן מקורי באמצעות מערכת השכבות של Vulkan. ב-OpenGL, הפקודות נחטפות באמצעות ANGLE, שממיר פקודות OpenGL לקריאות Vulkan כדי שאפשר יהיה להריץ אותן בחומרה.
מכשירי Adreno
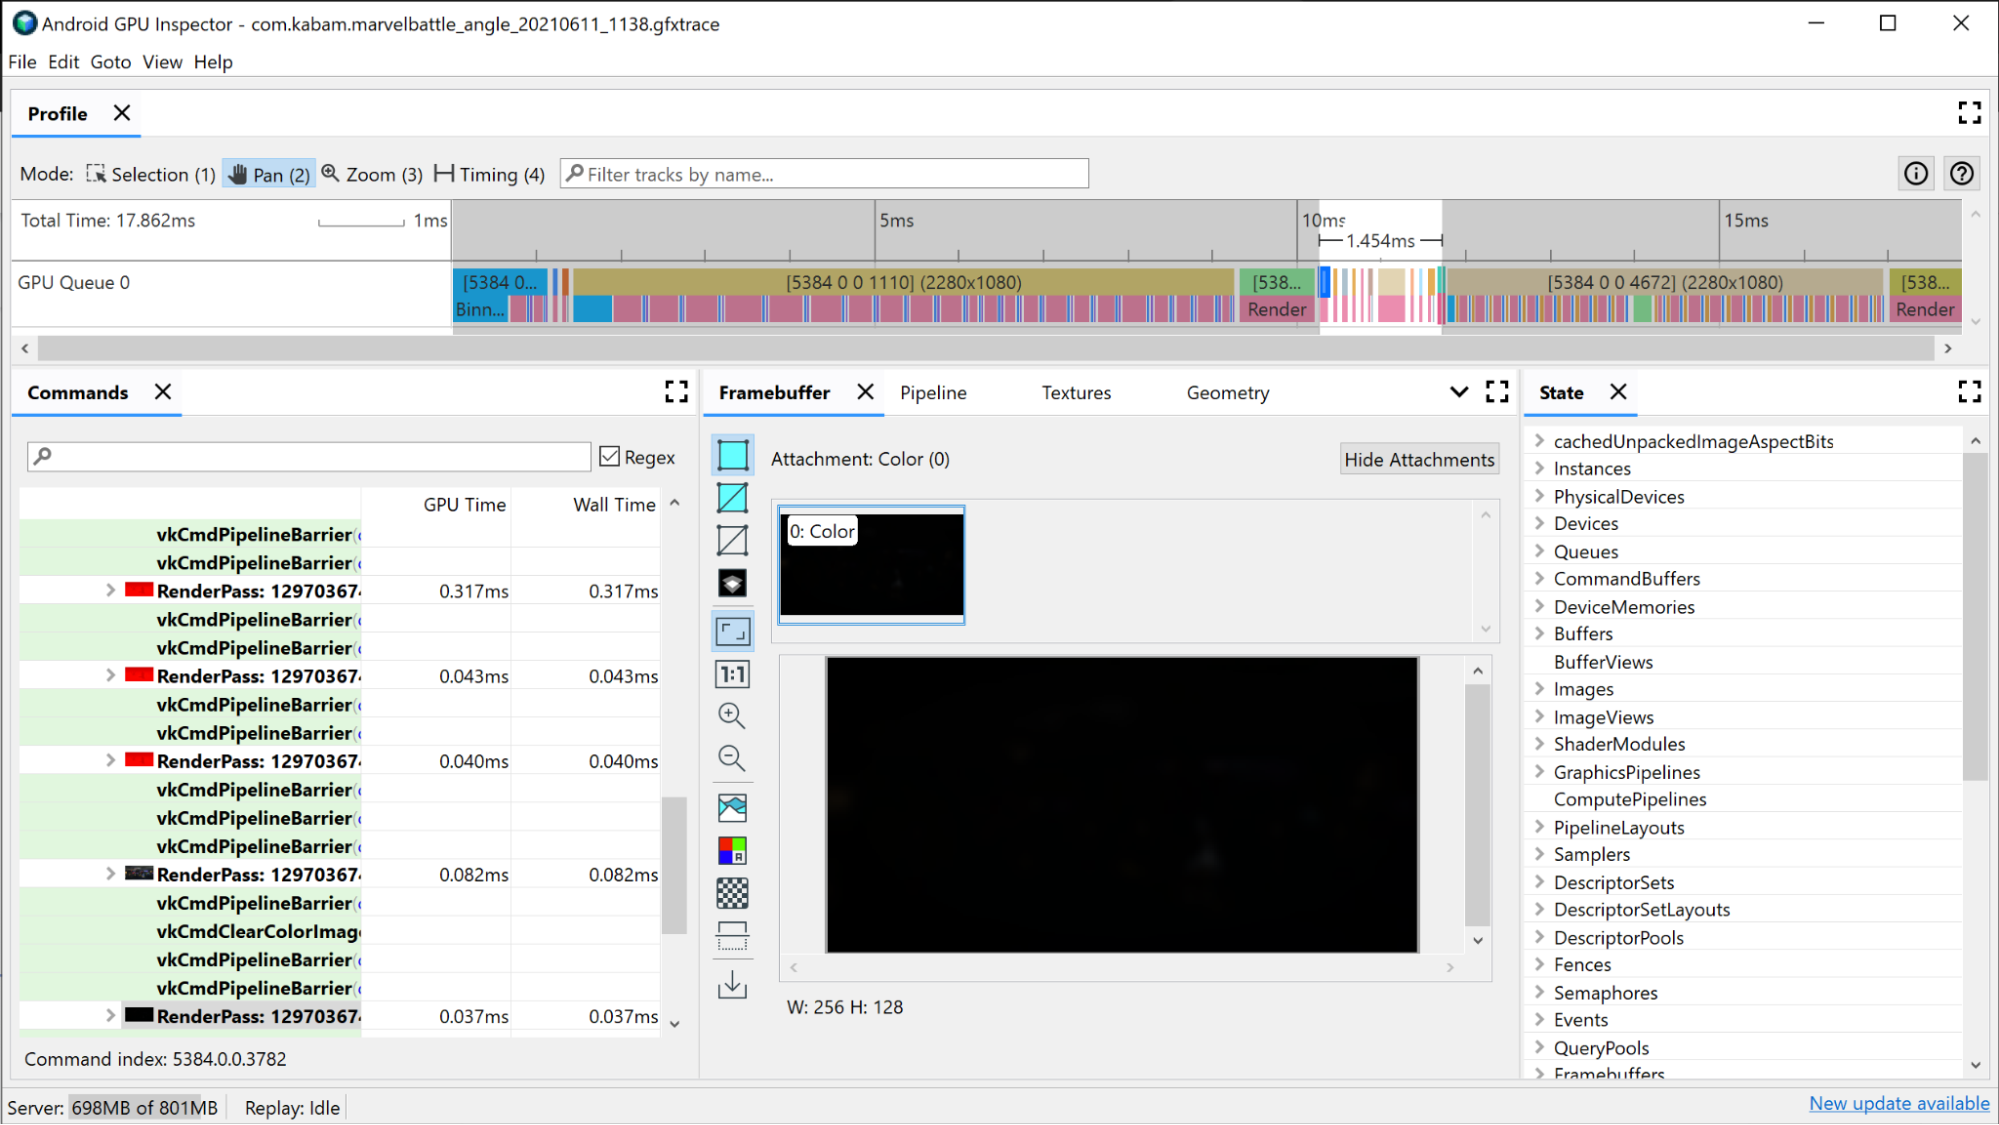
כדי לזהות את שלבי הרינדור היקרים, קודם צריך להסתכל על ציר הזמן של AGI בחלק העליון של החלון. כאן מוצגים כל שלבי הרינדור שמרכיבים את הקומפוזיציה של פריים נתון, בסדר כרונולוגי. זו אותה תצוגה שמופיעה ב-System Profiler אם יש מידע על תור ה-GPU. הוא גם מציג מידע בסיסי על שלב הרינדור, כמו הרזולוציה של מאגרי המסגרות שמבוצע להם רינדור, ויכול לספק תובנות לגבי מה שקורה בשלב הרינדור עצמו.
הקריטריון הראשון שבו אפשר להשתמש כדי לבדוק את שלבי הרינדור הוא משך הזמן שהם נמשכים. סביר להניח שמעבר הרינדור הארוך ביותר הוא זה שיש בו הכי הרבה פוטנציאל לשיפור, ולכן כדאי להתחיל לבדוק אותו.
פרוסת ה-GPU שקשורה למעבר הרנדור הרלוונטי כבר תציג מידע מסוים על מה שקורה במעבר הרנדור:
- סיווג למשבצות: המיקום של הקודקודים נקבע לפי המשבצת שבה הם מופיעים במסך
- רינדור: איפה מוצללים פיקסלים או פרגמנטים
- טעינה/אחסון של GMEM: כשתוכן של מאגר מסגרות נטען או מאוחסן מזיכרון GPU פנימי לזיכרון הראשי
כדי להבין איפה עלולים להיווצר צווארי בקבוק, כדאי לבדוק כמה זמן כל אחד מהשלבים האלה לוקח במהלך שלב הרינדור. לדוגמה:
- אם פעולת ה-Binning אורכת חלק גדול מהזמן, זה מצביע על צוואר בקבוק בנתוני Vertex, כלומר יש יותר מדי קודקודים, קודקודים גדולים או בעיות אחרות שקשורות לקודקודים.
- אם העיבוד תופס את רוב הזמן, זה מצביע על כך שההצללה היא צוואר הבקבוק. הסיבות האפשריות הן: הצללות מורכבות, יותר מדי אחזורי טקסטורה, רינדור למאגר מסגרות ברזולוציה גבוהה כשאין בכך צורך או בעיות אחרות שקשורות לכך.
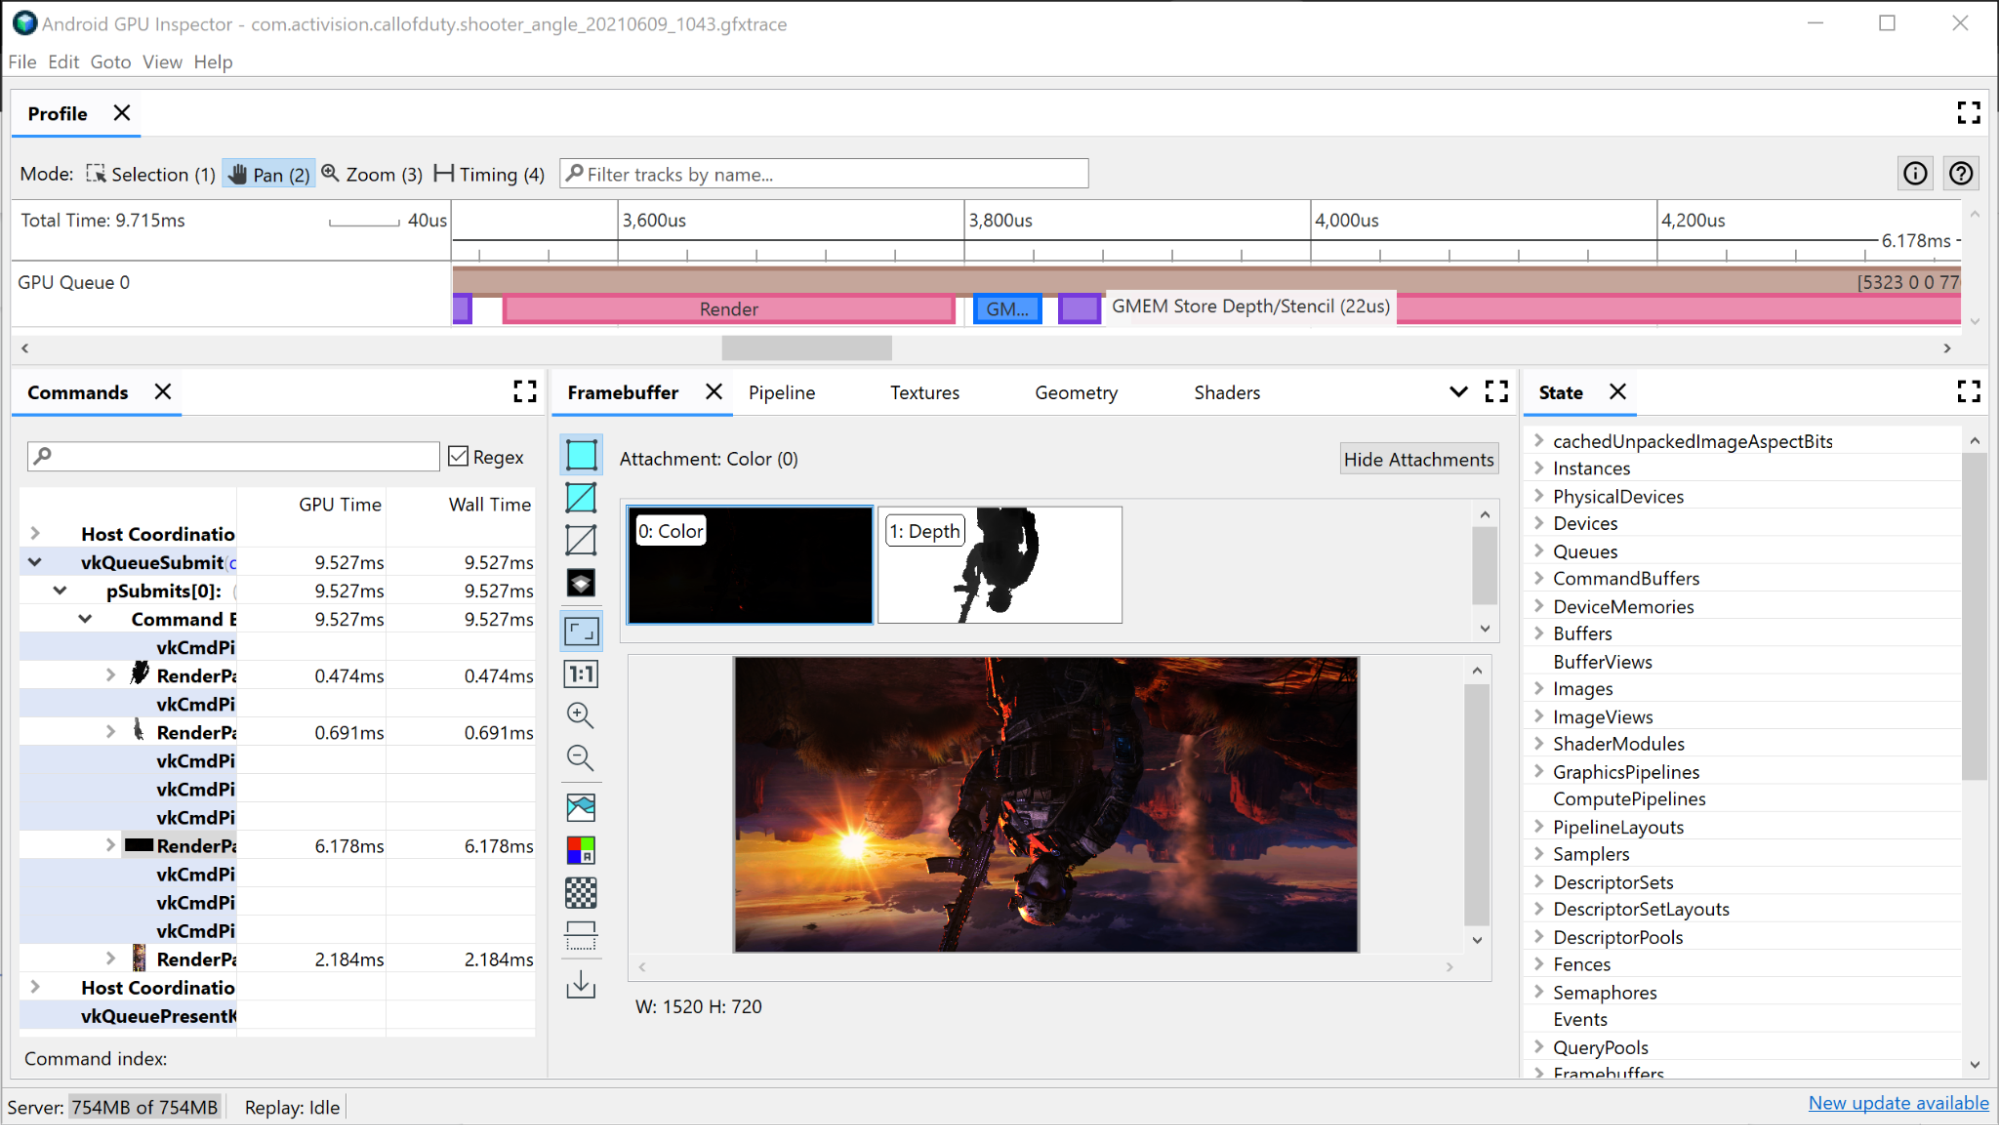
כדאי לזכור גם את הטעינה והאחסון של GMEM. העברת נתונים מזיכרון הגרפיקה לזיכרון הראשי היא יקרה, ולכן צמצום מספר פעולות הטעינה או האחסון ישפר גם את הביצועים. דוגמה נפוצה לכך היא שימוש ב-GMEM לאחסון עומק/שבלונה, שכותב את מאגר העומק/השבלונה לזיכרון הראשי. אם לא משתמשים במאגר הזה במעברי רינדור עתידיים, אפשר לבטל את פעולת האחסון הזו ולחסוך זמן מסגרת ורוחב פס של הזיכרון.
חקירה של מעבר רינדור גדול
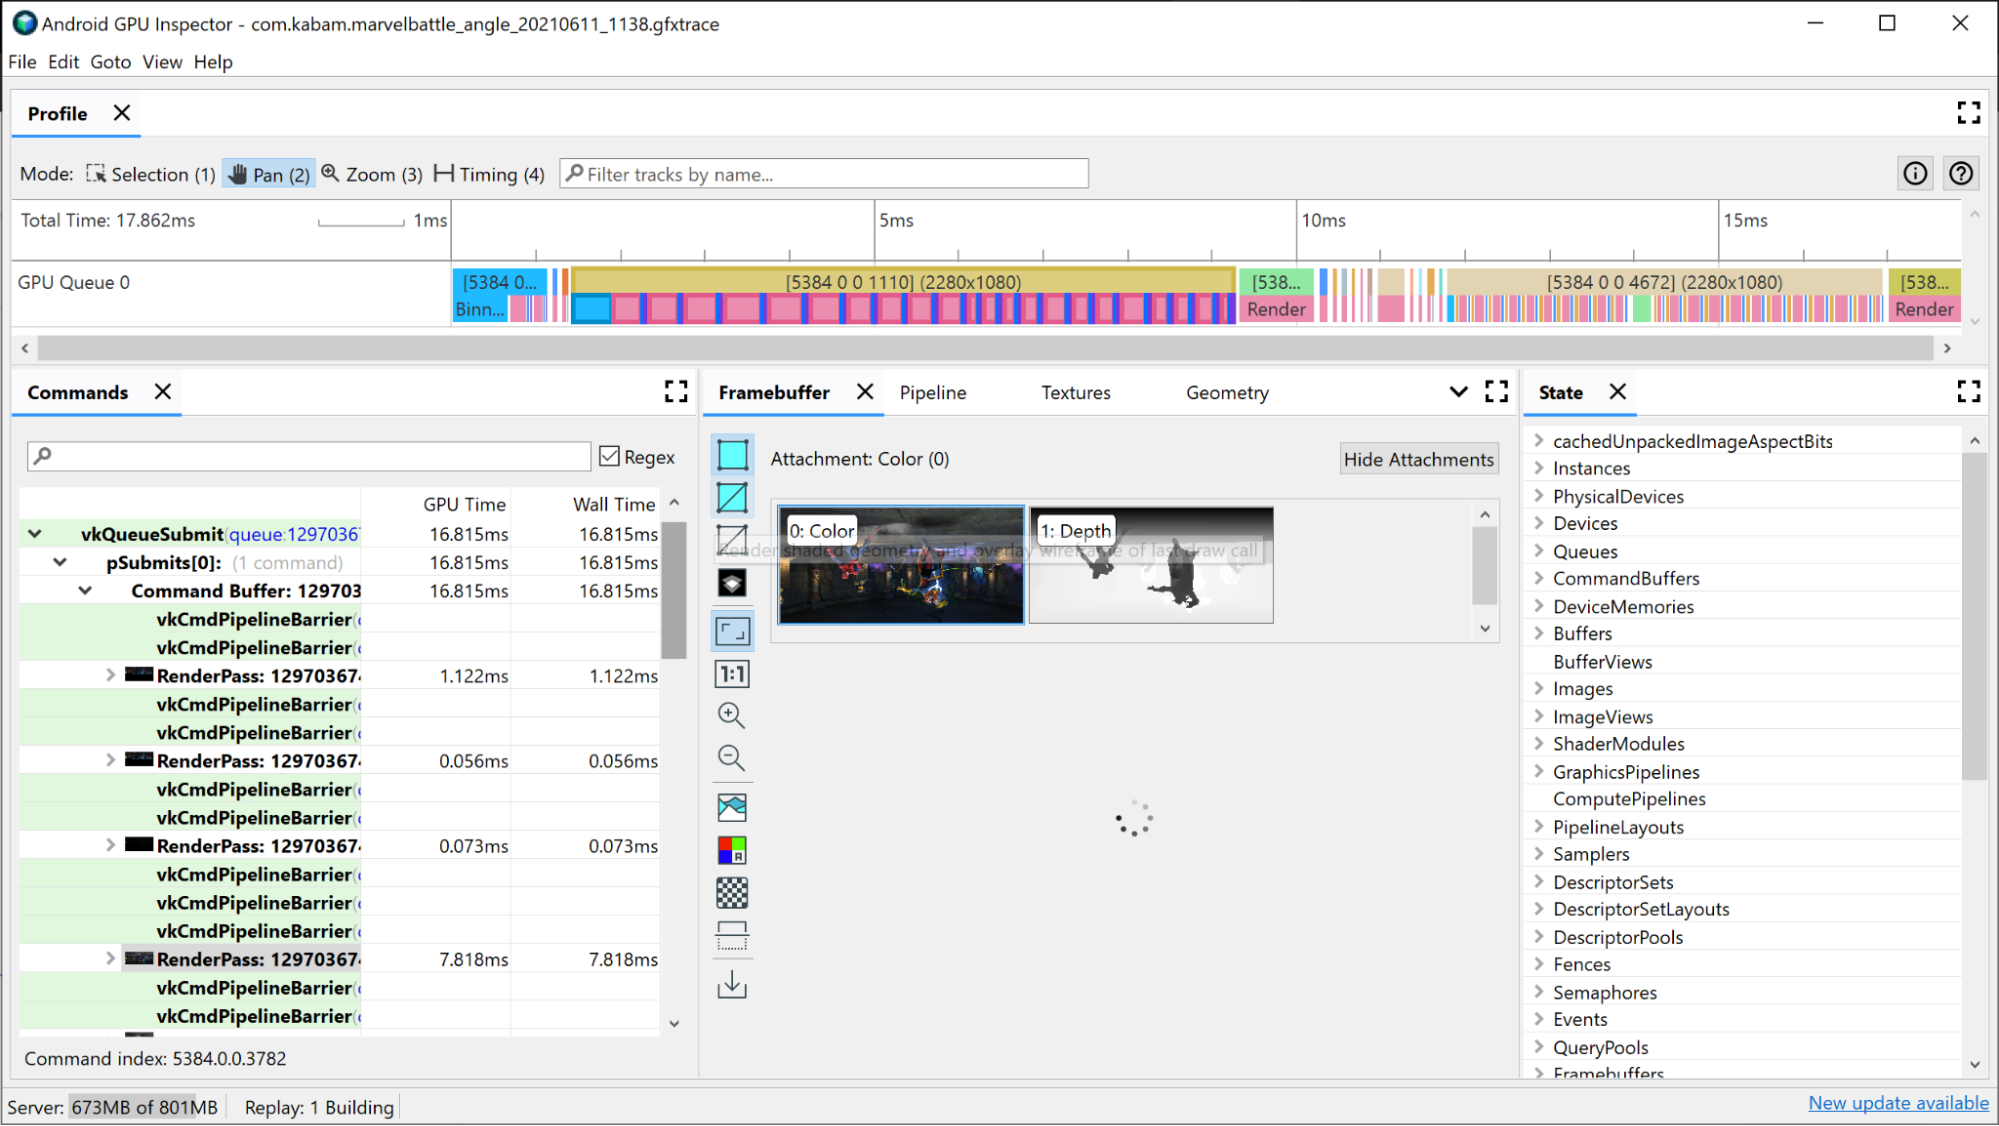
כדי לראות את כל פקודות הציור הנפרדות שהונפקו במהלך שלב העיבוד:
לוחצים על שלב הרינדור בציר הזמן. הפעולה הזו תפתח את שלב הרינדור בהיררכיה שנמצאת בחלונית Commands של Frame Profiler.
לוחצים על התפריט של כרטיס העברת הרינדור, שבו מוצגות כל פקודות הציור הבודדות שהונפקו במהלך העברת הרינדור. אם מדובר באפליקציית OpenGL, אפשר להעמיק עוד יותר ולראות את פקודות Vulkan שהונפקו על ידי ANGLE.
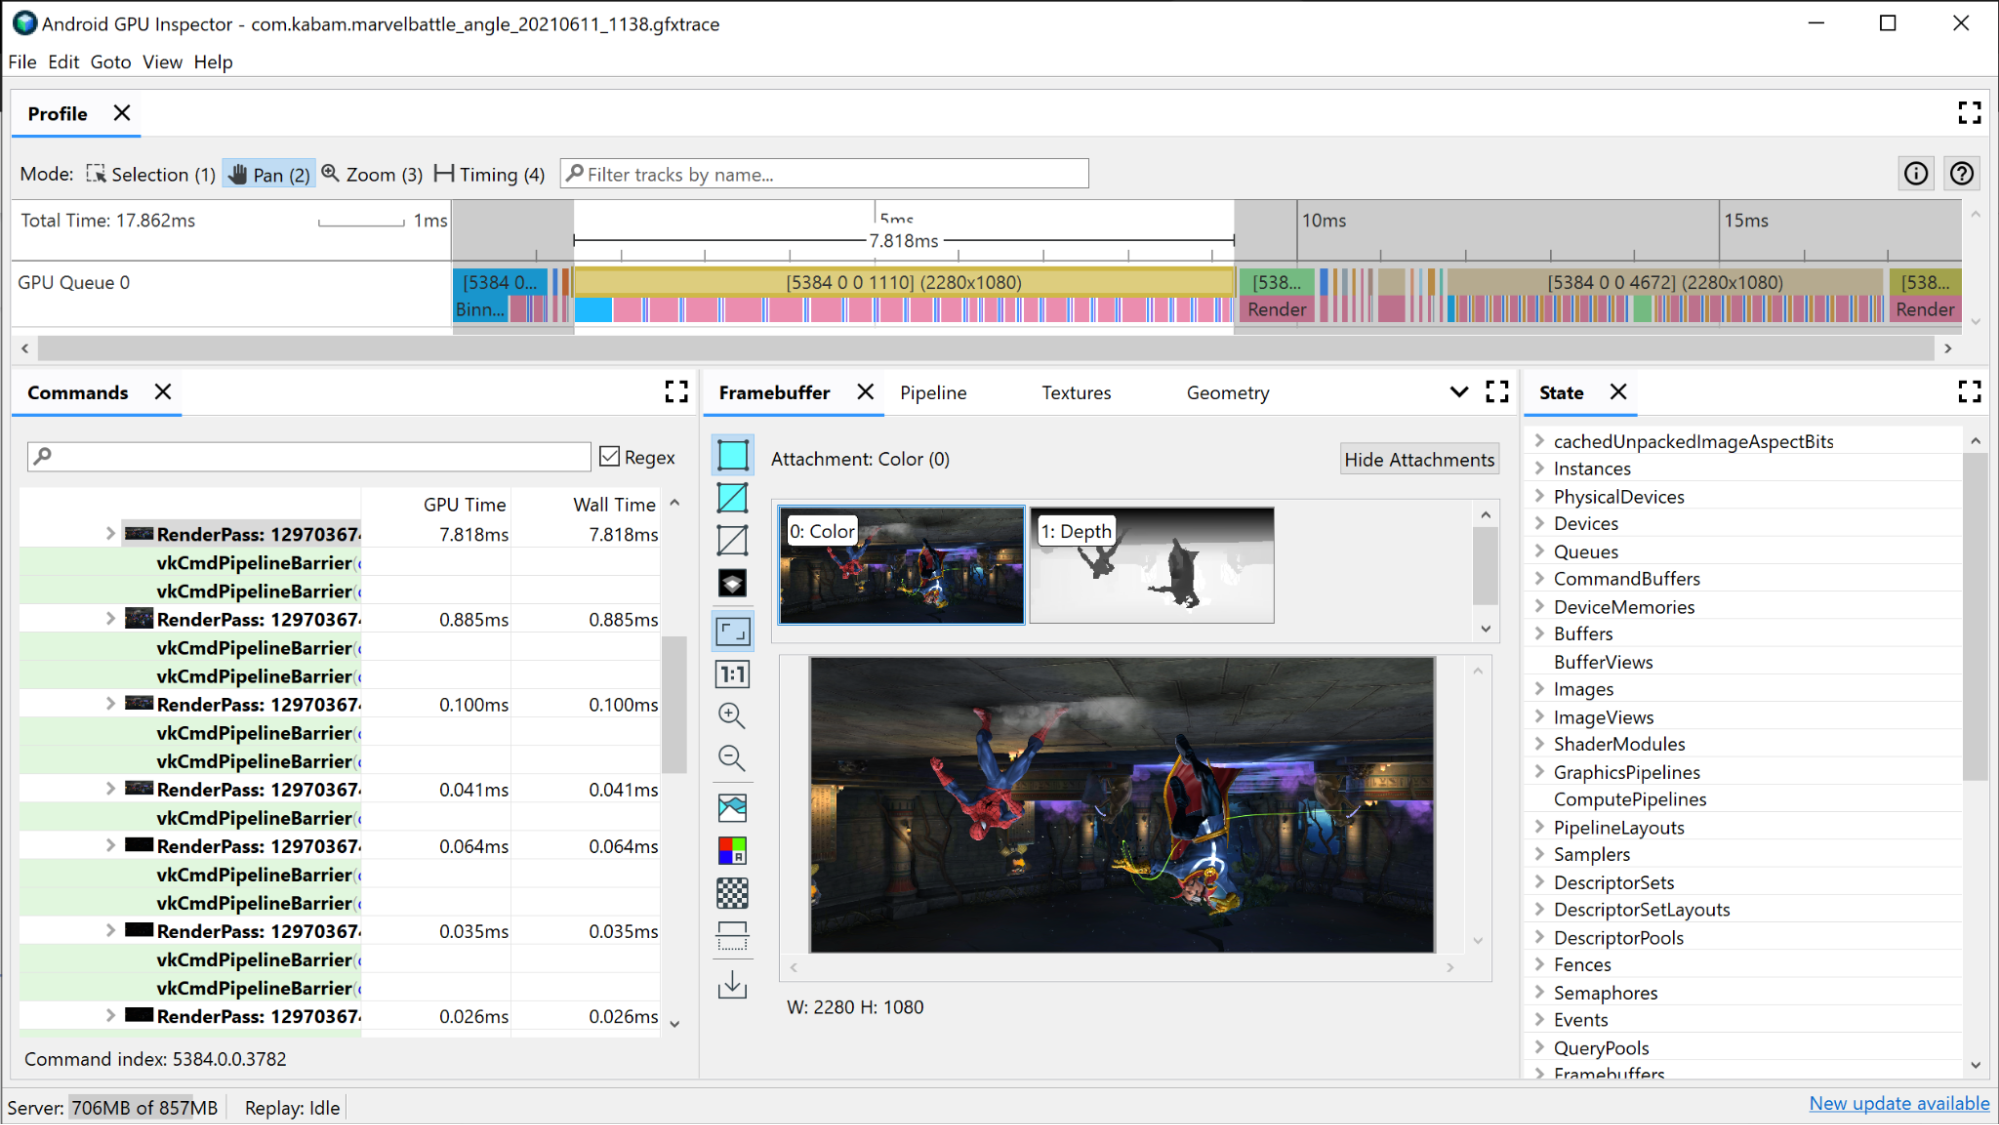
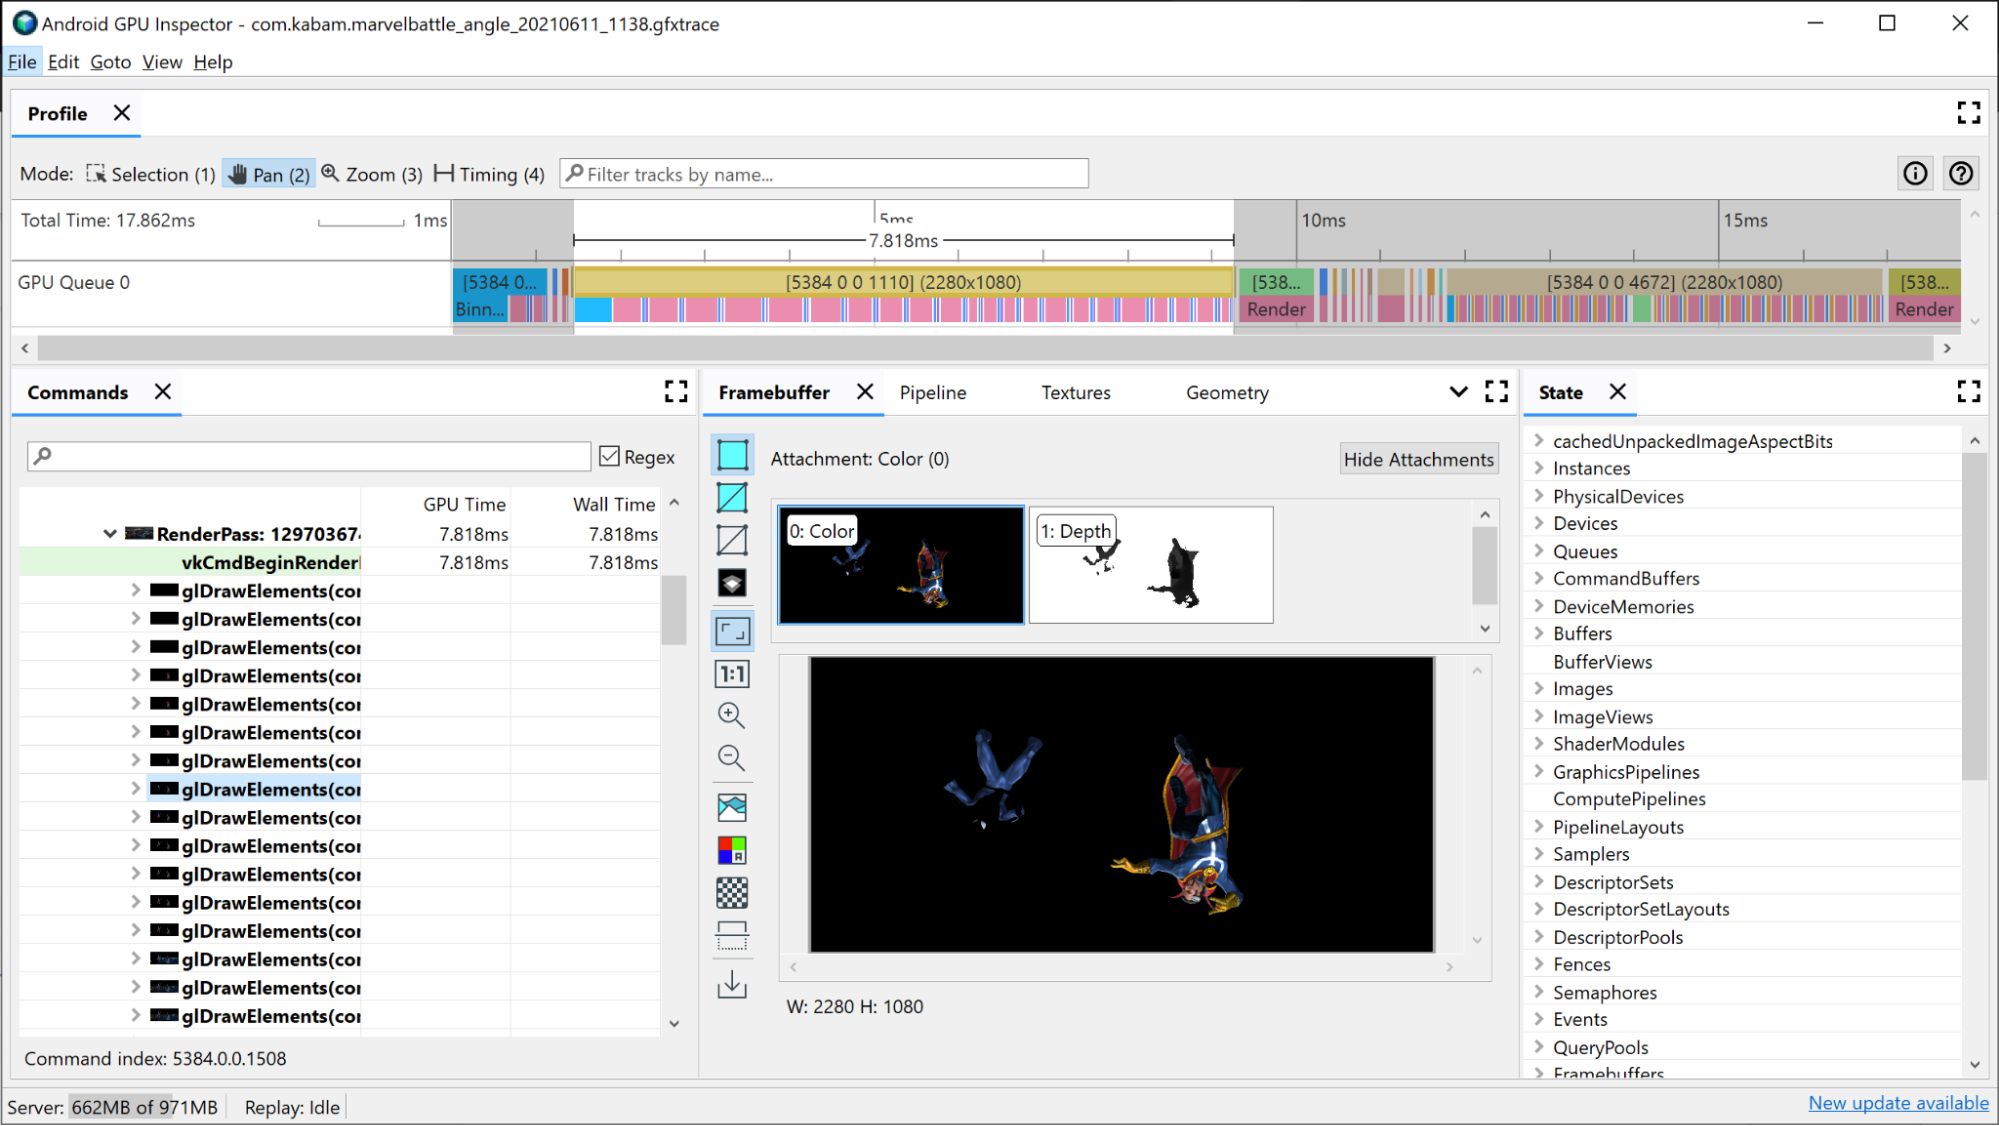
בוחרים אחת מהקריאות לציור. ייפתח החלונית Framebuffer, שבה מוצגים כל הקבצים המצורפים של framebuffer שאוגדו במהלך הציור הזה, והתוצאה הסופית של הציור ב-framebuffer המצורף. כאן אפשר גם להשתמש ב-AGI כדי לפתוח את קריאות הציור הקודמות והבאות, ולהשוות את ההבדל ביניהן. אם הן כמעט זהות מבחינה ויזואלית, כדאי לבטל קריאה לציור שלא תורמת לתמונה הסופית.
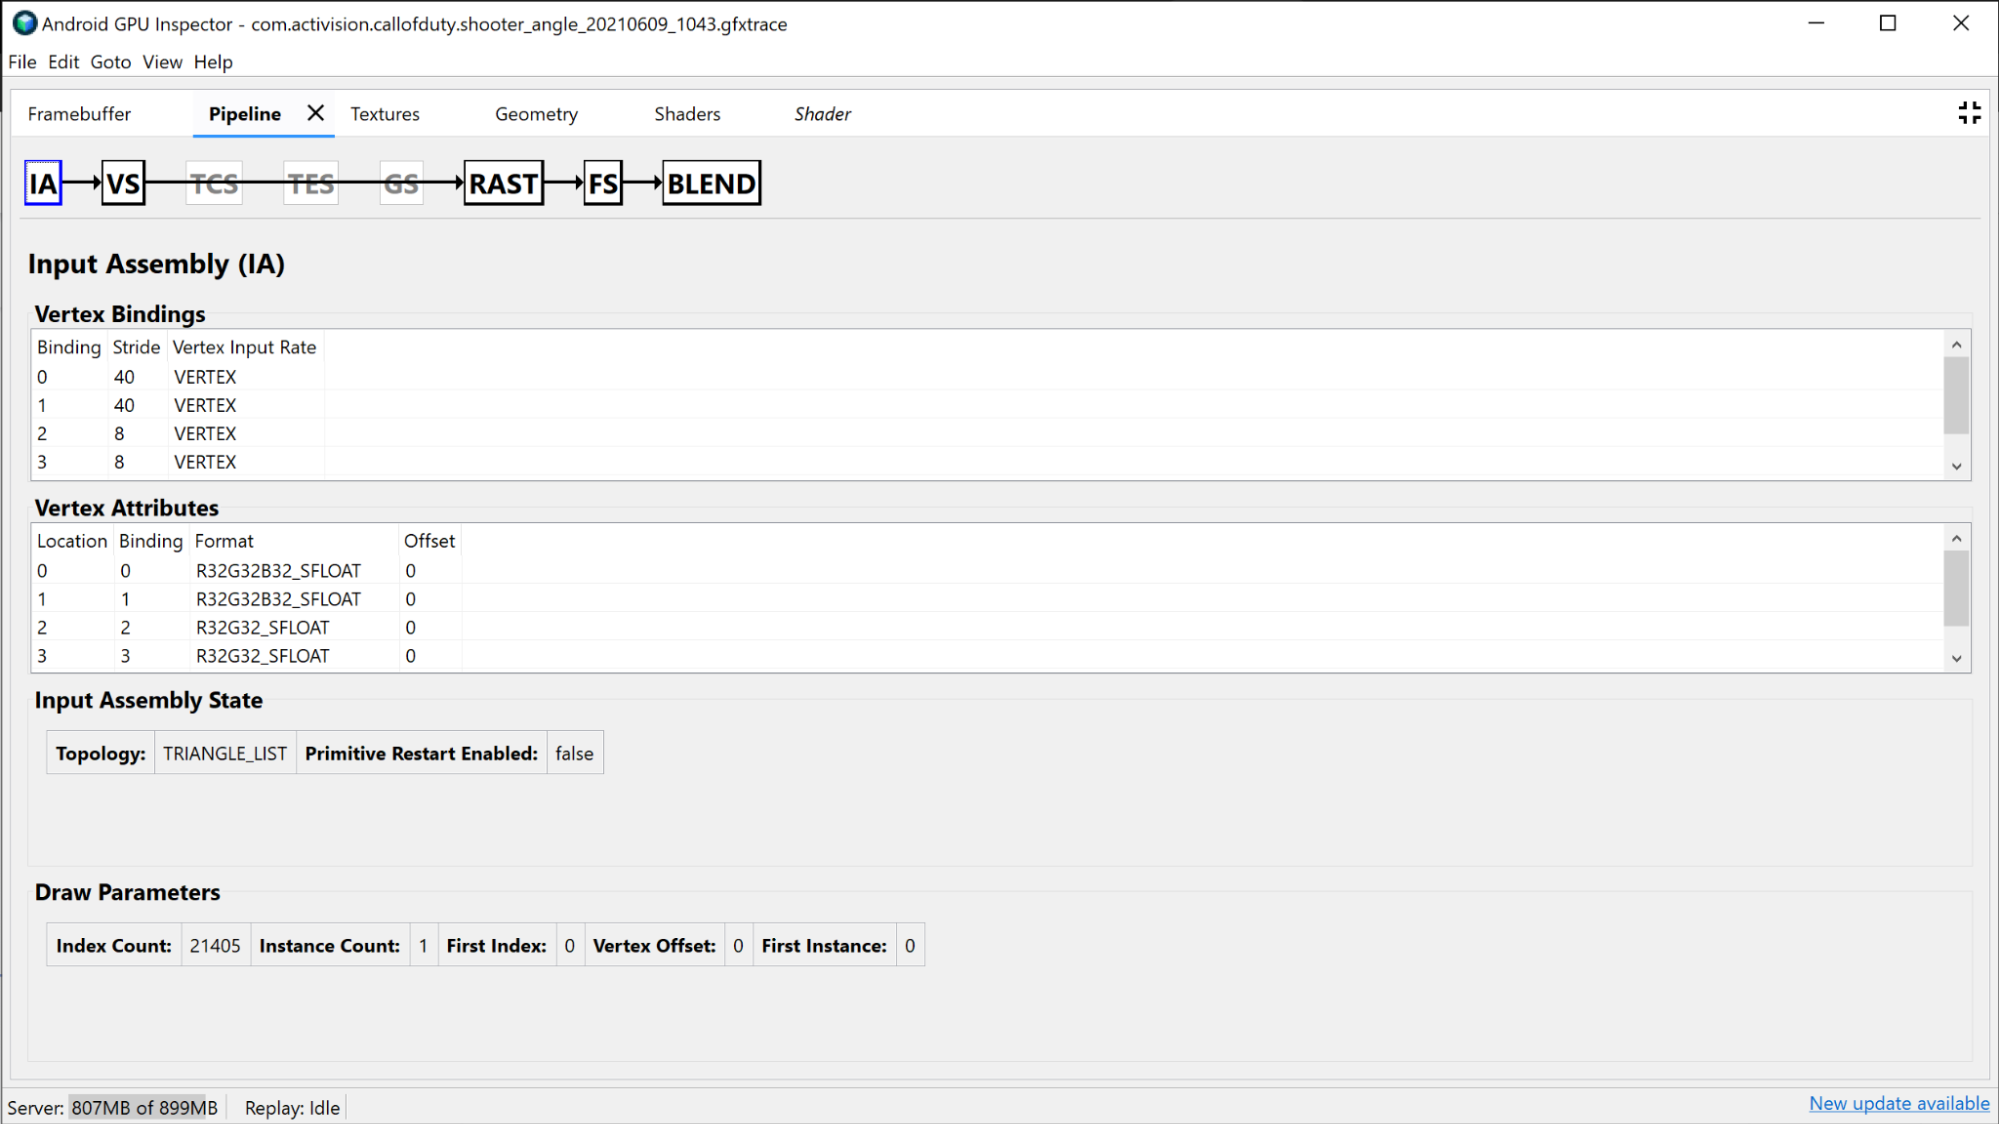
כשפותחים את החלונית Pipeline לציור הזה, מוצג המצב שצינור העיבוד הגרפי השתמש בו כדי להפעיל את קריאת הציור הזו.
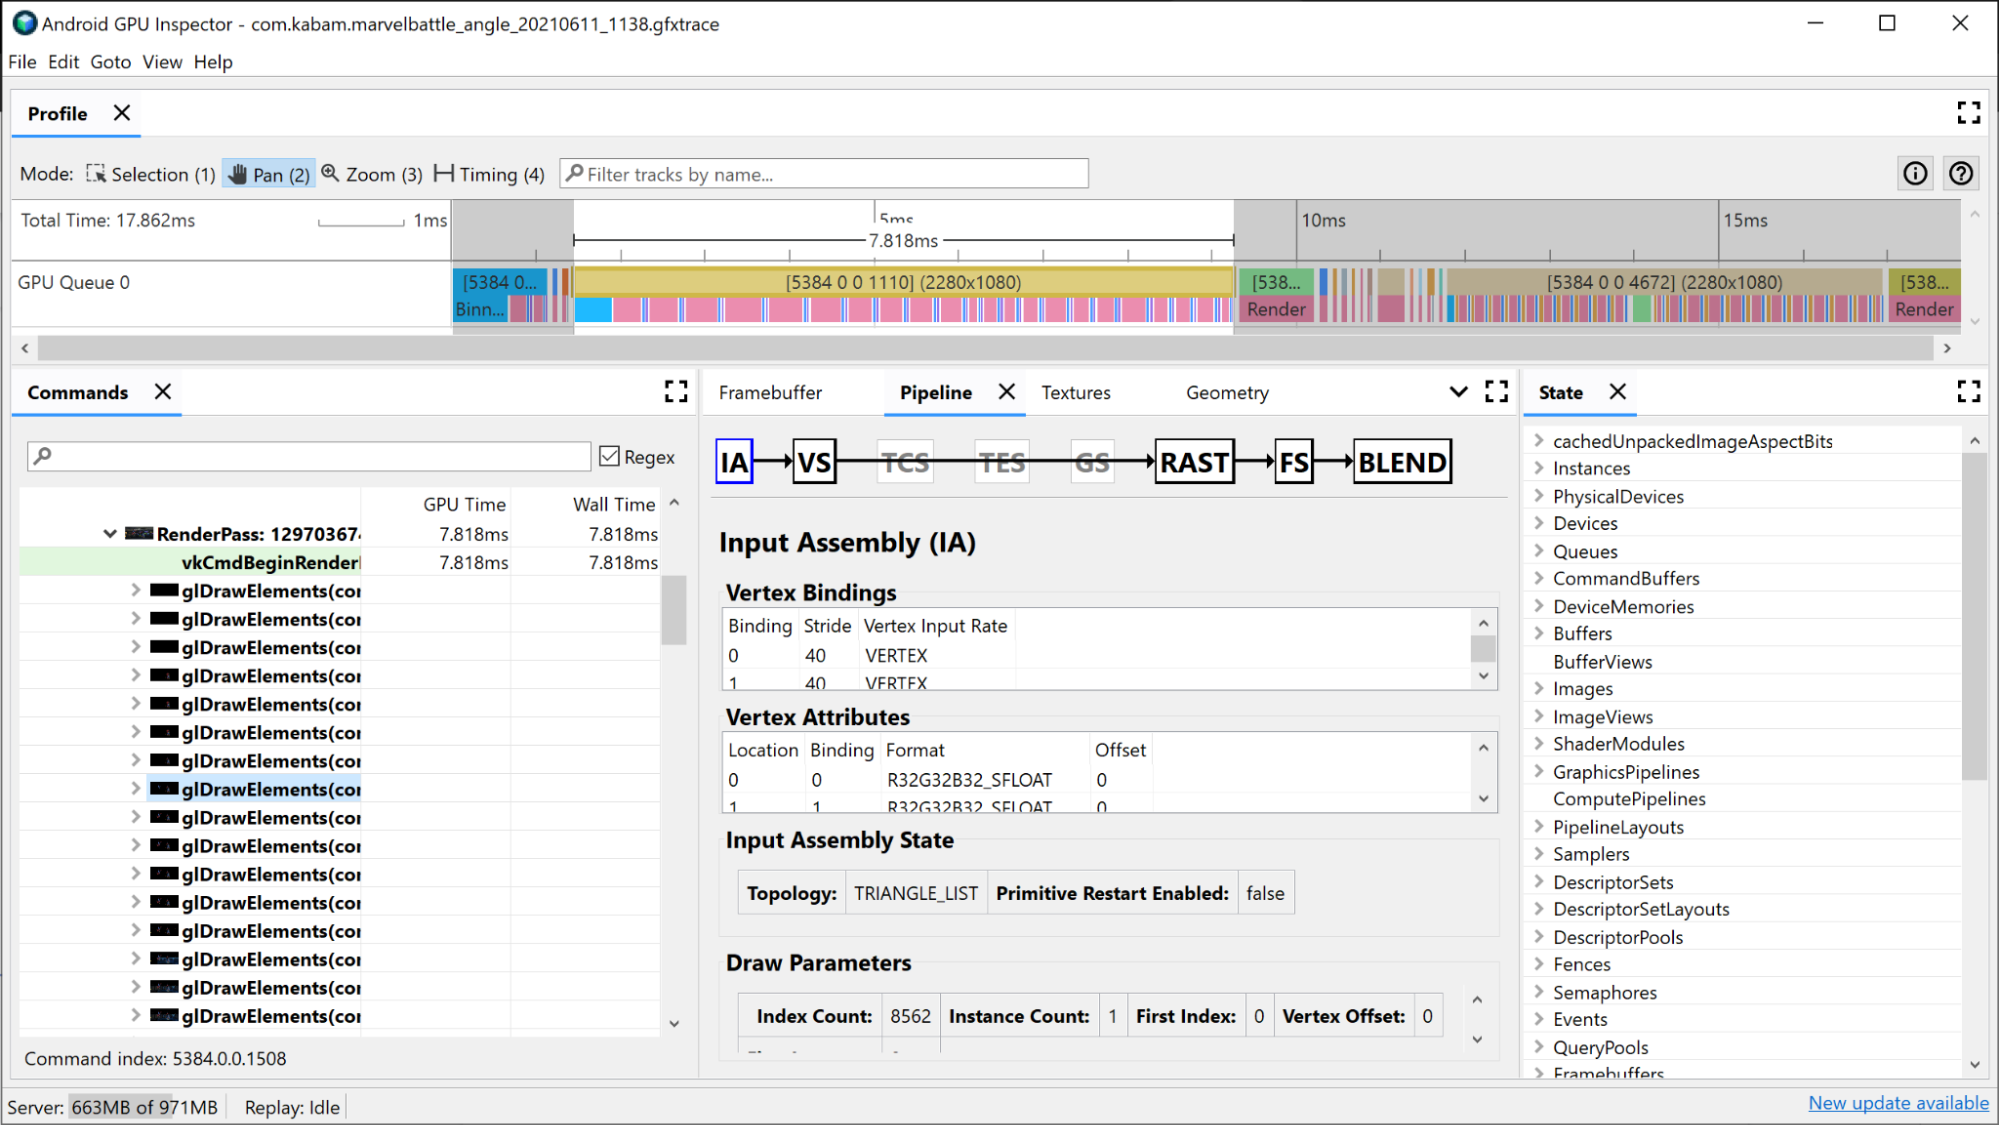
בInput Assembler מופיע מידע על האופן שבו נתוני הקודקודים קושרו לציור הזה. כדאי לבדוק את האזור הזה אם שמתם לב שהפעולה Binning תופסת חלק גדול מזמן העיבוד של שלב הרינדור. כאן תוכלו לקבל מידע על פורמט הקודקוד, מספר הקודקודים ששורטטו ואיך הקודקודים מסודרים בזיכרון. מידע נוסף בנושא זמין במאמר ניתוח פורמטים של קודקודים.
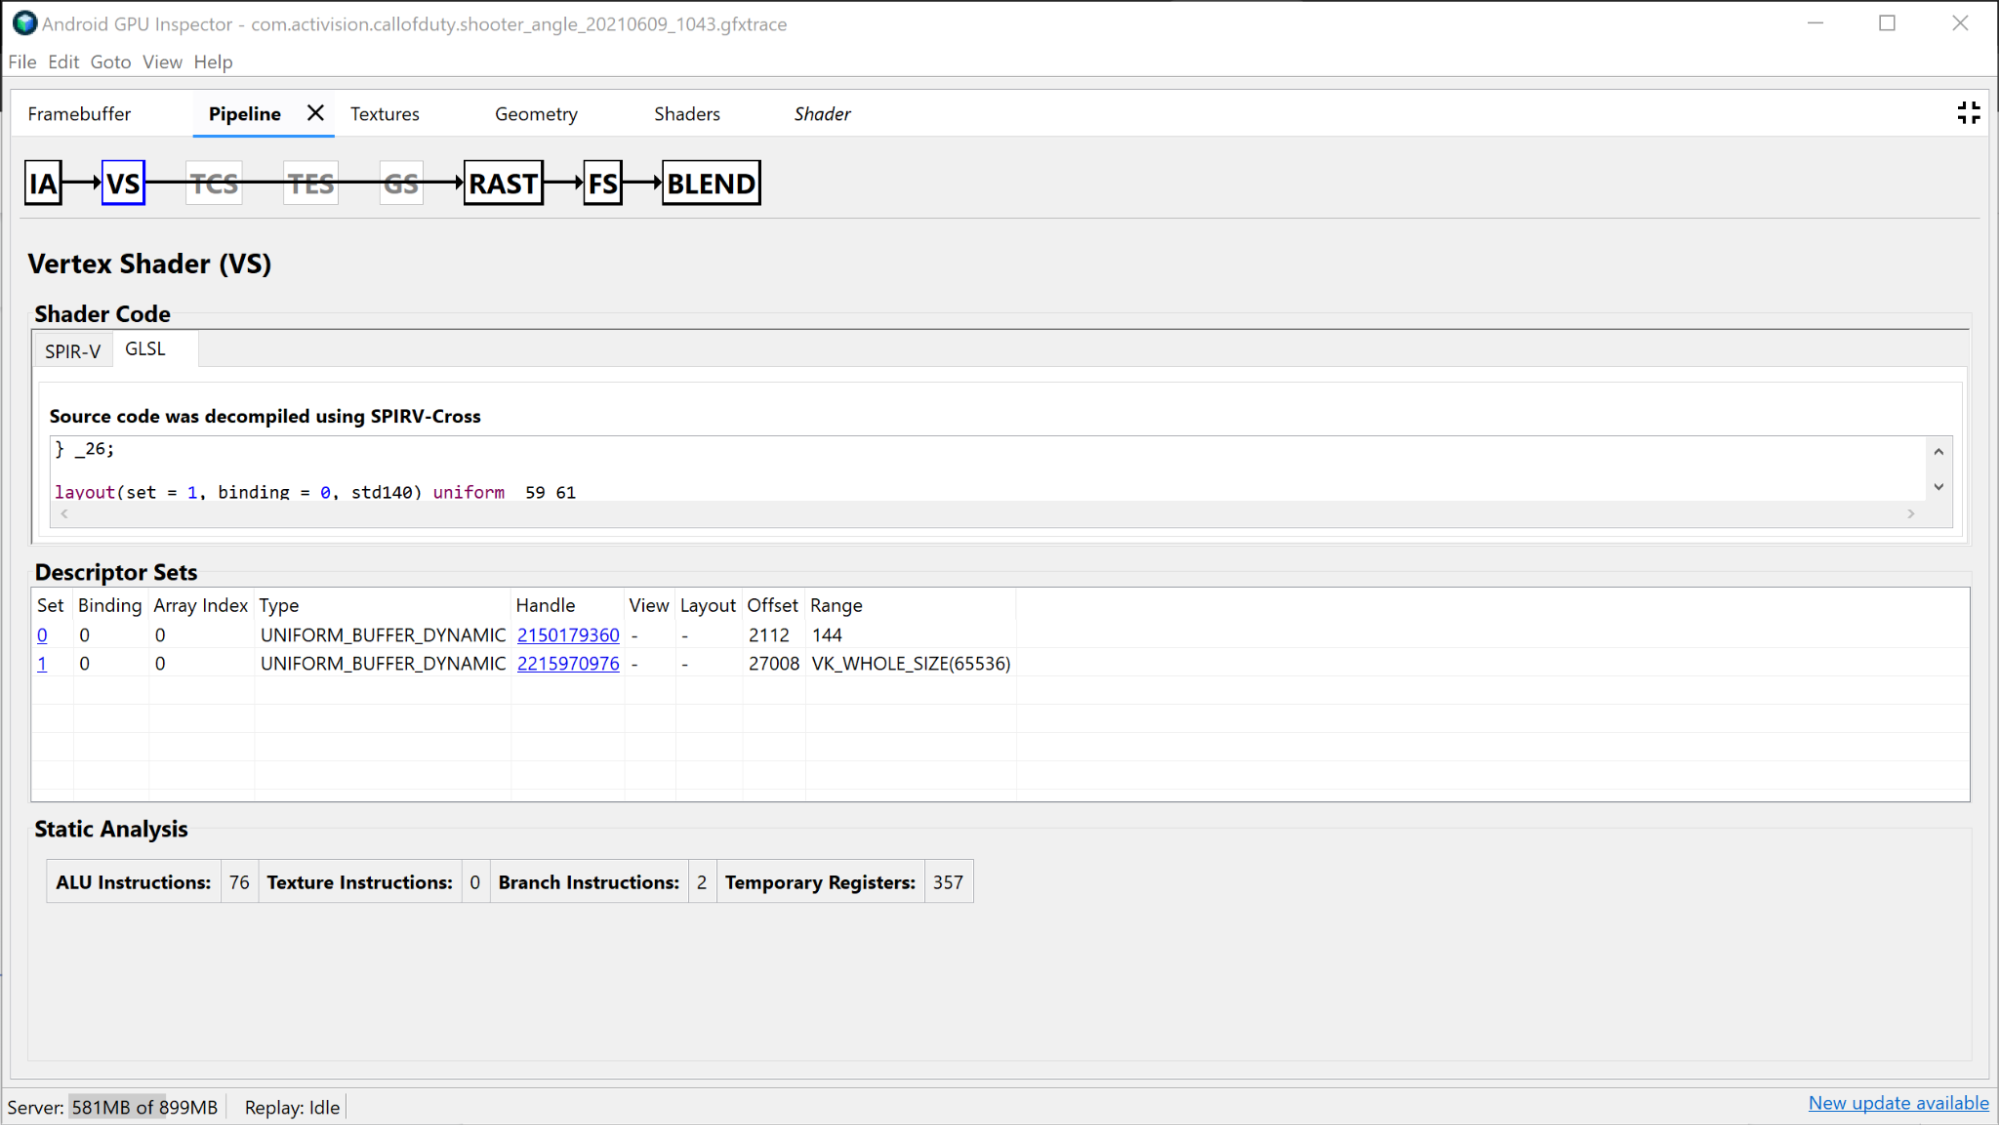
בקטע Vertex Shader מופיע מידע על Vertex Shader שבו השתמשתם במהלך הציור הזה. זה גם מקום טוב לבדוק אם זיהיתם בעיה ב-binning. תוכלו לראות את ה-SPIR-V ואת ה-GLSL שבוצע לו decompilation של ה-shader שבו נעשה שימוש, ולבדוק את מאגרי הנתונים האחידים שמוגבלים לקריאה בלבד עבור הקריאה הזו. לפרטים נוספים, אפשר לעיין במאמר בנושא ניתוח הביצועים של Shader.
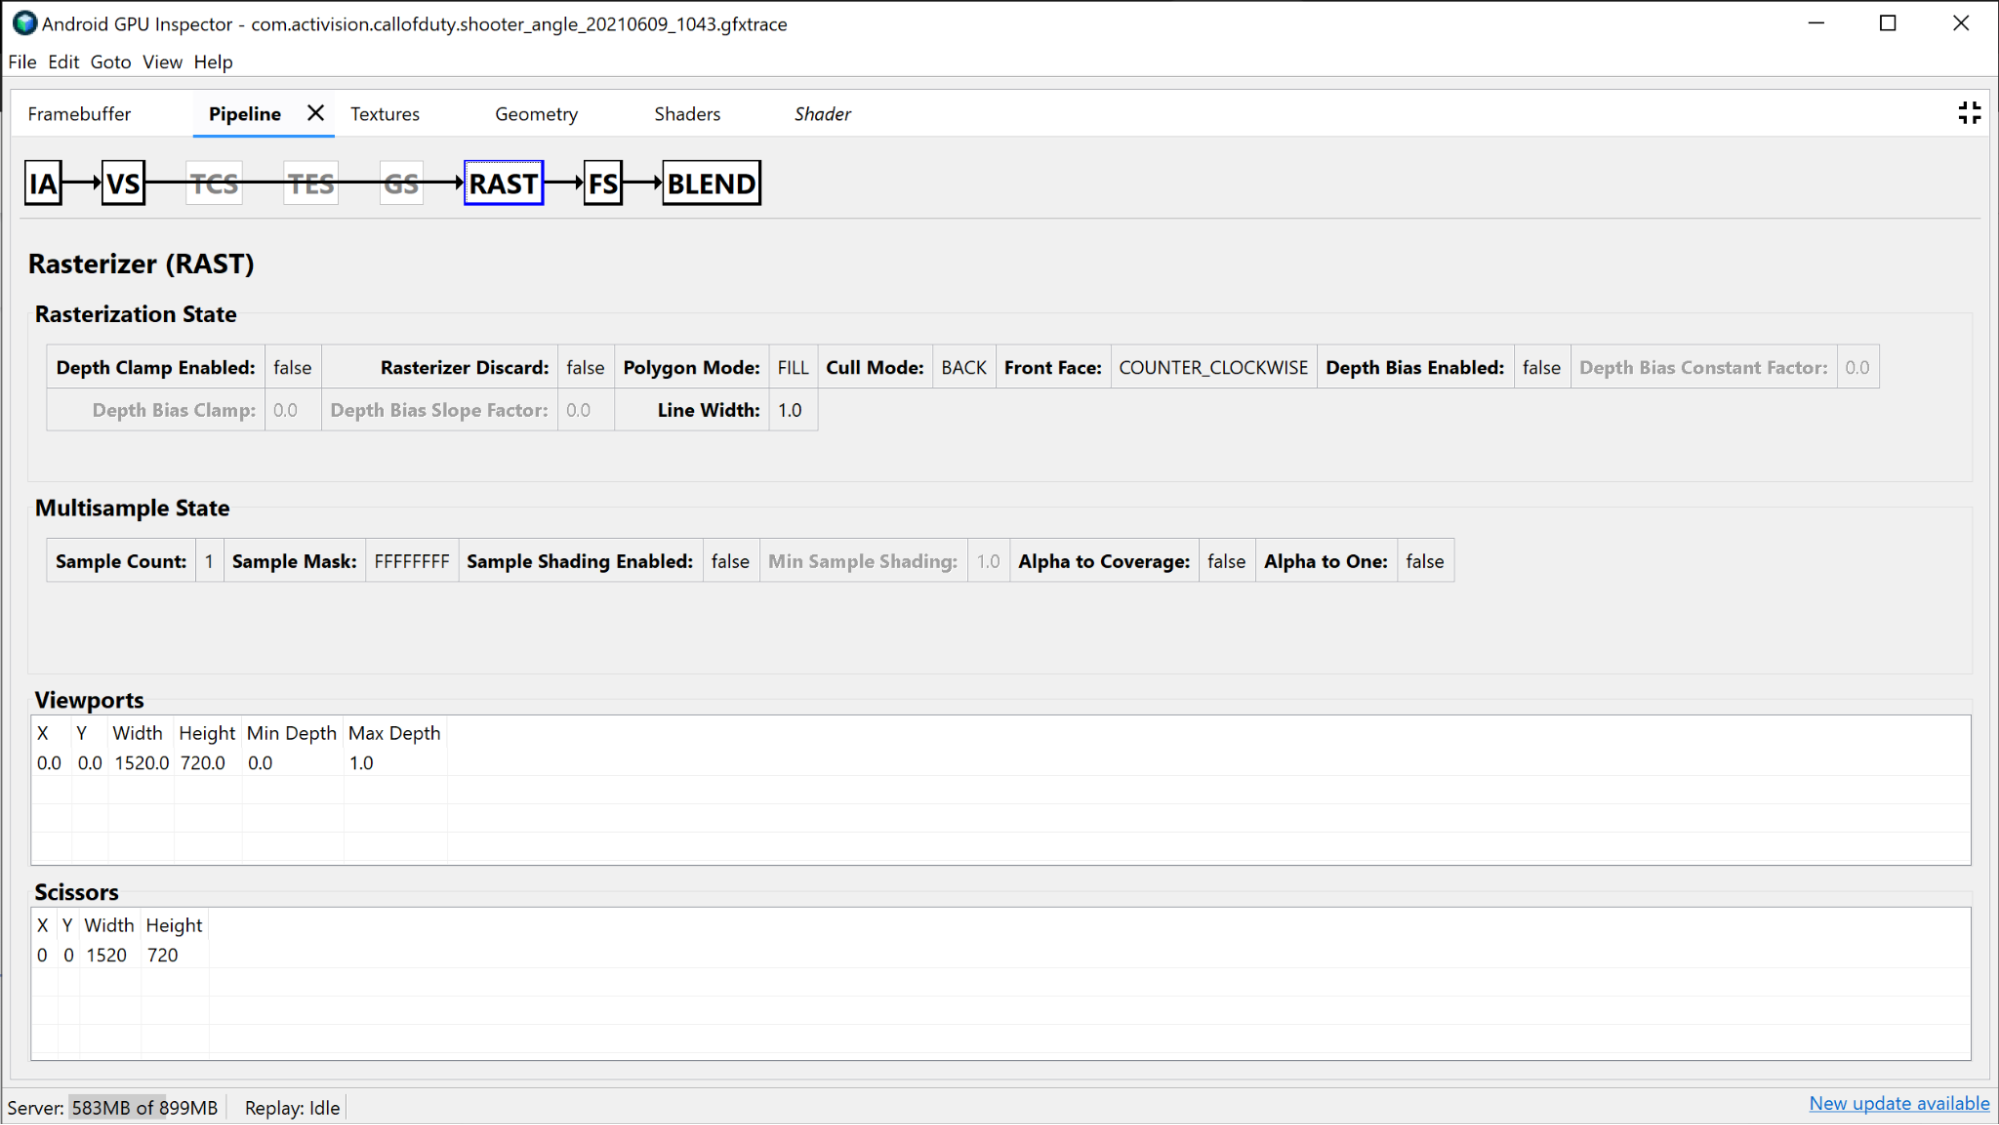
בקטע Rasterizer מוצג מידע על ההגדרה של צינור העיבוד עם פונקציות קבועות יותר, ואפשר להשתמש בו בעיקר למטרות ניפוי באגים של מצב פונקציה קבועה, כמו אזור התצוגה, מספריים, מצב עומק ומצב מצולע.
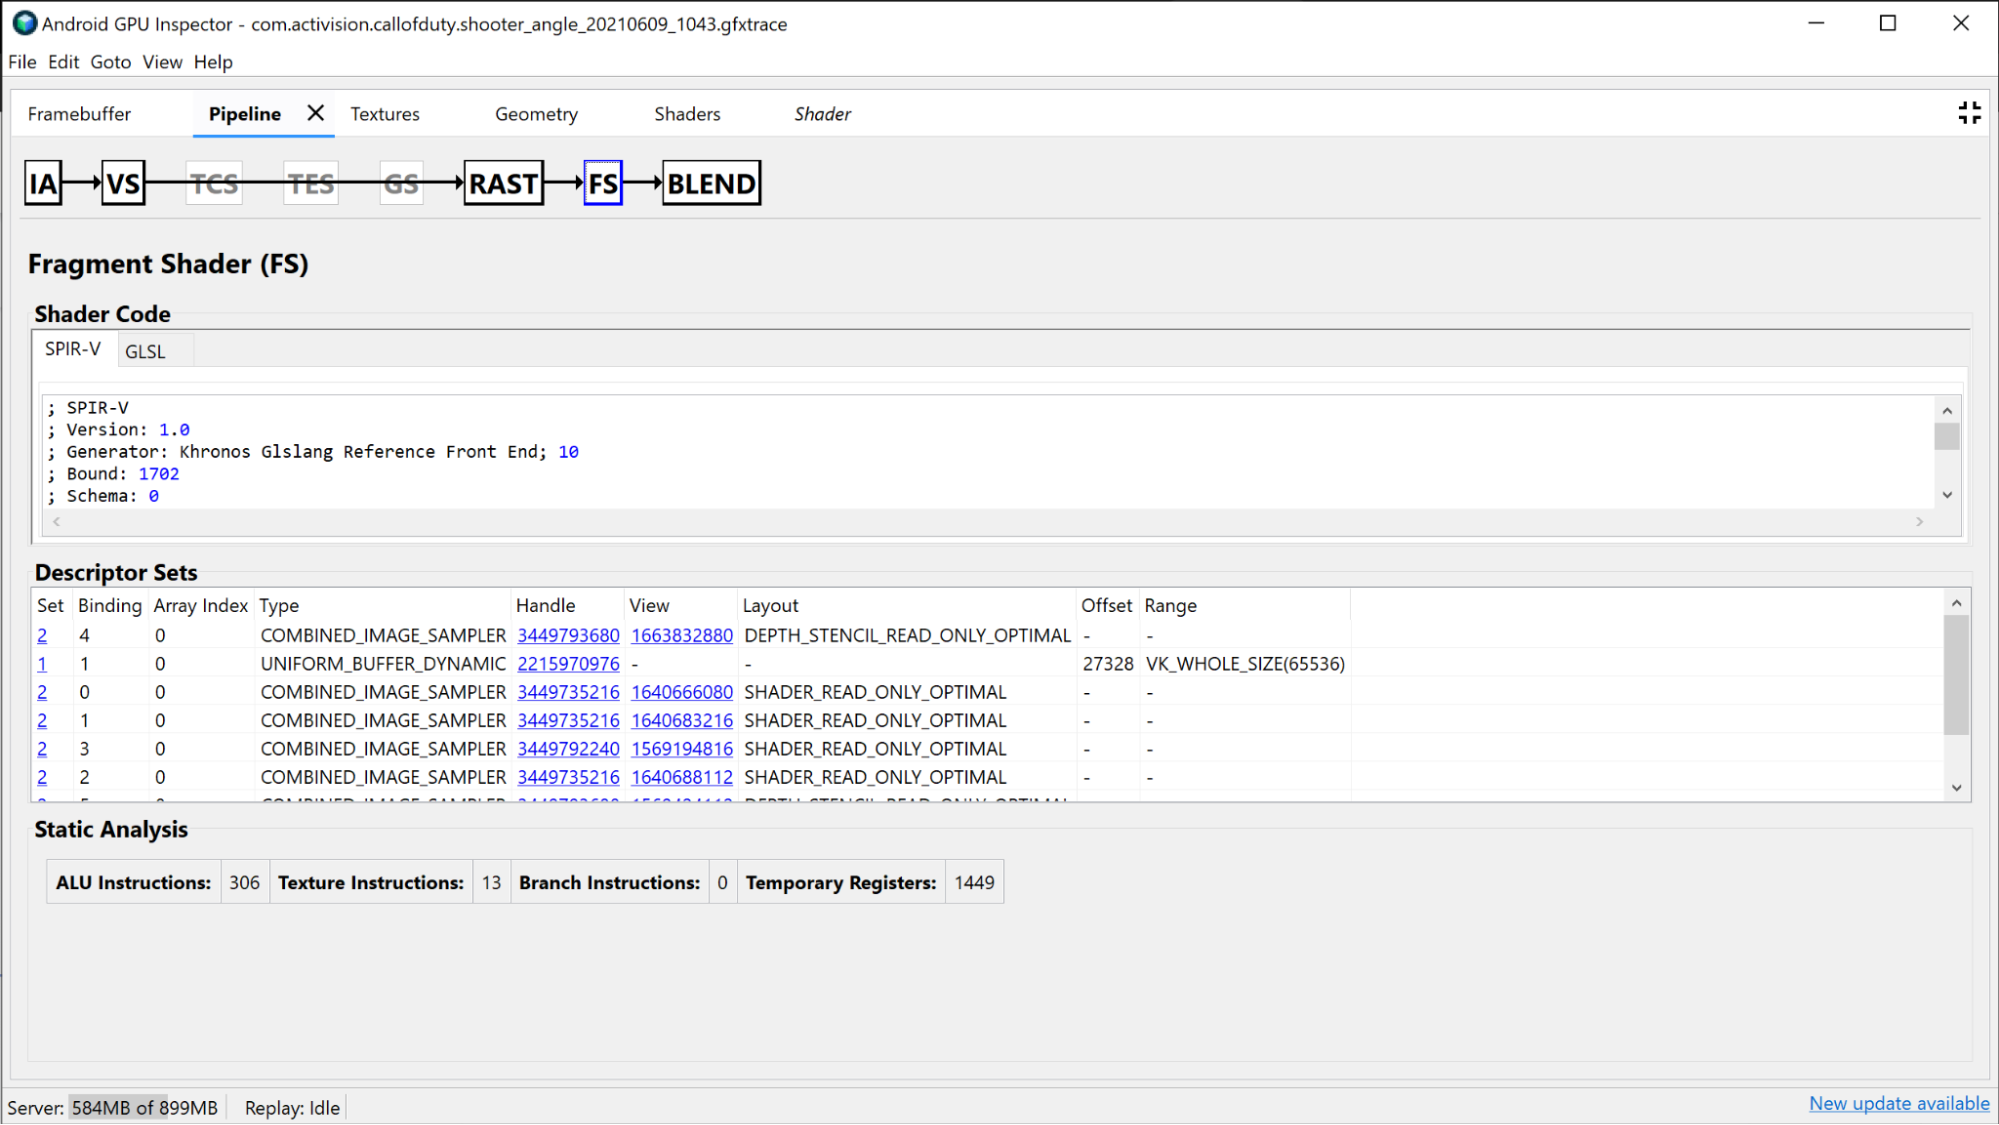
בקטע Fragment Shader מופיע הרבה מהמידע שמופיע בקטע Vertex Shader, אבל הוא ספציפי ל-Fragment Shader. במקרה כזה, אפשר לראות אילו טקסטורות מקושרות ולחקור אותן בלחיצה על נקודת האחיזה.
חקירה קטנה יותר של שלב העיבוד
קריטריון נוסף שבו אפשר להשתמש כדי לשפר את הביצועים של ה-GPU הוא בדיקה של קבוצות של מעברי רינדור קטנים יותר. באופן כללי, כדאי לצמצם ככל האפשר את מספר המעברים של העיבוד, כי לוקח זמן ליחידת ה-GPU לעדכן את המצב ממעבר עיבוד אחד למשנהו. בדרך כלל משתמשים במעברי רינדור קטנים יותר כדי לבצע פעולות כמו יצירת מפות צללים, החלת טשטוש גאוסיאני, הערכת בהירות, ביצוע אפקטים של פוסט-פרוססינג או רינדור של ממשק המשתמש. אפשר לאחד חלק מהפעולות האלה למעבר רינדור יחיד, או אפילו לבטל אותן לגמרי אם הן לא משפיעות על התמונה הכוללת במידה שמצדיקה את העלות.