
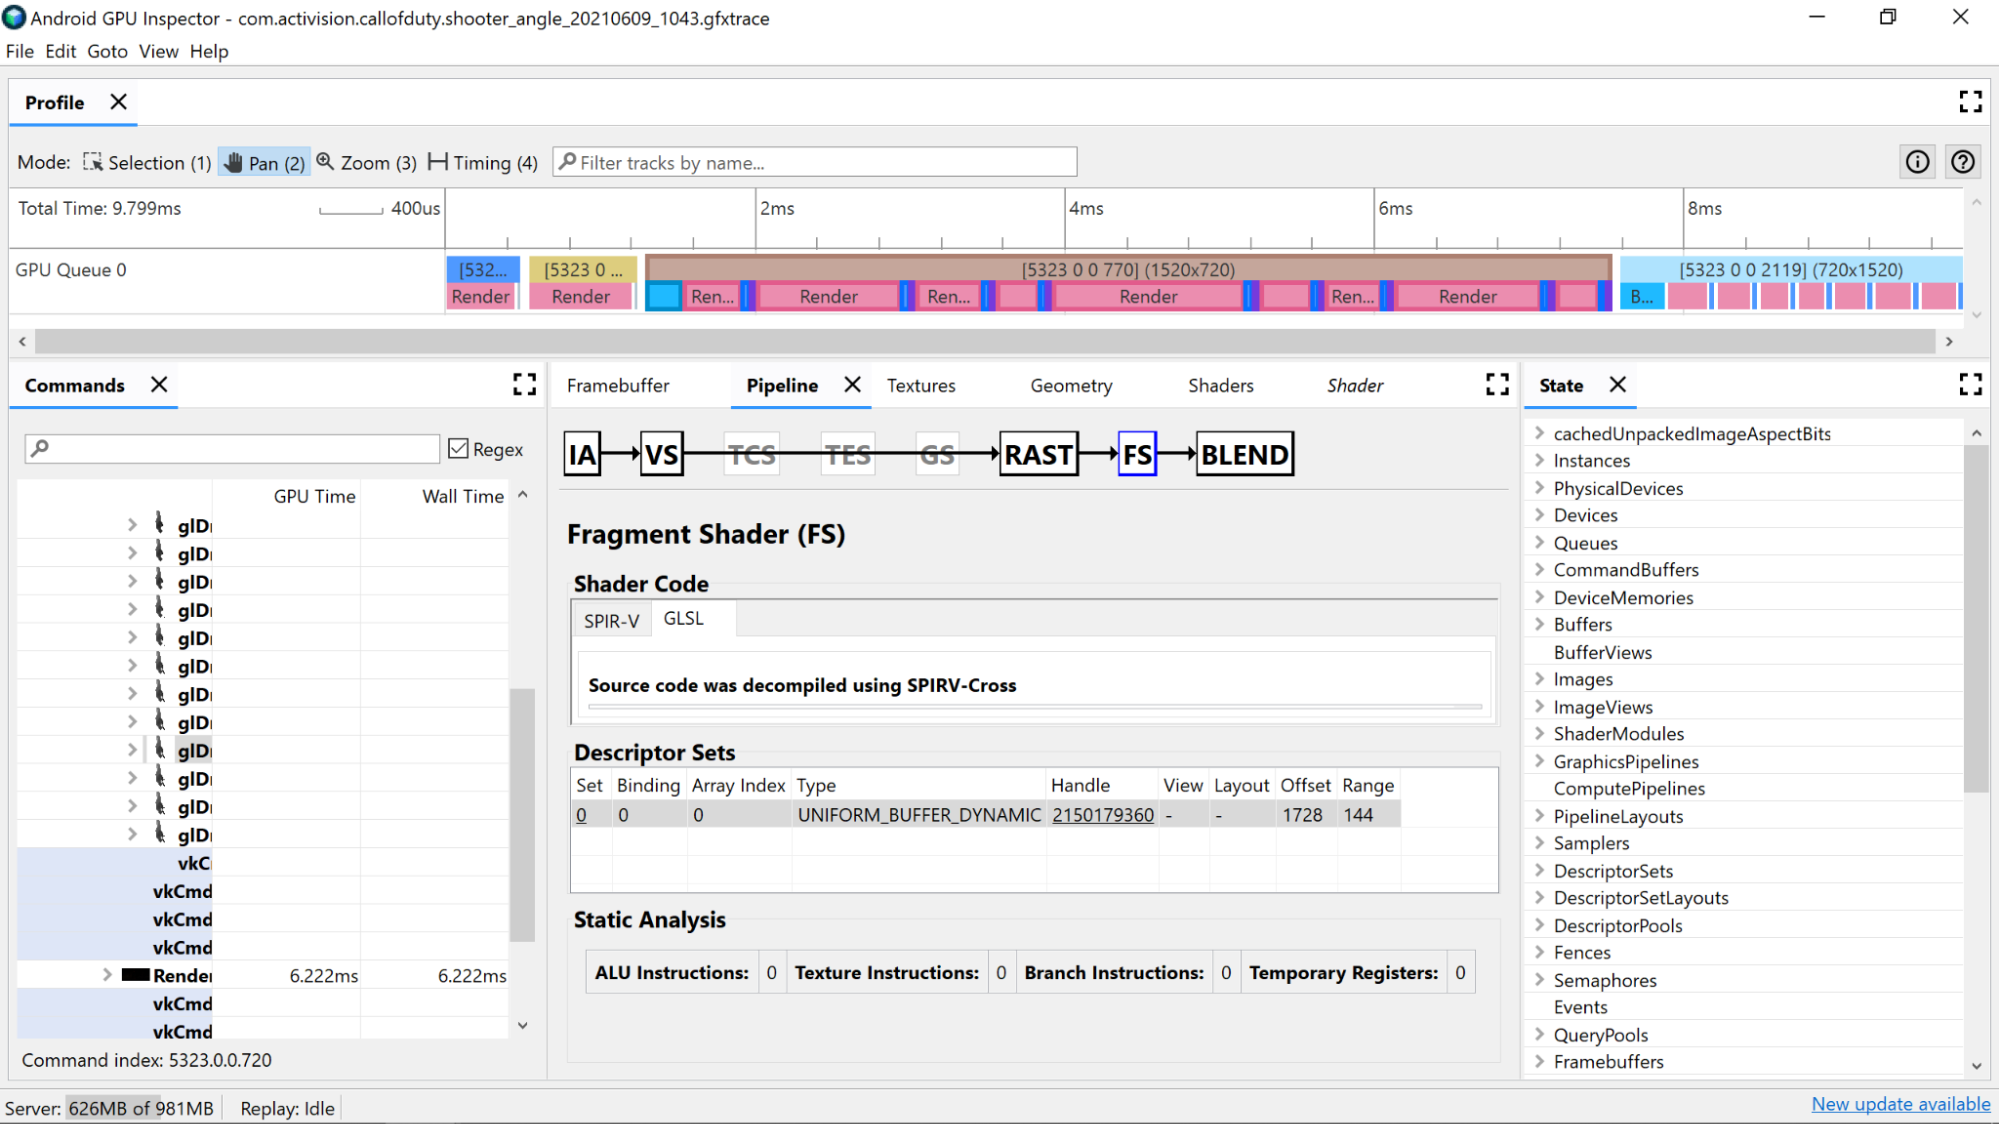
AGI Frame Profiler allows you to investigate your shaders by selecting a draw call from one of our render passes, and going through either the Vertex Shader section or Fragment Shader section of the Pipeline pane.
Here you’ll find useful statistics coming from static analysis of the shader code, as well as the Standard Portable Intermediate Representation (SPIR-V) assembly that our GLSL has been compiled down to. There's also a tab for viewing a representation of the original GLSL (with compiler generated names for variables, functions, and more) that was decompiled with SPIR-V Cross, to provide additional context for the SPIR-V.
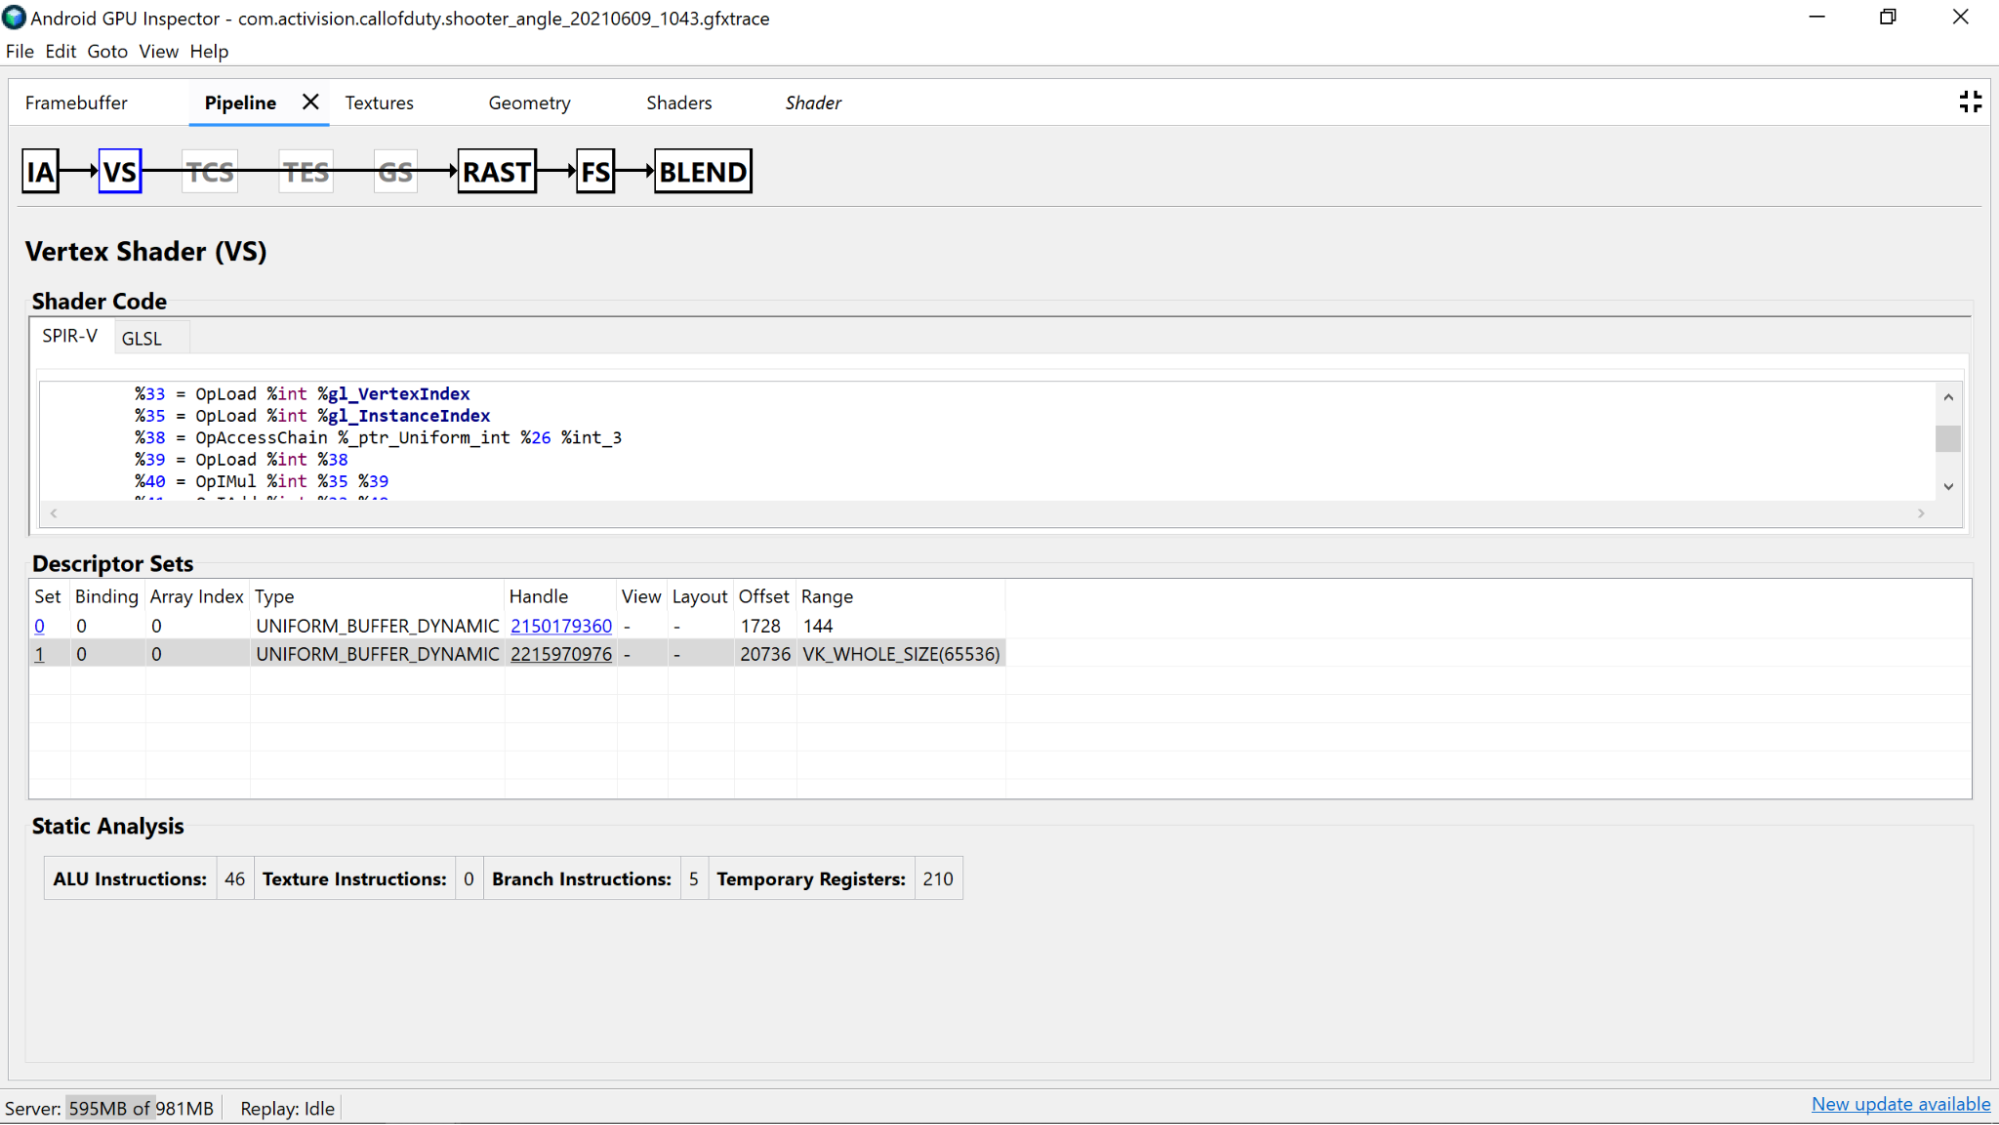
Static analysis
Use static analysis counters to view low-level operations in the shader.
ALU Instructions: This count shows the number of ALU operations (adds, multiplies, divisions, and more) are being executed within the shader, and is a good proxy for how complex the shader is. Try to minimize this value.
Refactoring common computations or simplify computations done in the shader can help reduce the number of instructions needed.
Texture Instructions: This count shows the number of times texture sampling occurs in the shader.
- Texture sampling can be expensive depending on the type of textures being sampled from, so cross-referencing the shader code with the bound textures found in the Descriptor Sets section can provide more information on the types of textures being used.
- Avoid random access when sampling textures, because this behavior is not ideal for texture-caching.
Branch Instructions: This count shows the number of branch operations in the shader. Minimizing branching is ideal on parallelized processors such as the GPU, and can even help the compiler find additional optimizations:
- Use functions such as
min,max, andclampto avoid needing to branch on numeric values. - Test the cost of computation over branching. Because both paths of a branch are executed in many architectures, there are many scenarios where always doing the computation is faster than skipping over the computation with a branch.
- Use functions such as
Temporary Registers: These are fast, on-core registers that are used to hold the results of intermediate operations required by computations on the GPU. There is a limit to the number of registers available for computations before the GPU has to spill over into using other off-core memory to store intermediate values, reducing overall performance. (This limit varies depending on the GPU model.)
The number of temporary registers used may be higher than expected if the shader compiler performs operations such as unrolling loops, so it’s good to cross-reference this value with the SPIR-V or decompiled GLSL to see what the code is doing.
Shader code analysis
Investigate the decompiled shader code itself to determine if there any potential improvements are possible.
- Precision: The precision of shader variables can impact the GPU
performance of your application.
- Try using the
mediumpprecision modifier on variables wherever possible, since medium precision (mediump) 16-bit variables are usually faster and more power efficient than full precision (highp) 32-bit variables. - If you don't see any precision qualifiers in the shader on variable
declarations, or at the top of the shader with a
precision precision-qualifier type, it defaults to full precision (highp). Make sure to look at variable declarations as well. - Using
mediumpfor vertex shader output is also preferred for the same reasons described above, and also has the benefit of reducing memory bandwidth and potentially temporary register usage needed to do interpolation.
- Try using the
- Uniform Buffers: Try to keep the size of Uniform Buffers as small as possible (while maintaining alignment rules). This helps make computations more compatible with caching and potentially allow for uniform data to be promoted to faster on-core registers.
Remove unused Vertex Shader Outputs: If you find vertex shader outputs being unused in the fragment shader, remove them from the shader to free up memory bandwidth and temporary registers.
Move computation from Fragment Shader to Vertex Shader: If the fragment shader code performs computations that are independent of state specific to the fragment being shaded (or can be interpolated properly), moving it to the vertex shader is ideal. The reason for this is that in most apps, the vertex shader is run much less frequently compared to the fragment shader.