ネイティブ割り当てを記録する
コレクションでコンテンツを整理
必要に応じて、コンテンツの保存と分類を行います。
ネイティブ コードを記述していて、メモリ使用量が気になる場合は、アプリのネイティブ割り当てをプロファイリングして、最適化の余地があるかどうかを確認することをおすすめします。
アプリのメモリをプロファイリングする理由
Android は管理メモリ環境を備えています。アプリが一部のオブジェクトを使用していないことが検出されると、ガベージ コレクターは未使用のメモリをリリースしてヒープに戻します。Android が未使用のメモリを検出する仕組みは継続的に改善されていますが、すべての Android バージョンにおいて、ある時点でコードの実行を短時間一時停止する必要があります。ほとんどの場合、そういった一時停止は検出できません。システムがメモリを収集できる以上の速度でアプリがメモリを割り当てると、コレクターが十分なメモリを解放して割り当てを満たしていても、アプリで遅延が発生する場合があります。この遅延により、アプリがフレームをスキップしたり、明らかに速度が低下したりする場合があります。
アプリのメモリ使用量を削減できるプログラミング方法については、アプリのメモリを管理するをご覧ください。
ネイティブ アロケーションの概要
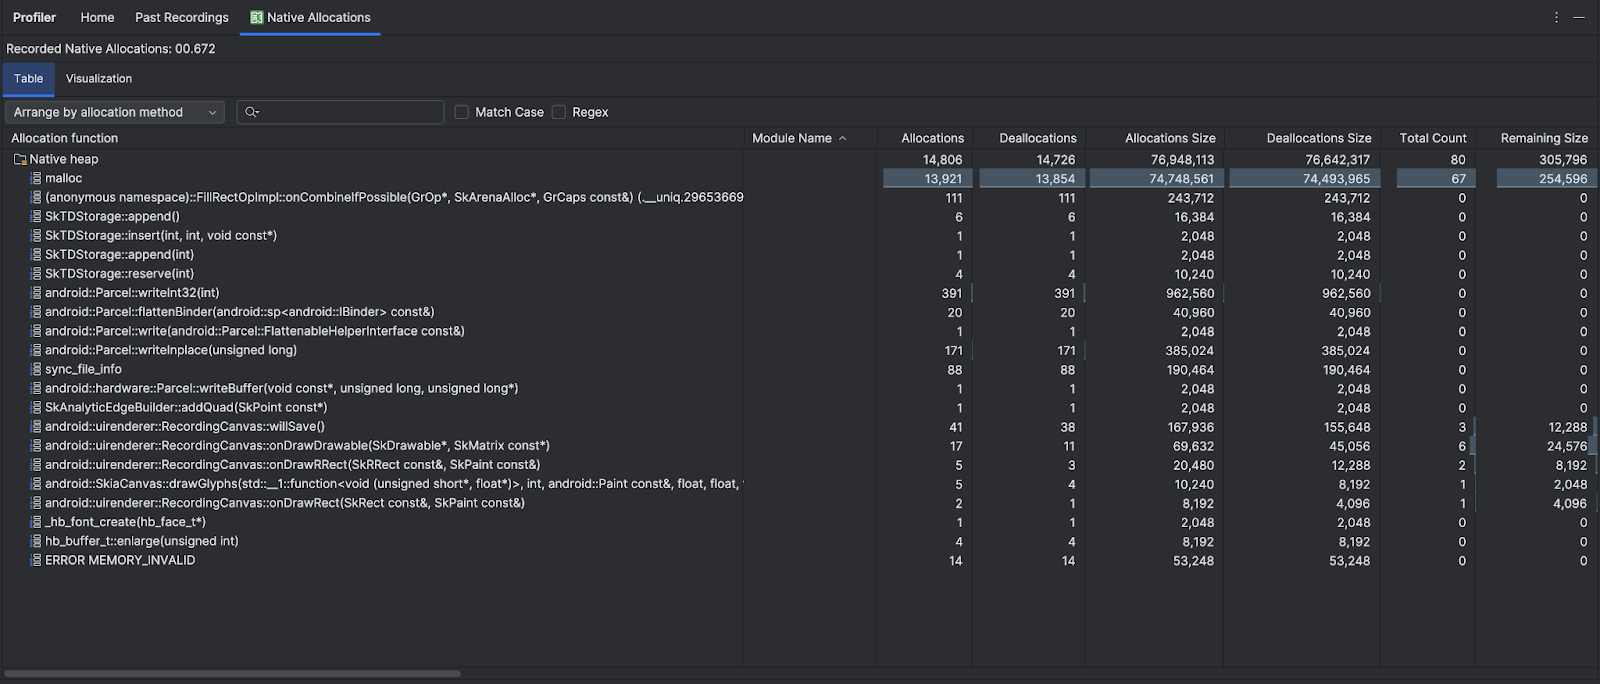
[メモリ使用量をトラッキング(ネイティブ割り当て)] タスクを実行すると、Android Studio Profiler は、指定した期間のネイティブ コード内のオブジェクトの割り当てと割り当て解除を追跡し、次の情報を提供します。
- Allocations: 選択した期間中に
malloc()
または new
演算子を使用して割り当てられたオブジェクトの数。
- Deallocations: 選択した期間中に
free()
または delete
演算子を使用して割り当て解除されたオブジェクトの数。
- Allocations Size: 選択した期間中のすべての割り当ての合計サイズ(バイト単位)。
- Deallocations Size: 選択した期間中のすべての解放されたメモリの合計サイズ(バイト単位)。
- 合計数: [Allocations] 列の値から [Deallocations] 列の値を引いた値。
- Remaining Size: [Allocations Size] 列の値から [Deallocations Size] 列の値を引いた値。

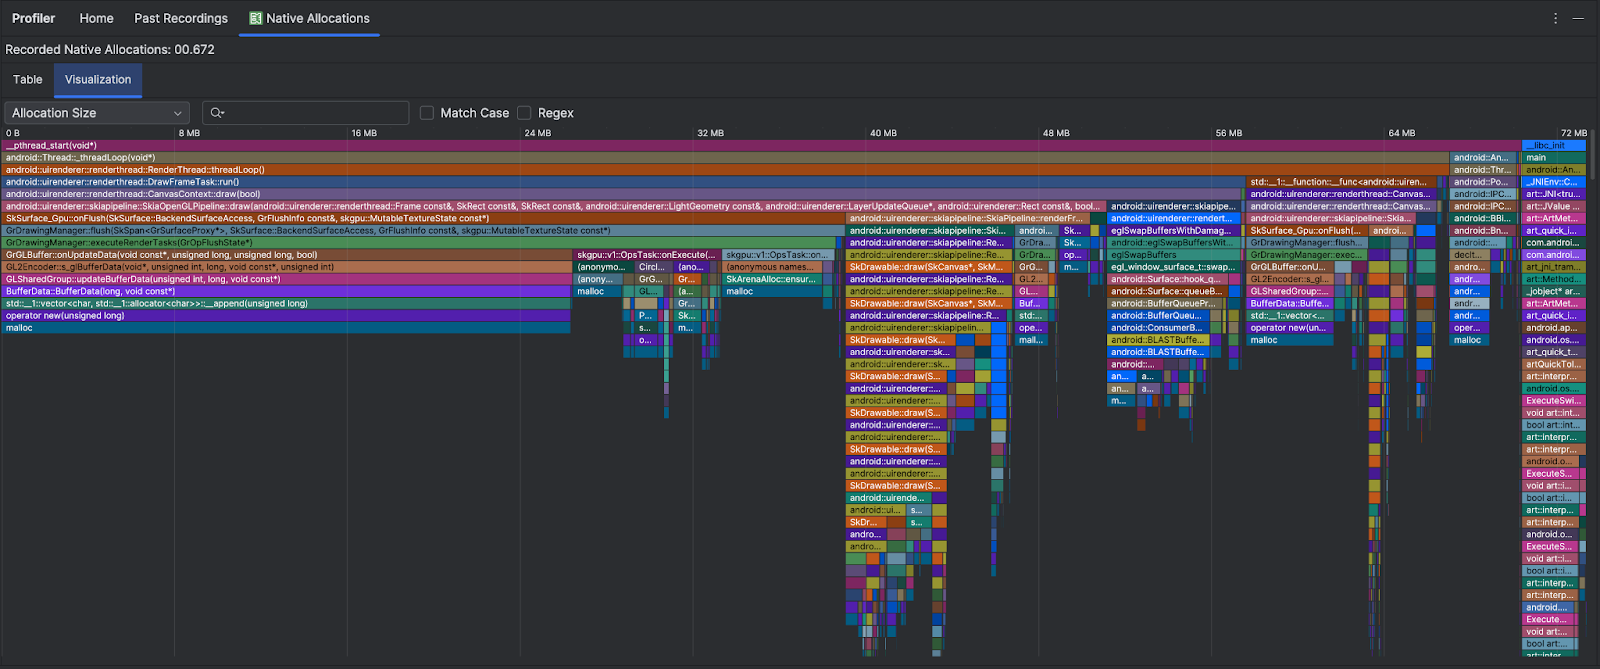
[ビジュアリゼーション] タブには、選択した期間の呼び出しスタック内のネイティブ コードに関連するすべてのオブジェクトの集計ビューが表示されます。基本的に、表示されているインスタンスを含むコールスタックが占有するメモリの合計量を示します。最初の行にはスレッド名が表示されています。デフォルトでは、オブジェクトは割り当てサイズに基づいて左から右に積み重ねられます。ドロップダウンを使用して順序を変更できます。

デフォルトでは、プロファイラは 2, 048 バイトのサンプルサイズを使用します。2, 048 バイトのメモリが割り当てられるたびに、メモリのスナップショットが作成されます。サンプルサイズが小さいほどスナップショットの頻度は高くなり、メモリ使用量に関してより正確なデータが得られます。サンプルサイズが大きいほどデータの精度は低くなりますが、システム リソースの消費量を削減し、記録時のパフォーマンスが改善されます。サンプルサイズを変更するには、録音構成を編集するをご覧ください。
このページのコンテンツやコードサンプルは、コンテンツ ライセンスに記載のライセンスに従います。Java および OpenJDK は Oracle および関連会社の商標または登録商標です。
最終更新日 2025-07-27 UTC。
[[["わかりやすい","easyToUnderstand","thumb-up"],["問題の解決に役立った","solvedMyProblem","thumb-up"],["その他","otherUp","thumb-up"]],[["必要な情報がない","missingTheInformationINeed","thumb-down"],["複雑すぎる / 手順が多すぎる","tooComplicatedTooManySteps","thumb-down"],["最新ではない","outOfDate","thumb-down"],["翻訳に関する問題","translationIssue","thumb-down"],["サンプル / コードに問題がある","samplesCodeIssue","thumb-down"],["その他","otherDown","thumb-down"]],["最終更新日 2025-07-27 UTC。"],[],[],null,["# Record native allocations\n\nIf you're writing native code and concerned about its memory usage, it's helpful\nto profile your app's native allocations to discover if there's opportunity to\noptimize.\n\nWhy you should profile your app memory\n--------------------------------------\n\nAndroid provides a [managed memory\nenvironment](/topic/performance/memory-overview)---when Android determines that\nyour app is no longer using some objects, the garbage collector releases the\nunused memory back to the heap. How Android goes about finding unused memory is\nconstantly being improved, but at some point on all Android versions, the system\nmust briefly pause your code. Most of the time, the pauses are imperceivable.\nHowever, if your app allocates memory faster than the system can collect it,\nyour app might be delayed while the collector frees enough memory to satisfy\nyour allocations. The delay could cause your app to skip frames and cause\nvisible slowness.\n\nFor information about programming practices that can reduce your app's memory\nuse, read [Manage your app's memory](/topic/performance/memory).\n\nNative allocations overview\n---------------------------\n\nWhen you run the [**Track Memory Consumption (Native Allocations)**](/studio/profile#start-profiling) task,\nthe Android Studio Profiler tracks allocations and deallocations of objects in\nnative code for the time period that you specify and provides the following\ninformation:\n\n- **Allocations** : A count of objects allocated using `malloc()` or the `new` operator during the selected time period.\n- **Deallocations** : A count of objects deallocated using `free()` or the `delete` operator during the selected time period.\n- **Allocations Size**: The aggregated size in bytes of all allocations during the selected time period.\n- **Deallocations Size**: The aggregated size in bytes of all freed memory during the selected time period.\n- **Total Count** : The value in the **Allocations** column minus the value in the **Deallocations** column.\n- **Remaining Size** : The value in the **Allocations Size** column minus the value in the **Deallocations Size** column.\n\nThe **Visualization** tab shows an aggregated view of all the objects related to\nnative code in the call stack during the time range selected. It essentially\nshows you how much total memory the callstack with the instances shown takes.\nThe first row shows the thread name. By default, the objects are stacked left to\nright based on allocation size; use the drop-down to change the ordering.\n\nBy default, the profiler uses a sample size of 2048 bytes: Every time 2048 bytes\nof memory are allocated, a snapshot of memory is taken. A smaller sample size\nresults in more frequent snapshots, yielding more accurate data about memory\nusage. A larger sample size yields less accurate data, but it consumes fewer\nsystem resources and improves performance while recording. To change the sample\nsize, see [Edit the recording configuration](/studio/profile#edit-recording)."]]