
You can see and act on app crash data from Firebase Crashlytics and Android Vitals directly in Android Studio. This integration pulls stack trace data and crash statistics from Crashlytics and Google Play into the App Quality Insights tool window in the Studio IDE, so you don't have to jump back and forth between your browser and the IDE. Development teams can benefit from key capabilities including the following:
- See lines in your code highlighted when they have related Crashlytics event data.
- See the stack trace for top crashes and click on the stack trace to jump to the relevant lines in your code.
- See summary statistics about top crash and non-fatal events, for example grouped by device manufacturer and Android version.
- Filter events by attributes including severity, time, and app version.
- Get a browser link that opens the Crashlytics dashboard page with more details about the event.
- Get insights that help you more easily understand and resolve root causes of certain issues.
Android Vitals reports are available to all apps published to Google Play. If you're not using Crashlytics yet and would like to learn more about its offerings, see Firebase Crashlytics.
Get started
To see Crashlytics data in Android Studio, you need to set up Firebase and Crashlytics in your app project. Here's how: open the Firebase Assistant in Android Studio by going to Tools > Firebase, click Crashlytics, and then follow the tutorial to add Firebase and Crashlytics to your project. You can read more about the Firebase Assistant workflow in Firebase's getting started guide for Android.
If you've already added Firebase and Crashlytics to your app, sign in to your
Developer account in the IDE by clicking on the avatar icon
![]() .
After you sign in, click the App Quality Insights tool window
.
After you sign in, click the App Quality Insights tool window
![]() . You should
see the panels populate with reports from Crashlytics.
. You should
see the panels populate with reports from Crashlytics.
Analyze Android vitals
App Quality Insights includes Android vitals data. This lets you more easily access core metrics collected by Google Play and improve your user experience. Use Android vitals to address issues related to app stability to help improve the quality of your app on Google Play.
You can view Android vitals issues, filter them, and jump from stack trace to code all from the App Quality Insights tool window. To get started, follow these steps:
- Sign in to your developer account in Android Studio using the profile icon
 at the end of the toolbar.
 - Open App Quality Insights by clicking the tool window in Android Studio or clicking View > Tool Windows > App Quality Insights.
- Click the Android vitals tab within App Quality Insights.
Optional: To use version control integration for a debuggable build, add the latest Firebase Crashlytics SDK (or Firebase Android Bill of Materials) to your app. Then add the following code to the module-level
build.gradle.ktsorbuild.gradlefile. Release (non-debuggable) builds have the flag enabled by default.
Kotlin
android {
  buildTypes {
    getByName("debug") {
      vcsInfo {
        include = true
      }
    }
  }
}
Groovy
android {
  buildTypes {
    debug {
      vcsInfo {
        include true
      }
    }
  }
}
Analyze Crashlytics data in Android Studio
The App Quality Insights tool window has rich data that gives you insight into the events your users are encountering, and links to help you quickly navigate to the sources of those events.
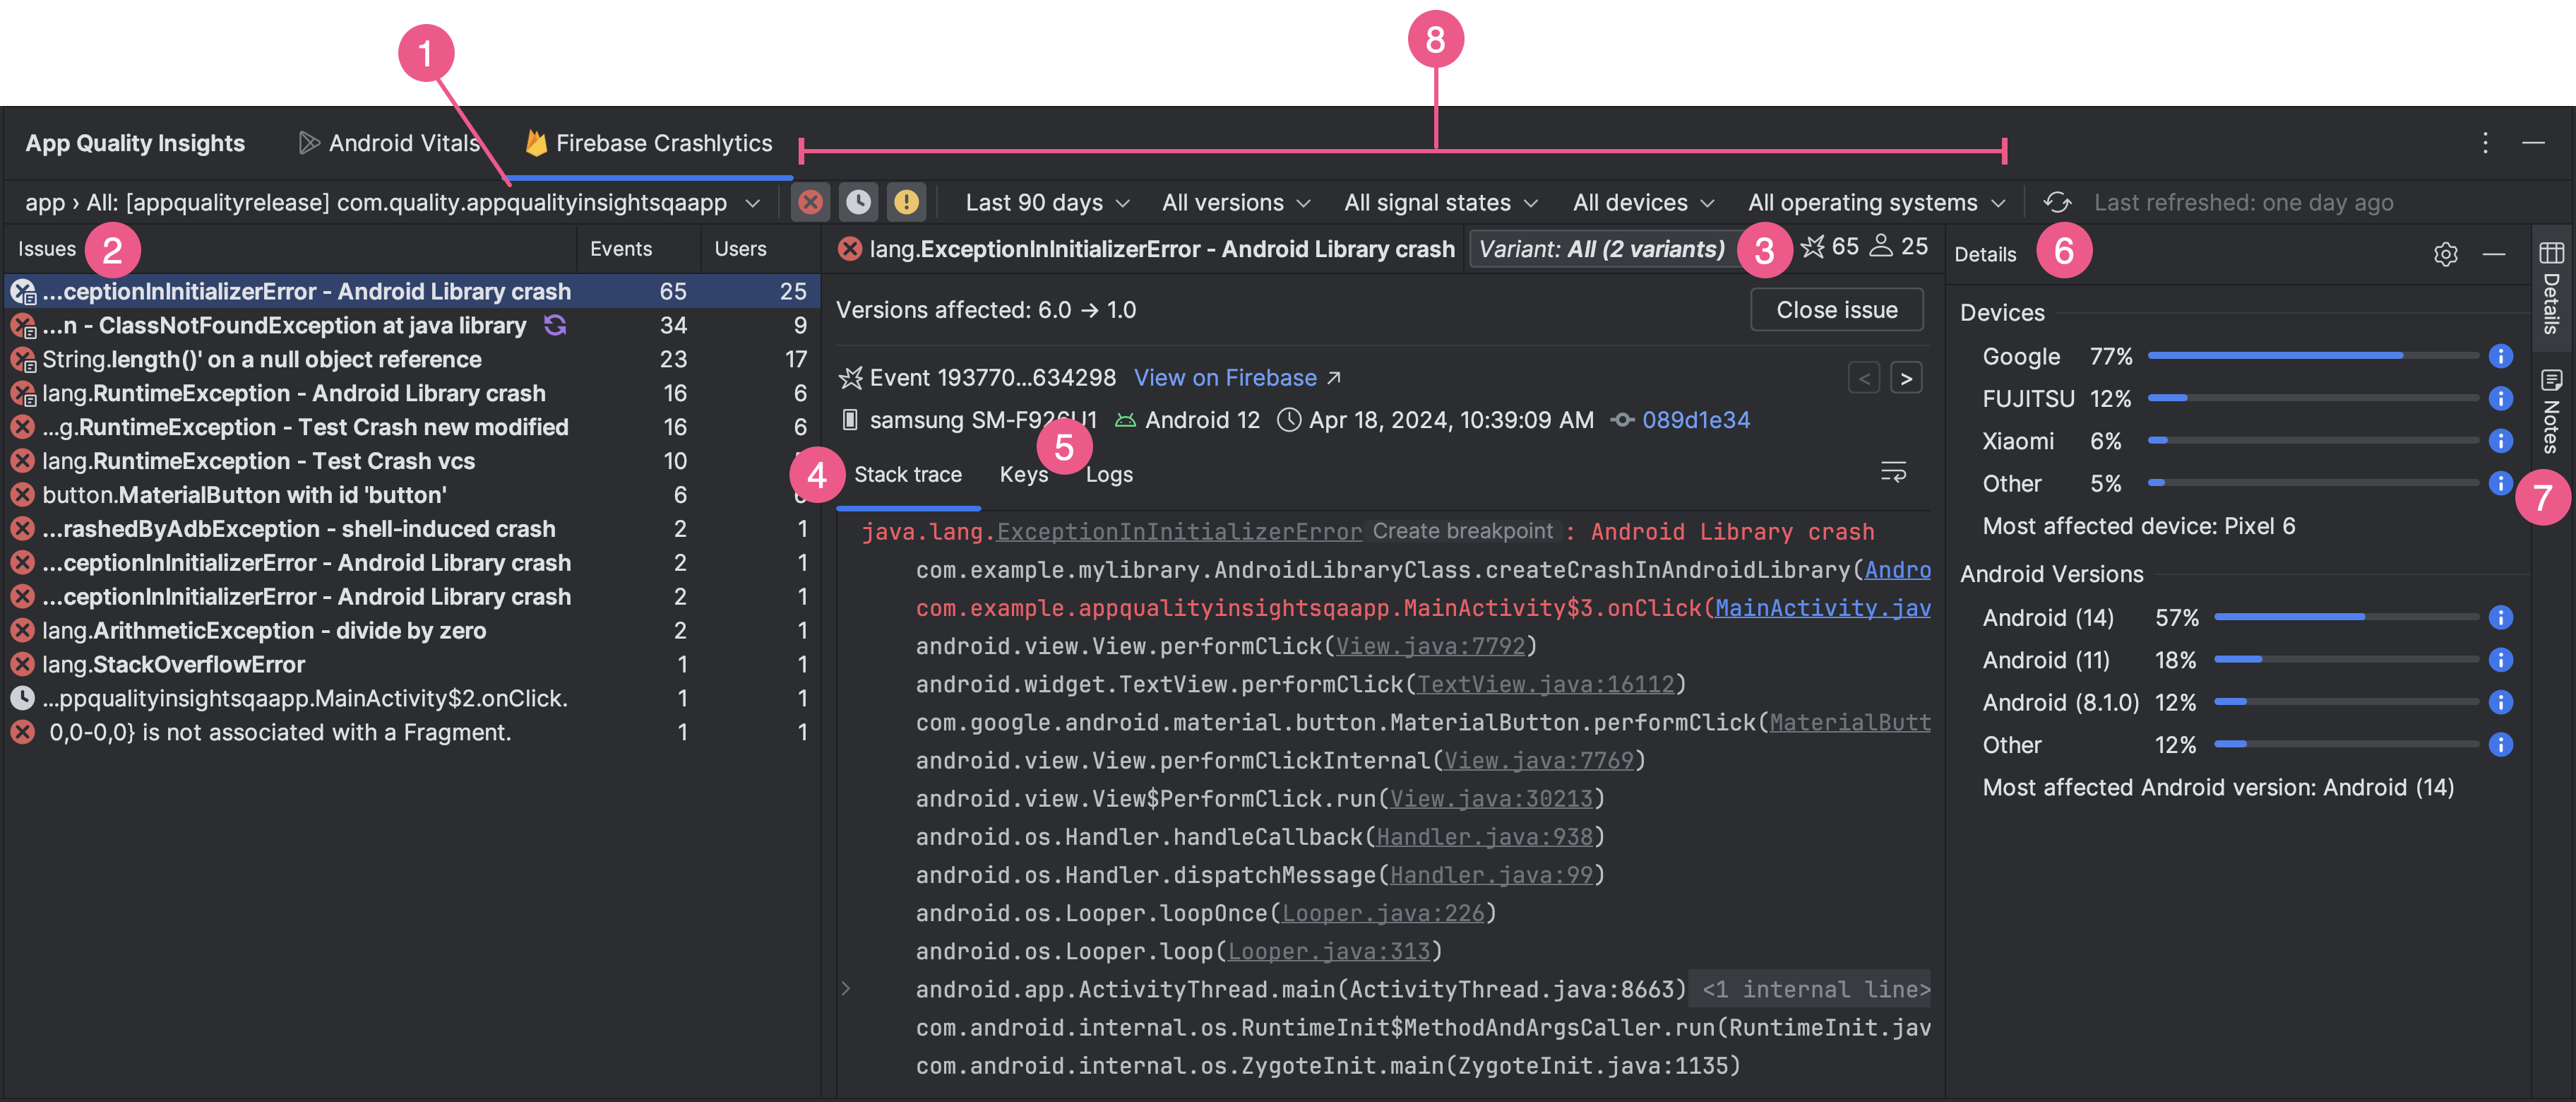
- Use the application ID dropdown menu to select the app ID you want to analyze. For example, while you might work on the debug version of your app in the IDE, you might want to see event data for your production version of your app that your users install.
- The Issues panel shows the top events that Crashlytics has data for, and is sorted by your most impactful crashes.
- View events by variants, or groups of events that have similar stack traces. Analyzing events by variant helps you identify the root causes of a crash.
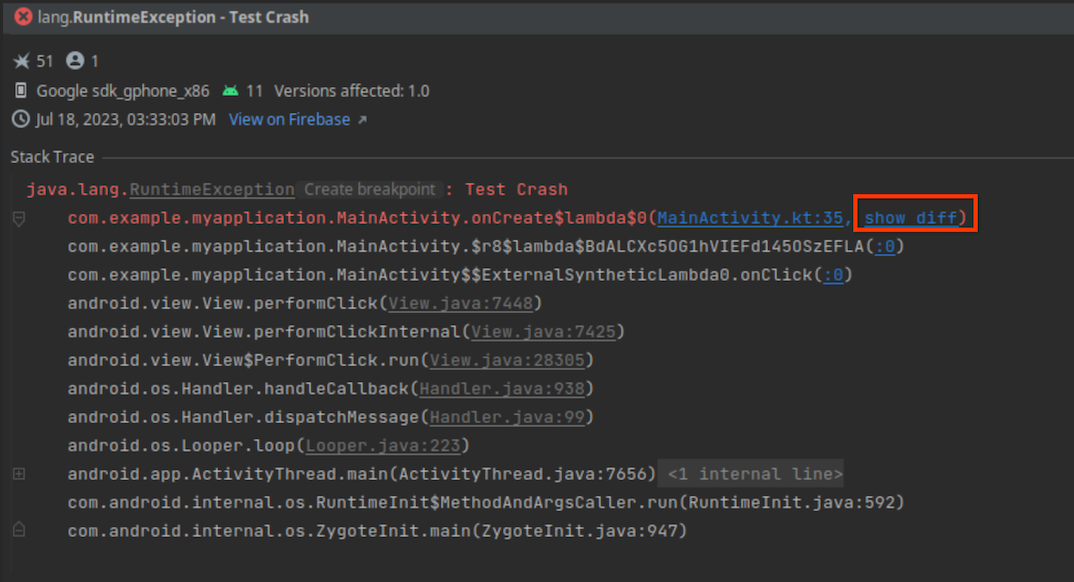
The Stack trace tab shows details about the latest occurrence of the event you click in the Issues panel. You can see the event's stack trace and click the stack trace to jump to the relevant lines in your codebase. If your code has changed since the crash occurred, click show diff next to the error in the stack trace to view a diff between your current code and the version of your codebase that generated the crash.
There is also information about the device type affected, its Android version, and the time the event occurred, as well a link to the event in the Firebase Crashlytics dashboard. To browse info for multiple events in a group, use the left and right arrows. Click Close issue to close an issue directly from the panel.
- The Keys and Logs tabs show custom key-value pairs and logs for each Crashlytics report.
- The Details panel breaks down the crash counts by device type and Android version, so you can determine which user groups are most affected. It also shows which app versions experienced the crash and the number of users affected.
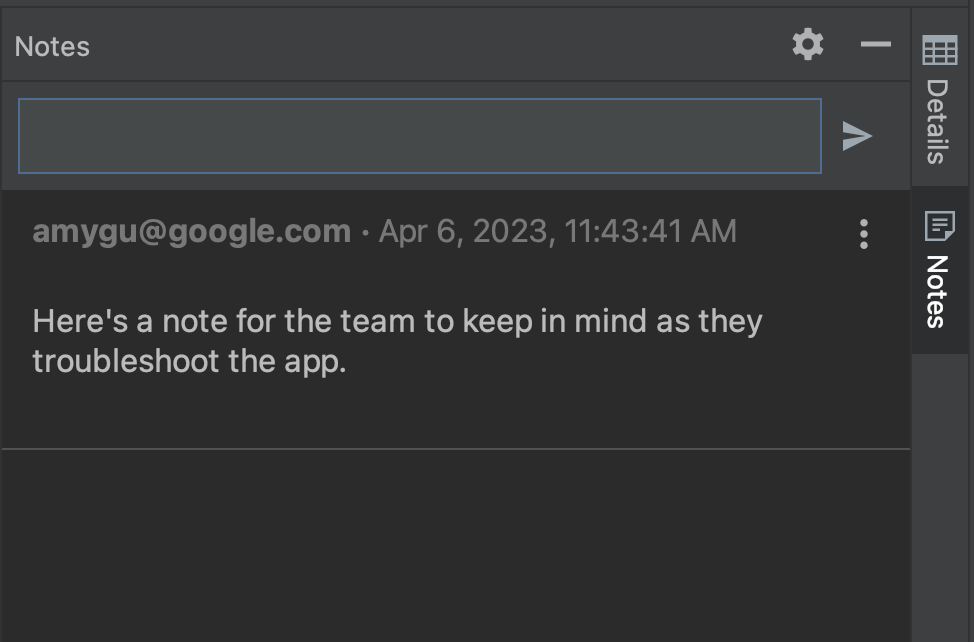
- Read and attach notes to issues so that they are visible in the Firebase
Console and your teammates. To write a note about an issue, select the issue
and open the Notes panel. You must have write permission to the
Crashlytics project in order to write notes. Issues with notes appear with a
"notes" icon
 in the Issues panel.
- Use the variety of filters to hone in on certain subsets of events. You
can select or deselect events that are Fatal
 ,
Non-Fatal
,
Non-Fatal
 ,
and ANRs
,
and ANRs
 ,
as well as filter by time, app version,
Crashlytics Signal,
device make and model, and Android platform version. Note that for the
Crashlytics Signal states, an issue is considered regressed when it's
been closed in the past and has occurred again in a new version of the app.
,
as well as filter by time, app version,
Crashlytics Signal,
device make and model, and Android platform version. Note that for the
Crashlytics Signal states, an issue is considered regressed when it's
been closed in the past and has occurred again in a new version of the app.
In addition to being able to navigate from stack trace to code, you can also
jump from code to stack trace: Android Studio now annotates lines of code that
are related to crashes with a crash gutter icon
![]() so you
can easily spot and debug them.
so you
can easily spot and debug them.
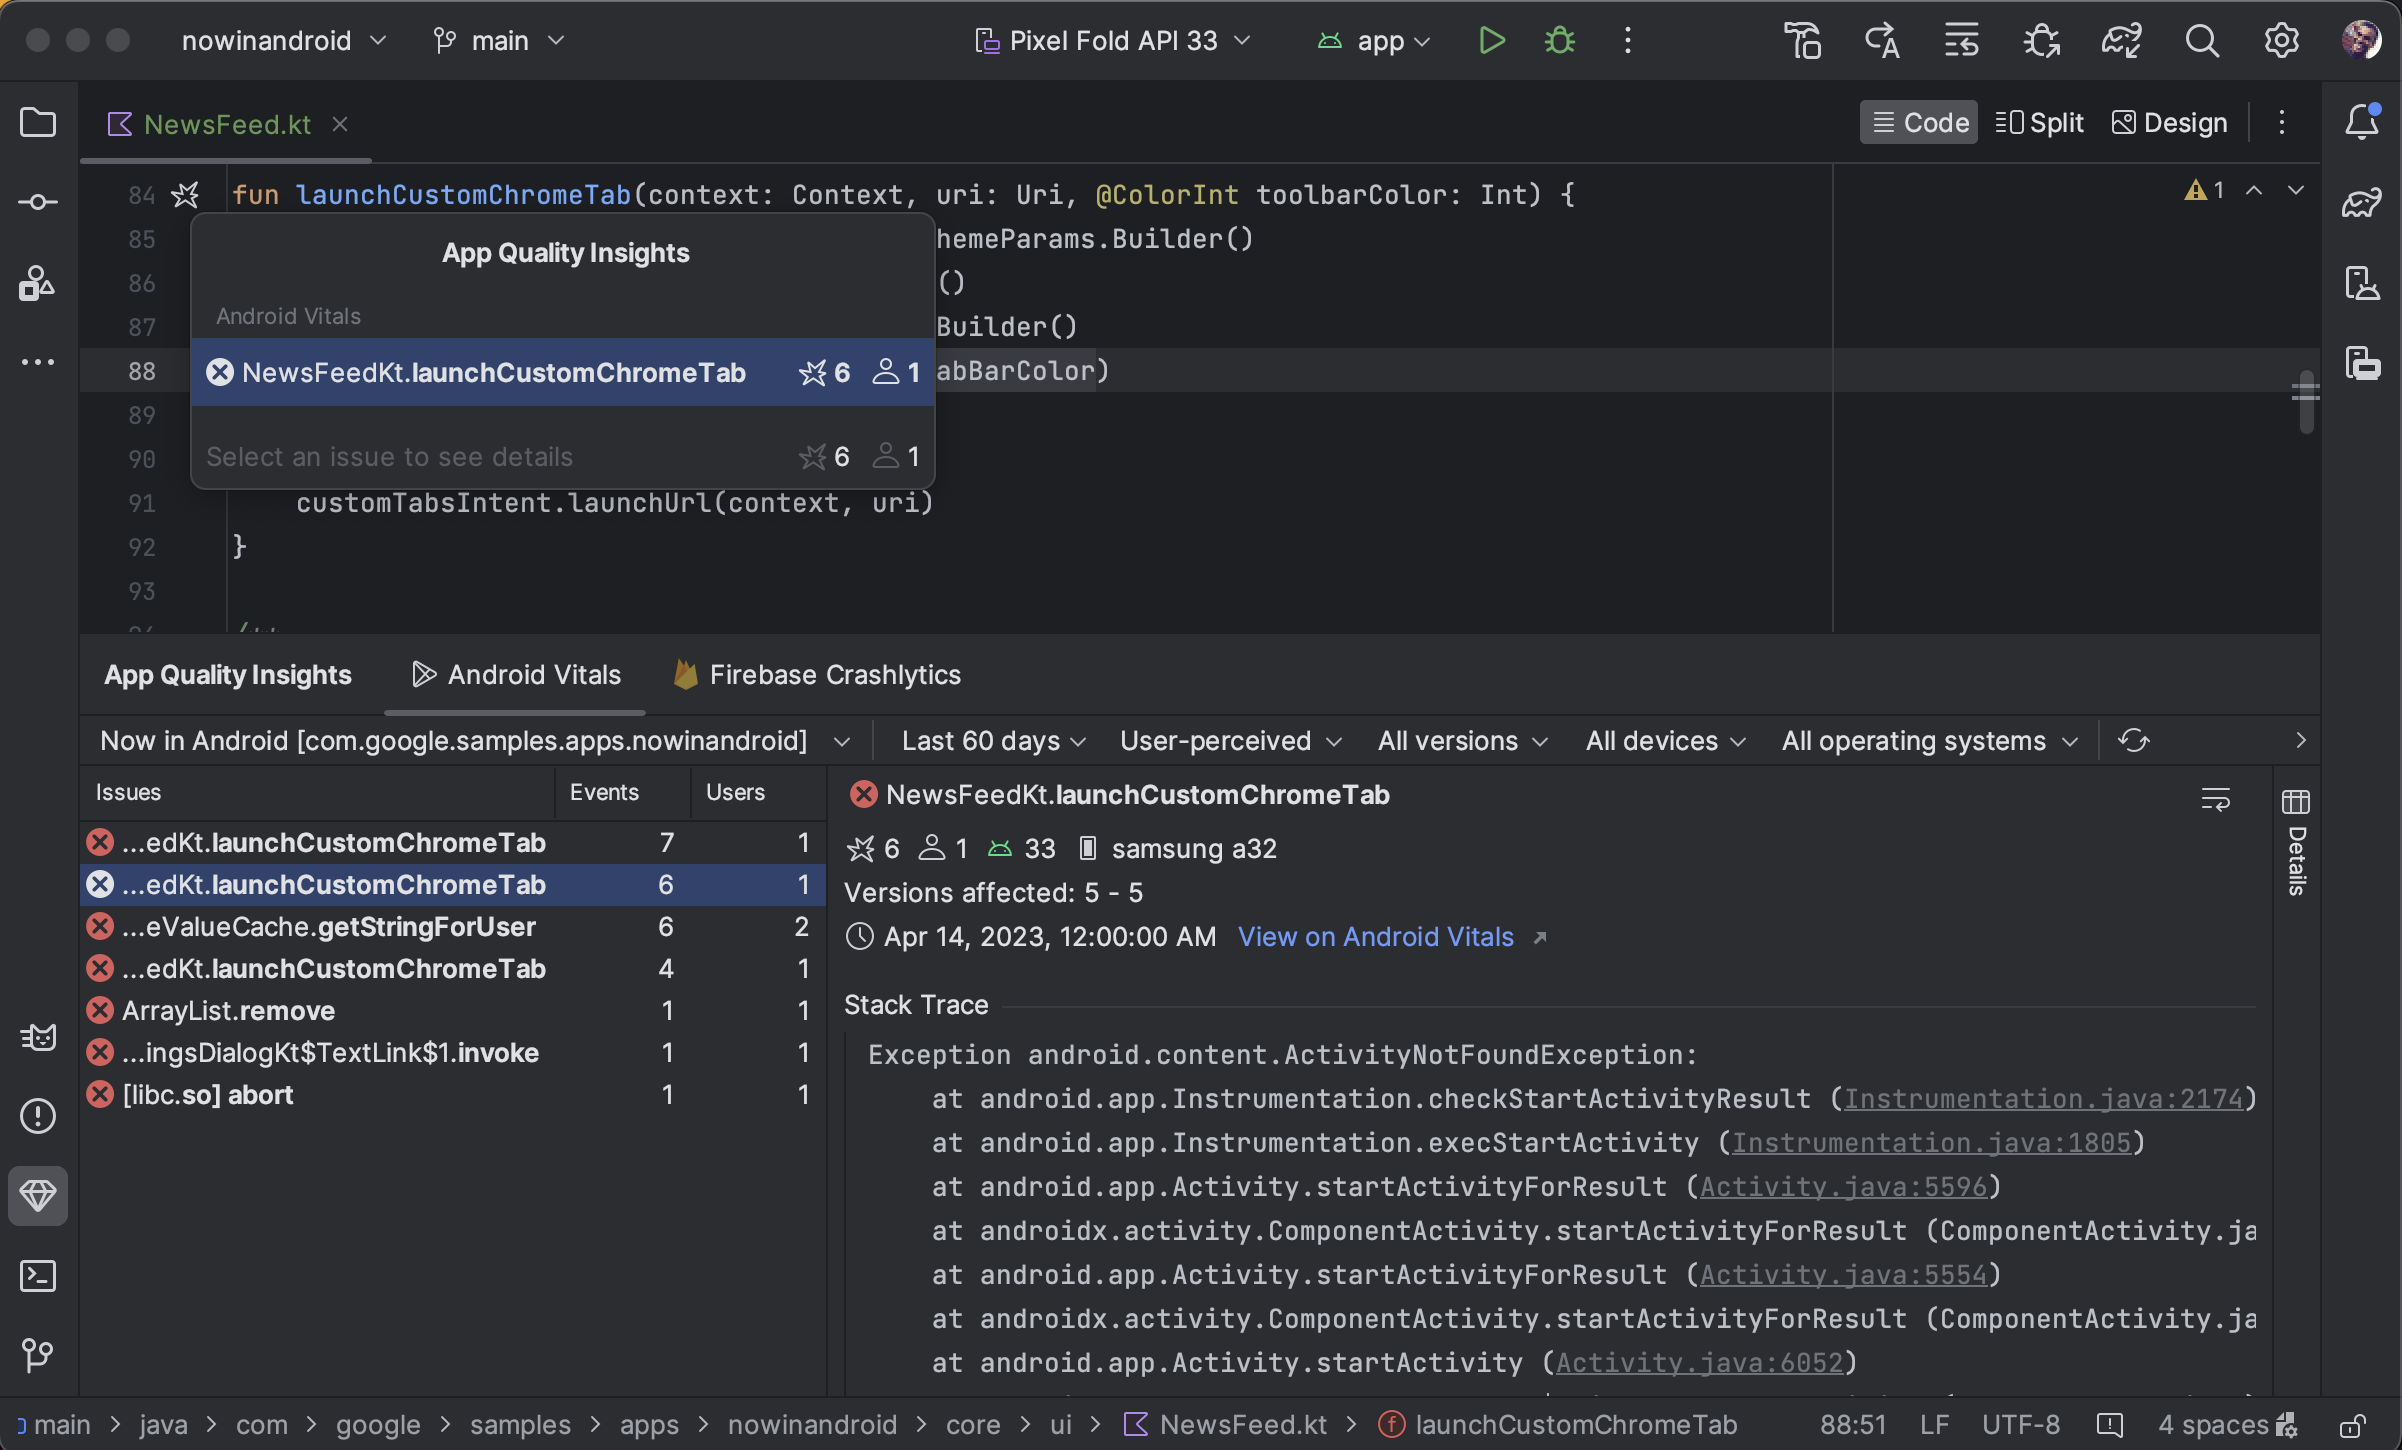
When you hover over the crash icon, a pop-up appears that shows how many events involve that line of code, and the event frequencies.
![]()
Click on the crash icon for a more detailed list of events, including the frequency of and number of users affected by a given event. Click on a specific event to jump to the event details in the App Quality Insights tool window.
![]()
Different numbers between Android vitals and Crashlytics
Note that Android vitals and Crashlytics might report different values for the numbers of users and events associated with the same crash. These discrepancies happen because Play and Crashlytics can catch crashes at different times and for different users. Here are a couple reasons for why the Play and Crashlytics counts might differ:
- Play catches crashes starting at boot time, whereas Crashlytics catches crashes that happen after the Crashlytics SDK initializes.
- If a user opts out of crash reporting when they get a new phone, those crashes aren't reported to Play; however, Crashlytics catches crashes based on an app's own privacy policy.
Investigate with limited functionality when offline
If you make a new request, for example by clicking Refresh, and Android Studio is unable to communicate with Crashlytics, the App Quality Insights window lets you to enter Offline Mode.
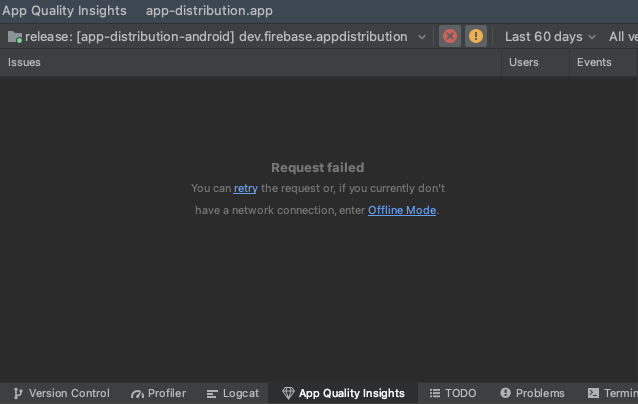
While in this mode, you can continue to investigate issues and the latest events
from cached data. Certain functionality, such as changing some filter options or
closing issues, isn't available. To retry your connection to Crashlytics
and return to an online state, click Reconnect
![]() .
.
Permissions
See service permissions.