
Android Studio 3.0 and higher lets you profile and debug APKs that have debugging enabled without having to build them from an Android Studio project.
To start debugging an APK, follow these steps:
From the Android Studio Welcome screen, click Profile or debug APK.
If you already have a project open, click File > Profile or Debug APK from the menu bar.
In the dialog that opens, select the APK you want to import into Android Studio.
Click OK.
If this option does not show up, make sure you have the "Android APK Support" plugin enabled.
Android Studio then displays the unpacked APK files, similar to figure 1. This is not a fully decompiled set of files, but it does provide SMALI files for a more readable version of the DEX files.
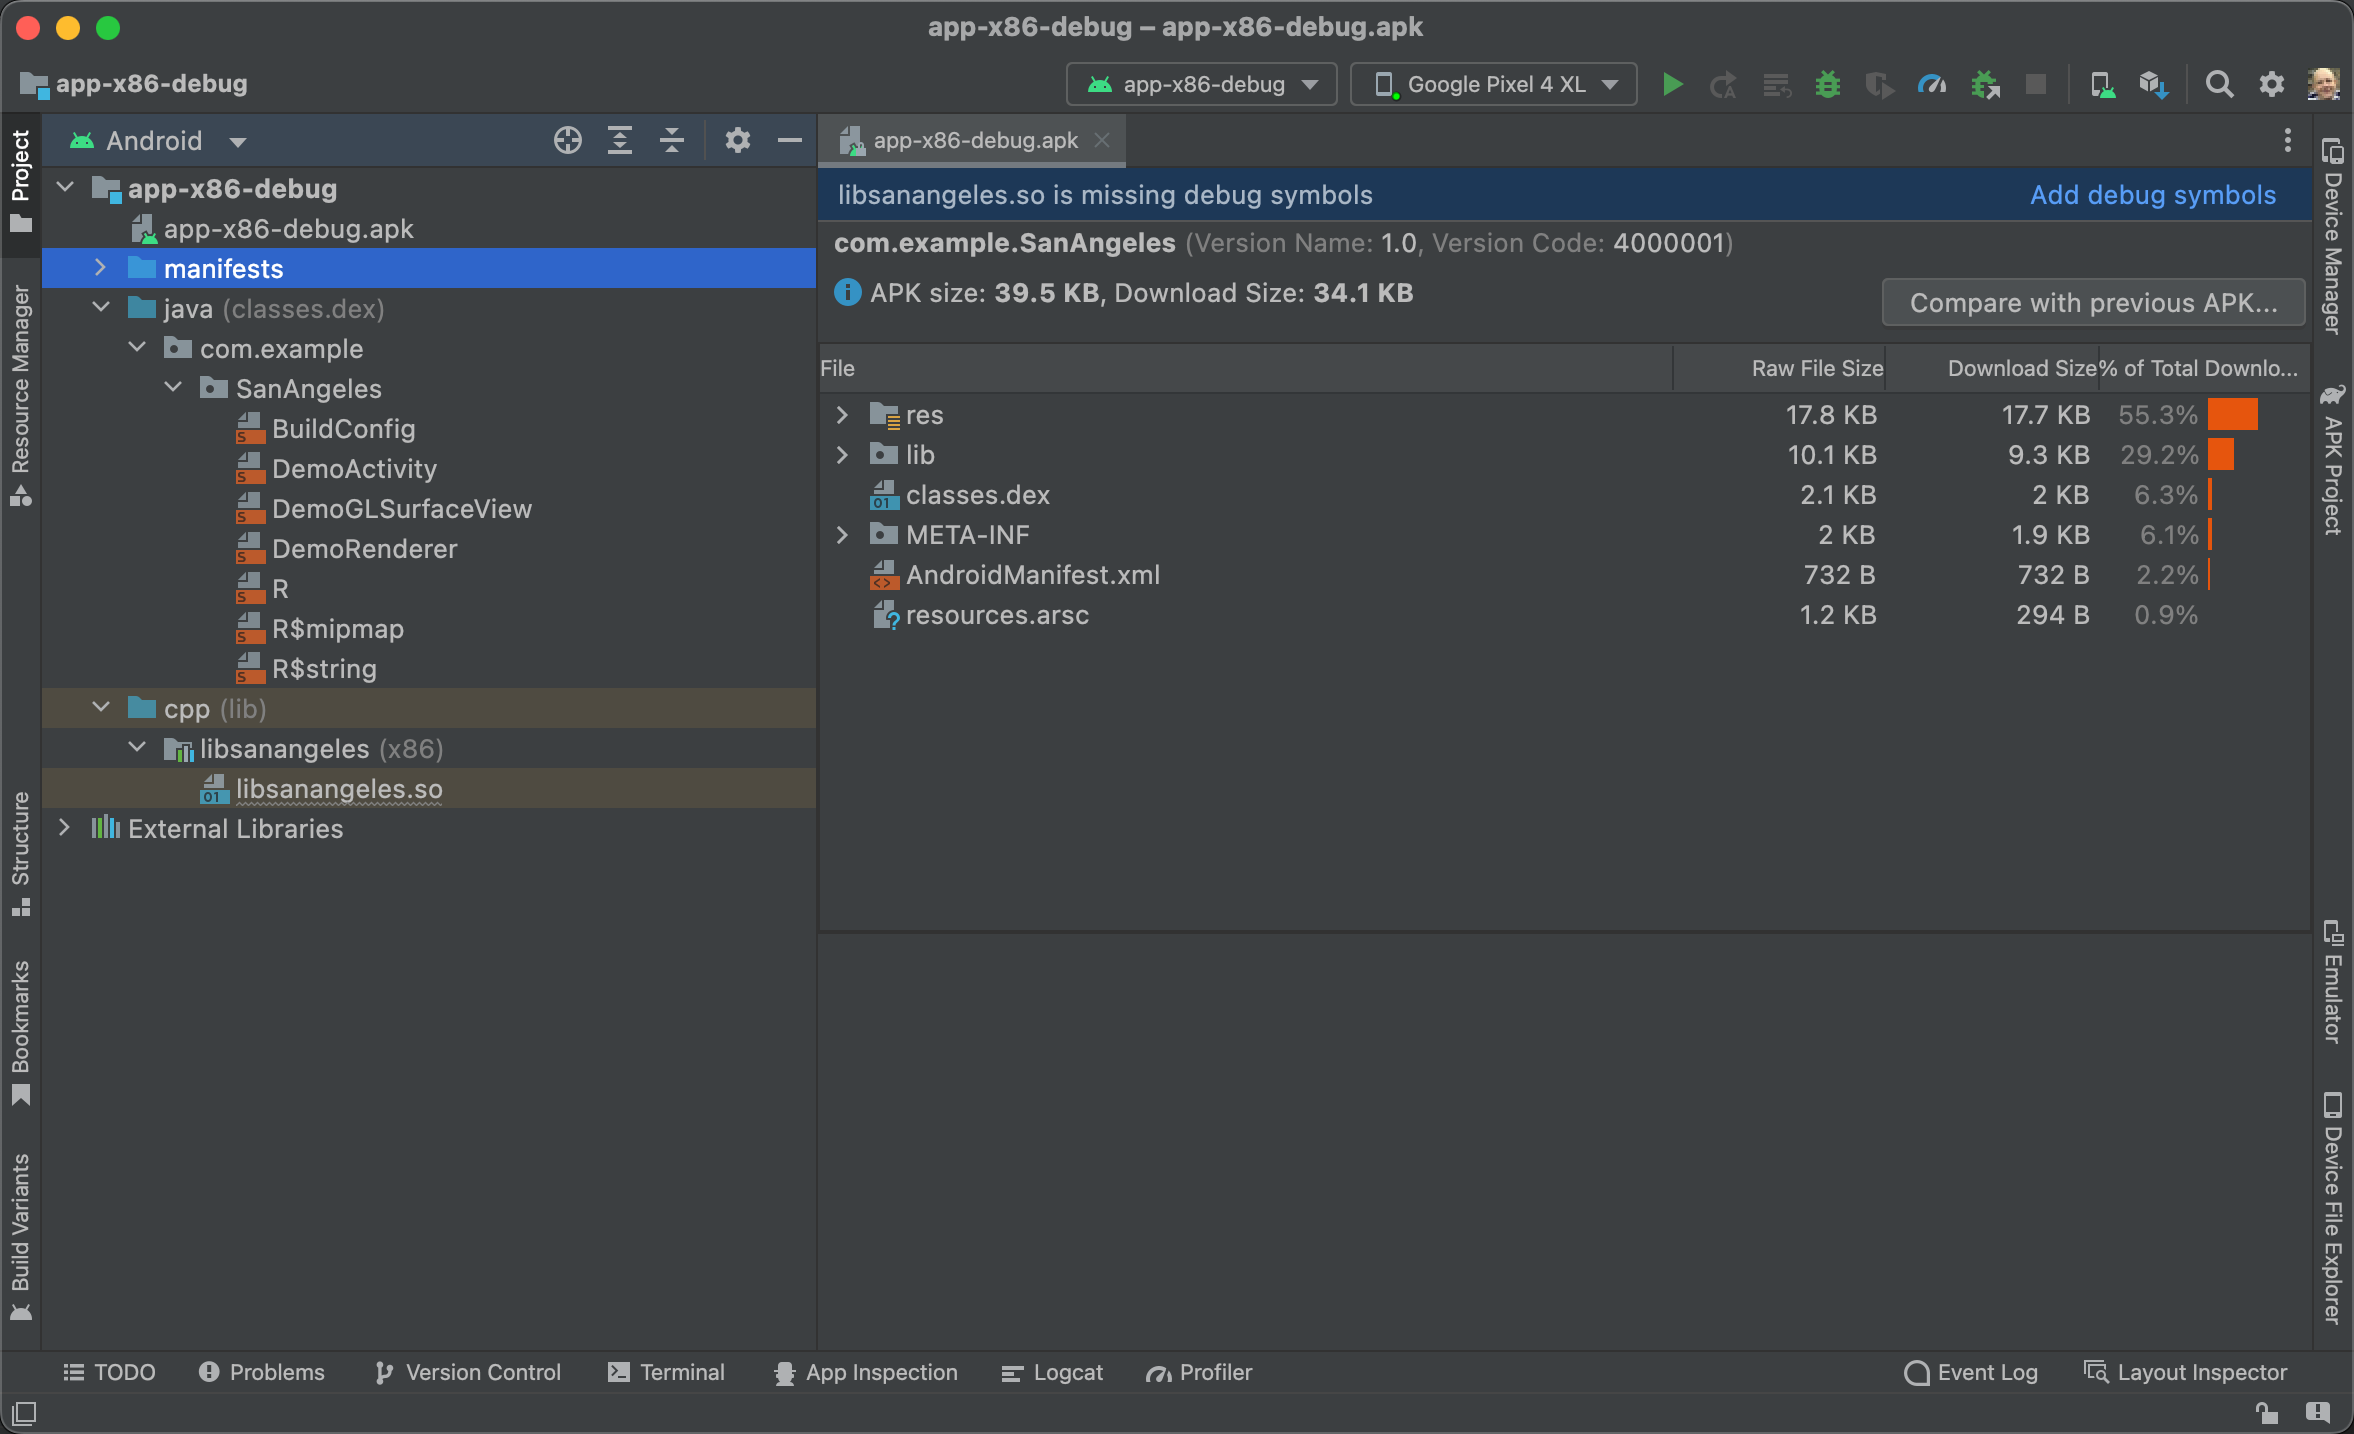
Figure 1. Importing a pre-built APK into Android Studio.
The Android view in the Project pane lets you inspect the following contents of your APK:
- APK file: Double-click the APK to open the APK analyzer.
- manifests: Contains the app manifests that are extracted from the APK.
- java: Contains Kotlin or Java code that Android Studio disassembles (into SMALI files) from your APK’s DEX files. Each SMALI file in this directory corresponds to a Kotlin or Java class.
- cpp: If your app includes native code, this directory contains your APK’s native libraries (SO files).
- External Libraries: Contains the Android SDK.
You can use the Android profiler to start testing your app's performance.
To debug your app's Kotlin or Java code, you need to attach the Kotlin or Java sources and add breakpoints in the Kotlin or Java source files. Similarly, to debug your native code, you must attach the native debug symbols.
Attach Kotlin or Java sources
By default, Android Studio extracts Kotlin or Java code from your APK and saves it as SMALI files. To debug the Kotlin or Java code using breakpoints, you need to point the IDE to the Kotlin or Java source files that correspond to the SMALI files you want to debug.
To attach Kotlin or Java sources, proceed as follows:
- Double click on a SMALI file from the Project pane in the
Android view.
After opening the file, the editor displays a banner asking you to select
the Kotlin or Java sources:

- Click Attach Kotlin/Java Sources... from the banner in the editor window.
- Navigate to the directory with the app’s Kotlin or Java source files and click Open.
In the Project window, Android Studio replaces SMALI files with their corresponding Kotlin or Java source files. Android Studio also includes inner classes automatically. You can now add breakpoints and debug your app.
Attach native debug symbols
If your APK includes native libraries (SO files) that don't include debug symbols, Android Studio shows you a banner, similar to the one shown in figure 1. You can't debug the APK’s native code or use breakpoints without attaching debuggable native libraries.
To attach debuggable native libraries, proceed as follows:
- If you haven't already done so, download the NDK and tools.
In Android view, under the cpp directory in the Project window, double-click a native library file that doesn't include debug symbols.
The editor shows a table of all the ABIs your APK supports.
Click Add in the top-right corner of the editor window.
Navigate to the directory that includes the debuggable native libraries you want to attach and click OK.
If the APK and debuggable native libraries were built using a different workstation, you need to also specify paths to the local debug symbols by following these steps:
Add local paths to missing debug symbols by editing the field under the Local Paths column in the Path Mappings section of the editor window, shown in figure 2.
In most cases, you need only provide the path to a root folder, and Android Studio automatically inspects subdirectories to map additional sources. Android Studio also automatically maps paths to a remote NDK to your local NDK download.
Click Apply Changes in the Path Mappings section of the editor window.
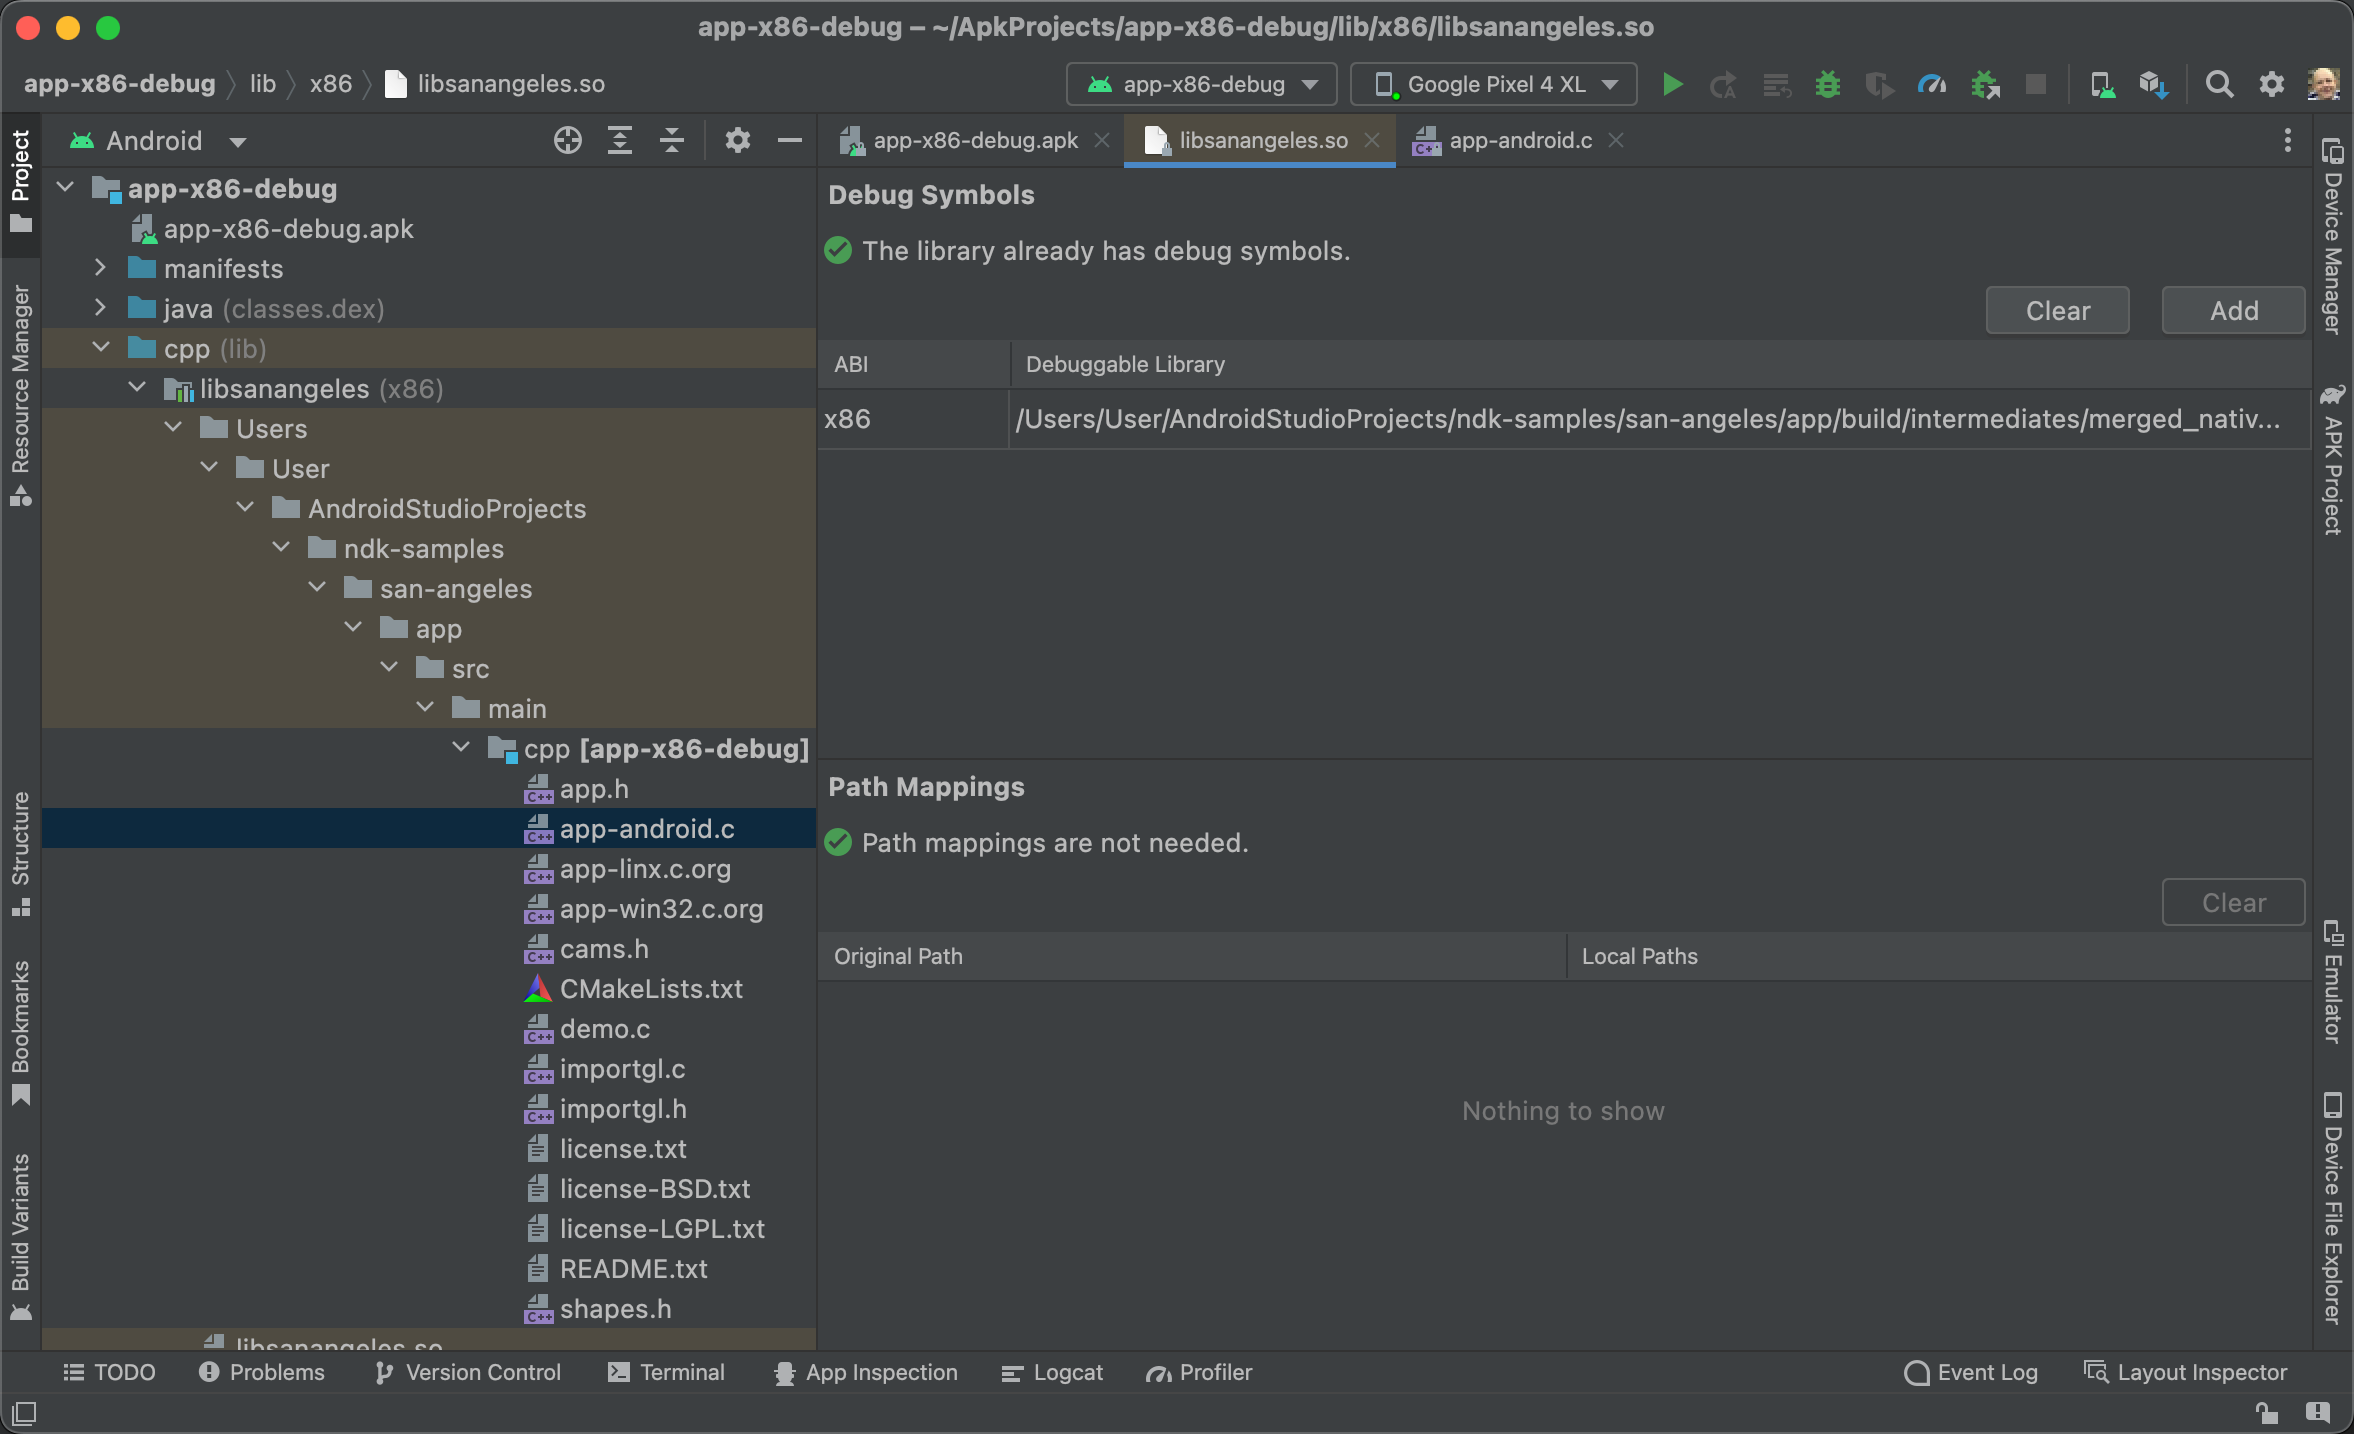
Figure 2. Local paths to debug symbols.
The native source files appear in the Project window. Open those native source files to add breakpoints and debug your app. To remove the mappings, click Clear in the Path Mappings section of the editor window.
Known issue: When attaching debug symbols to an APK, both the APK and debuggable SO files must be built using the same workstation or build server.
In Android Studio 3.6 and higher, you don't need to create a new project when the APK is updated outside the IDE. Android Studio detects changes in the APK and gives you the option to re-import it.

Figure 3. APKs updated outside Android Studio can be re-imported.