
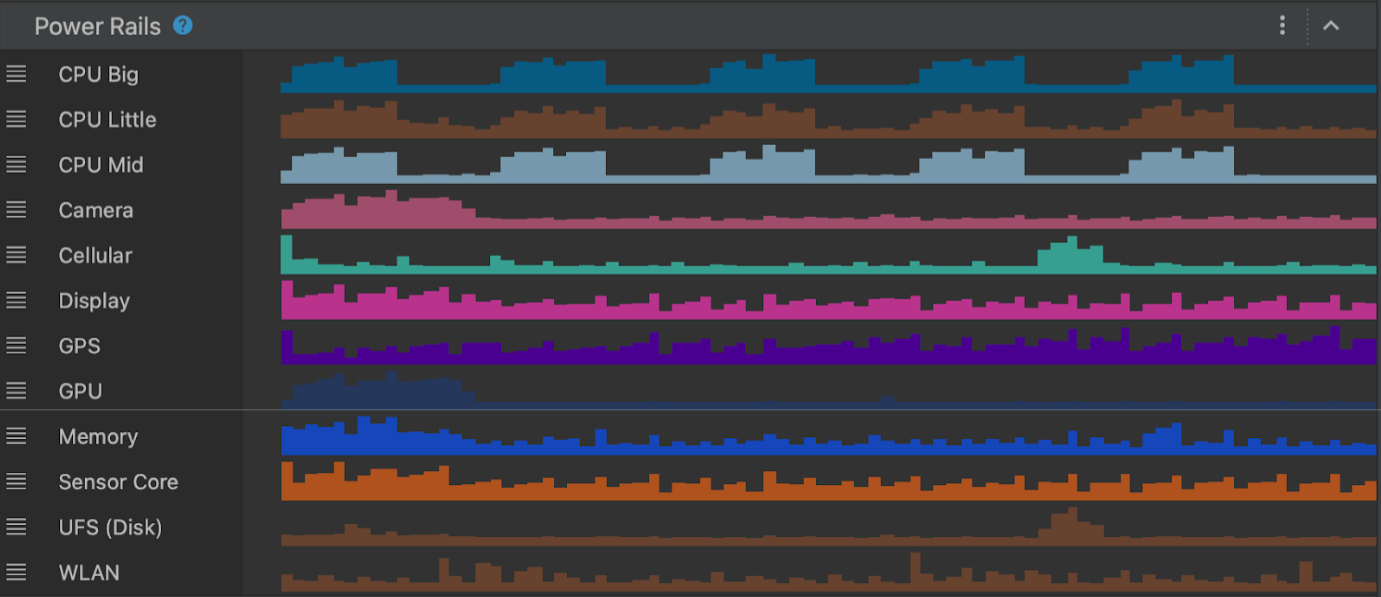
Starting in Android Studio Hedgehog, the Power Profiler shows power consumption on devices. You can view this new data in the On Device Power Rails Monitor (ODPM). It segments the information by subsystems called "Power Rails". See Profileable power rails for a list of supported sub-systems.
The System Trace records and displays power consumption data. It is part of the CPU profiler This data helps you to visually correlate power consumption of the device with the actions occurring in your app. The Power Profiler enables visualizing this data.
Profileable power rails
The ODPM reports all profileable power rails and is available in Android 10 (API level 29) and higher and on Pixel 6 and subsequent Pixel devices.
| Power rail name | Description |
|---|---|
| CPU Big | Power being consumed by the big CPU core. |
| CPU Little | Power being consumed by the little CPU core. |
| CPU Mid | Power being consumed by the mid CPU core. |
| Camera | Power being consumed by the camera sensor. |
| Cellular | Power being consumed by the cellular sensor. |
| Display | Power being consumed by the display. |
| GPS | Power being consumed by the GPS sensor. |
| GPU | Power being consumed by the GPU sensor. |
| Memory | Power being consumed by the RAM memory sensor. |
| Sensor core | Power being consumed by other device sensors. |
| UFS (disk) | Power being consumed by the Disk sensor. |
| WLAN | Power being consumed by the Wifi sensor. |
Devices that don't support ODPM can offer power consumption data through Coulomb counters and the battery gauge.
| Name | Description |
|---|---|
| Capacity | The remaining battery percentage (%). |
| Charge | The remaining battery charge in microampere-hours (µAh). |
| Current | The instantaneous current in microampere (µA). |
Example scenarios for profiling power consumption through the Power Profiler
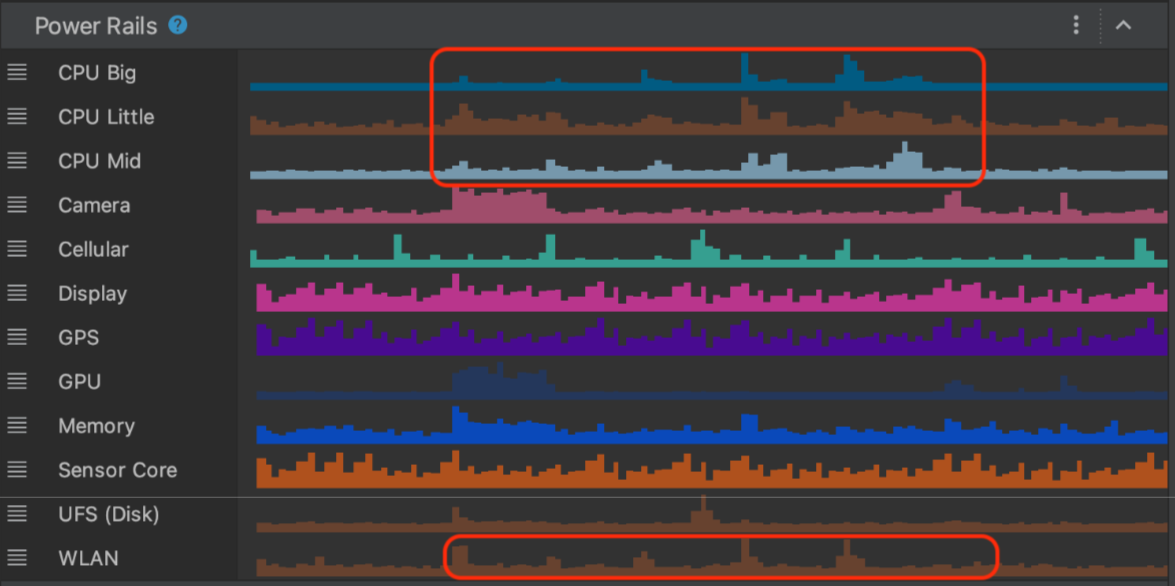
Assume you are building an app that needs to download assets over the network. You want to understand how the power consumption of WLAN power rail changes while downloading assets individually versus in a large chunk.
Scenario A: The app makes individual network requests to download assets over WLAN.
Scenario B: The app makes one network request to download a very large asset over WLAN.
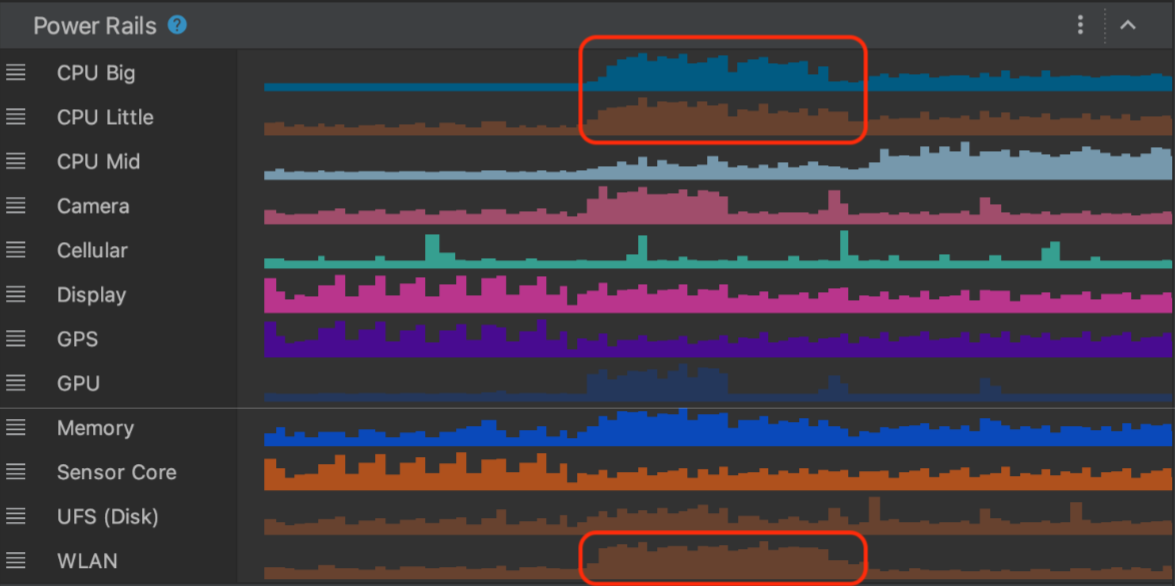
As shown in the preceding scenarios, the two system traces show different signatures of power consumption in the WLAN power rail based on how you trigger the download.
Even though the preceding example is a simple way to measure power consumption in different scenarios, it demonstrates the process with which you can build more sophisticated A/B tests for your app. You can use these tests to optimize power consumption across different features or different implementations of the same feature.
Important notes
- ODPM measures power consumption at the device level—not specific to any app. You can correlate power consumption information from the ODPM to what's happening in your app foreground or background. As a result, you can expect noise in power consumption data based on how many apps are active in the device at the time of reading ODPM data.
- Power Profiler reads power consumption data from the ODPM, which is only available on Pixel 6 and subsequent Pixel devices running Android 10 (API level 29) and higher.
- Some power rails might only be available on some devices implementing ODPM.