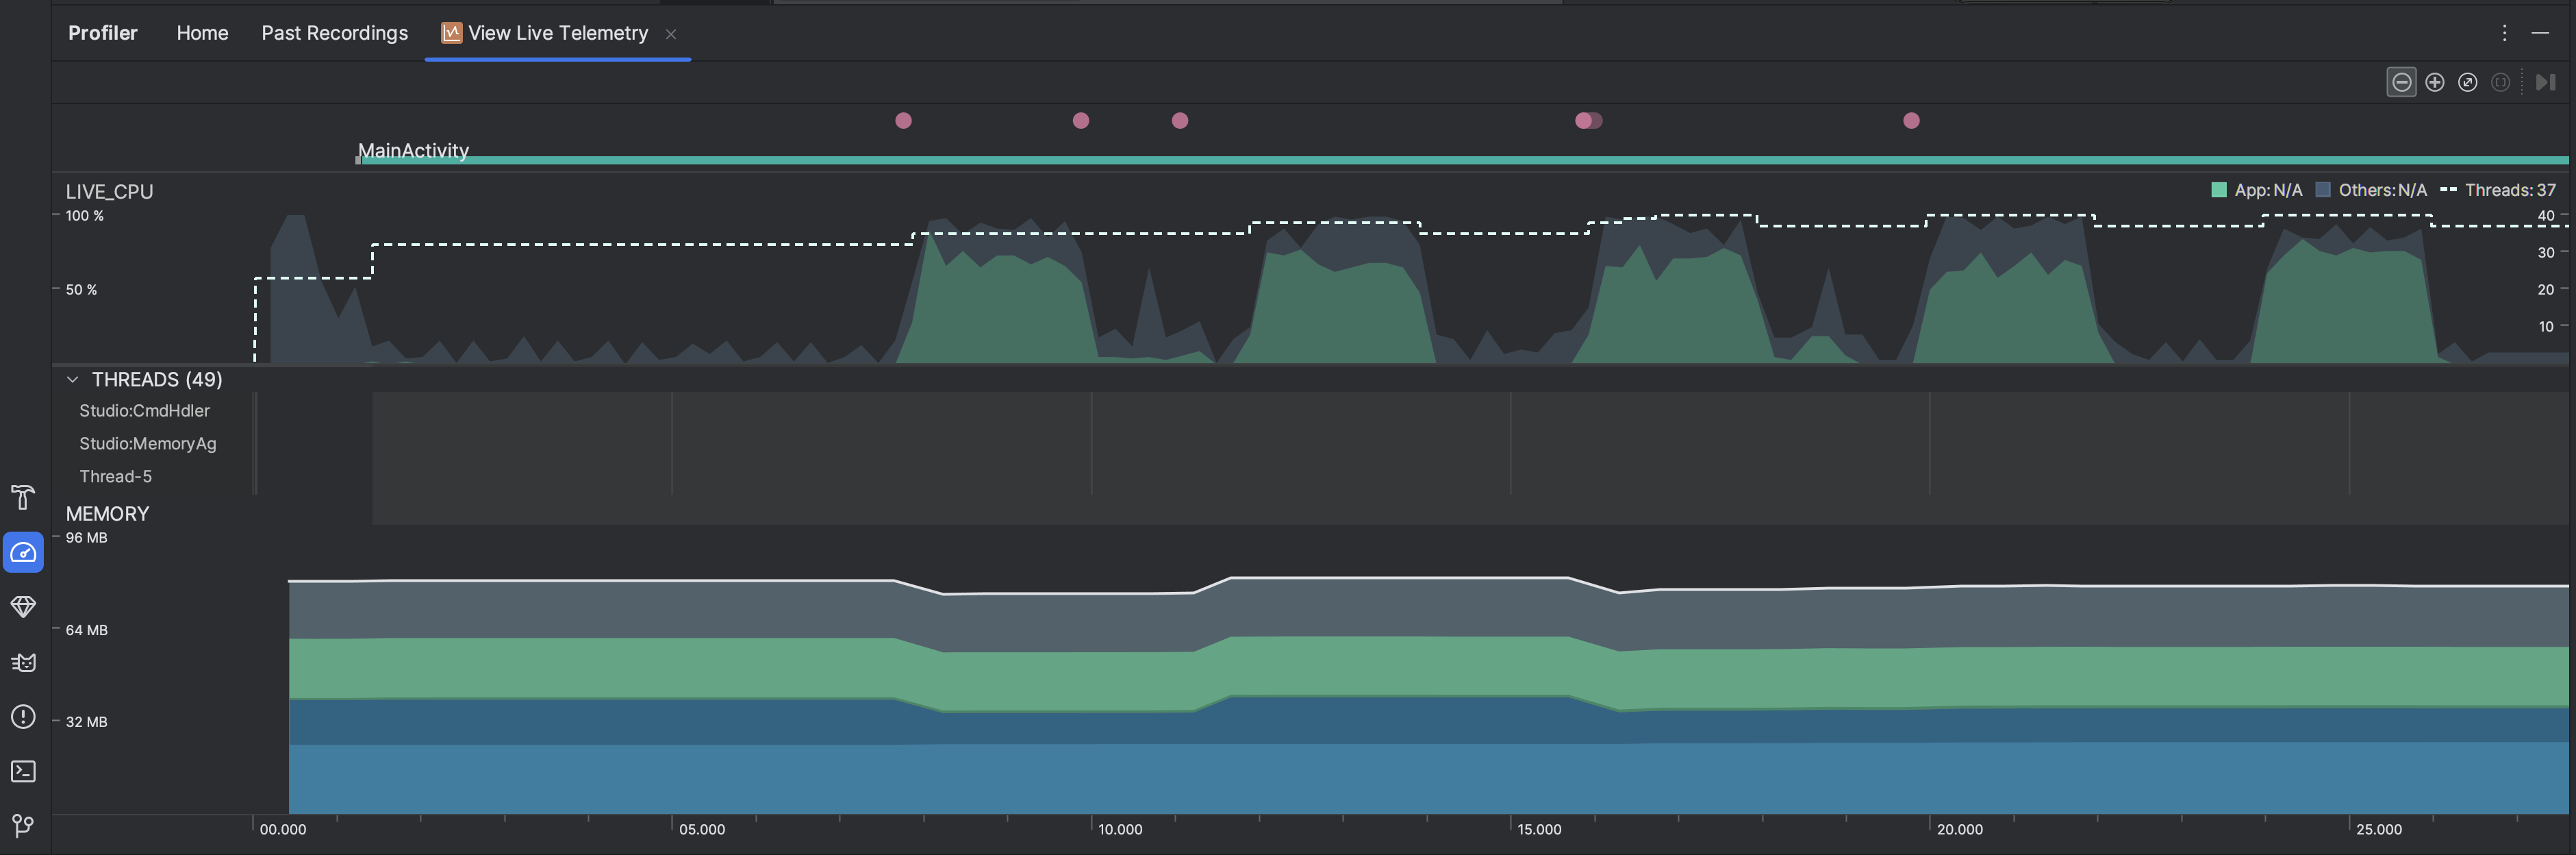
Inspecting your app live gives you a high-level overview of the device's CPU usage, thread activity, and memory usage. If you don't know where to start with profiling your app, use live view to conduct an exploratory analysis, and then dig deeper with the specific profiling tasks when you see behavior that can be optimized.
To start live view, select the View Live Telemetry profiling task. When the task starts, it starts displaying the following visualizations in real time:
- Interactions: Shows user interaction and app lifecycle events along a timeline (requires a debuggable app process and a device running API level 26 or higher).
- CPU usage: Shows real-time CPU usage of your app—as a percentage of total available CPU time—and the total number of threads your app is using. The timeline also shows the CPU usage of other processes (such as system processes or other apps), so you can compare it to your app's usage. You can inspect historical CPU usage data by moving your mouse along the horizontal axis of the timeline.
- Threads: Lists each thread that belongs to your app process and indicates its
activity along a timeline using the following colors:
- Green: The thread is active or is ready to use the CPU. That is, it's in a running or runnable state.
- Yellow: The thread is active, but it's waiting on an I/O operation (for example, disk or network I/O) before it can complete its work.
- Gray: The thread is sleeping and is not consuming any CPU time. This sometimes occurs when the thread requires access to a resource that is not yet available. Either the thread goes into voluntary sleep, or the kernel puts the thread to sleep until the required resource becomes available.
- The CPU Profiler also reports CPU usage of threads that Android Studio and
the Android platform add to your app process—such as
JDWP,Profile Saver,Studio:VMStats,Studio:Perfa, andStudio:Heartbeat(although, the exact names displayed in the thread activity timeline might vary). Android Studio reports this data so that you can identify when thread activity and CPU usage are actually caused by your app's code.
- Memory: Shows a stacked graph of how much memory is being used by each memory category, as indicated by the y-axis on the left and the color key at the top.