
The Top Down tab displays a list of calls in which expanding a method or function node displays its callees. Figure 2 shows a top down graph for the following call chart. Each arrow in the graph points from a caller to a callee.
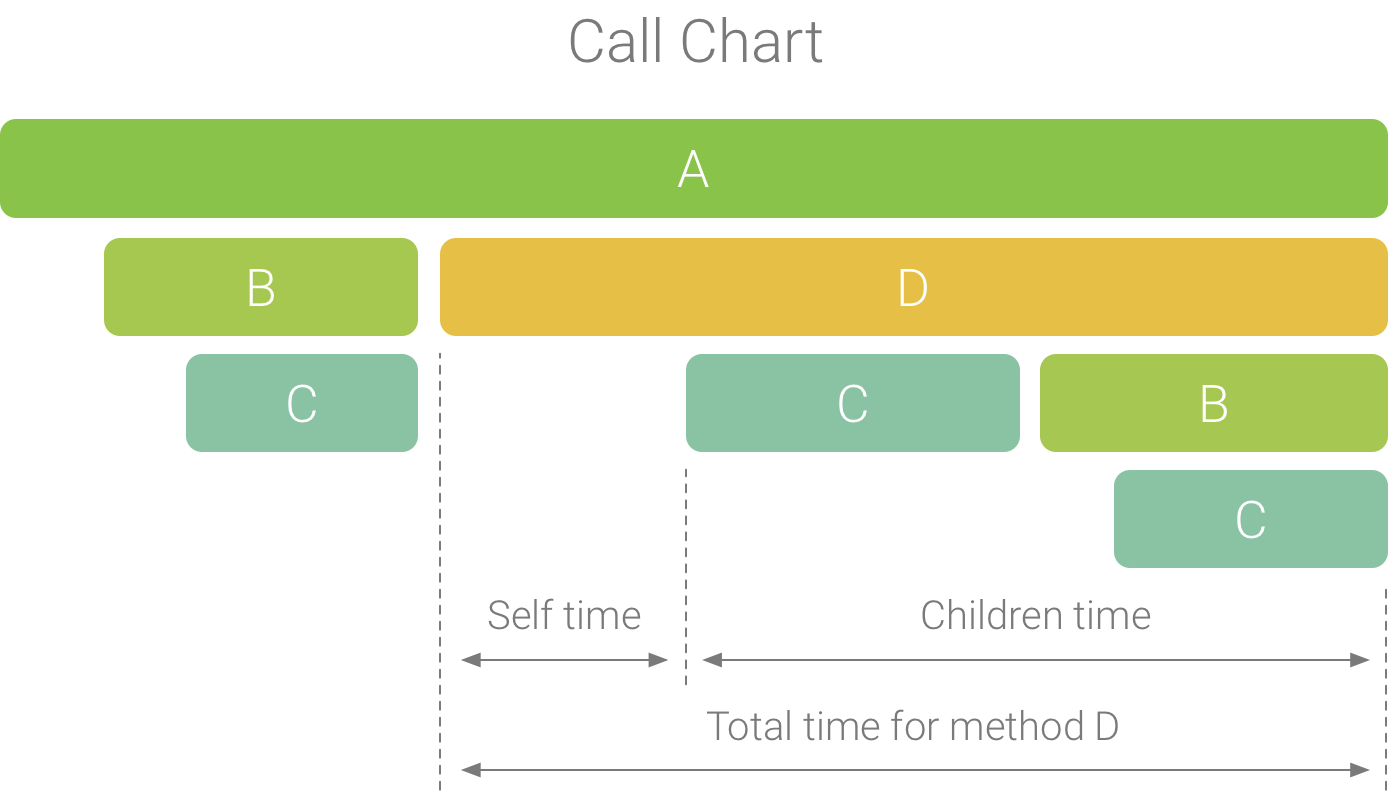
Figure 1. An example call chart that illustrates self, children, and total time for method D.
As shown in Figure 2, expanding the node for method A in the Top Down tab displays its callees, methods B and D. After that, expanding the node for method D exposes its callees, such as methods B and C. Similar to the Flame chart tab, the top down tree aggregates trace information for identical methods that share the same call stack. That is, the Flame chart tab provides a graphical representation of the Top Down tab.
The Top Down tab provides the following information to help describe CPU time spent on each call (times are also represented as a percentage of the thread's total time over the selected range):
- Self: the time the method or function call spent executing its own code and not that of its callees, as illustrated in Figure 1 for method D.
- Children: the time the method or function call spent executing its callees and not its own code, as illustrated in Figure 1 for method D.
- Total: the sum of the method's Self and Children time. This represents the total time the app spent executing a call, as illustrated in Figure 1 for method D.
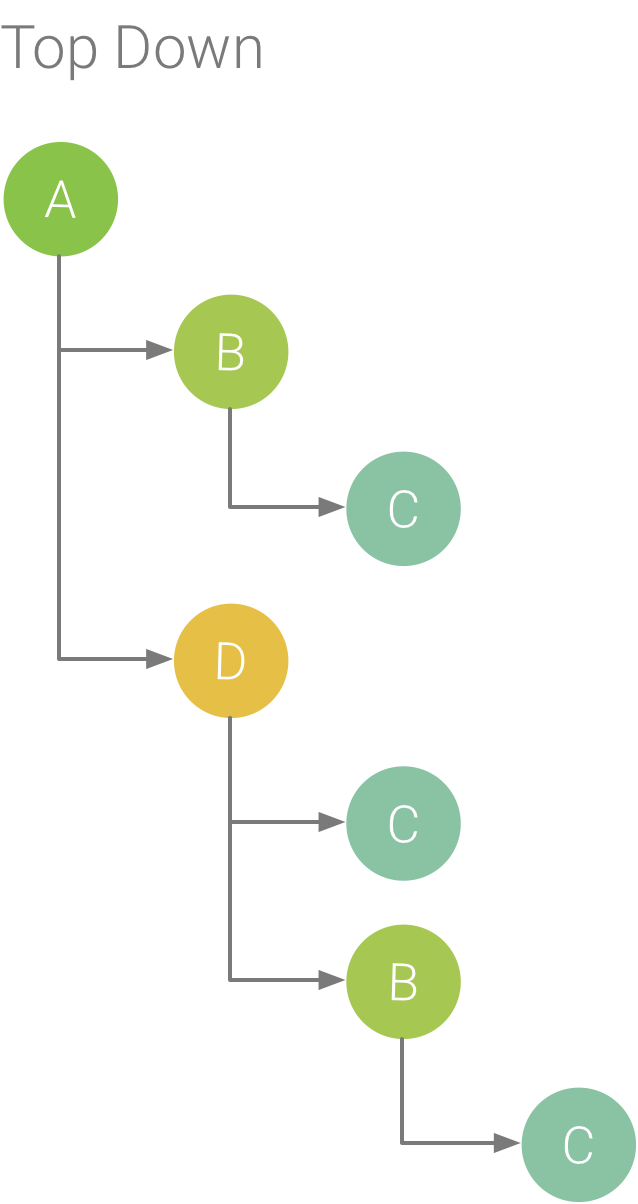
Figure 2. A Top Down tree.
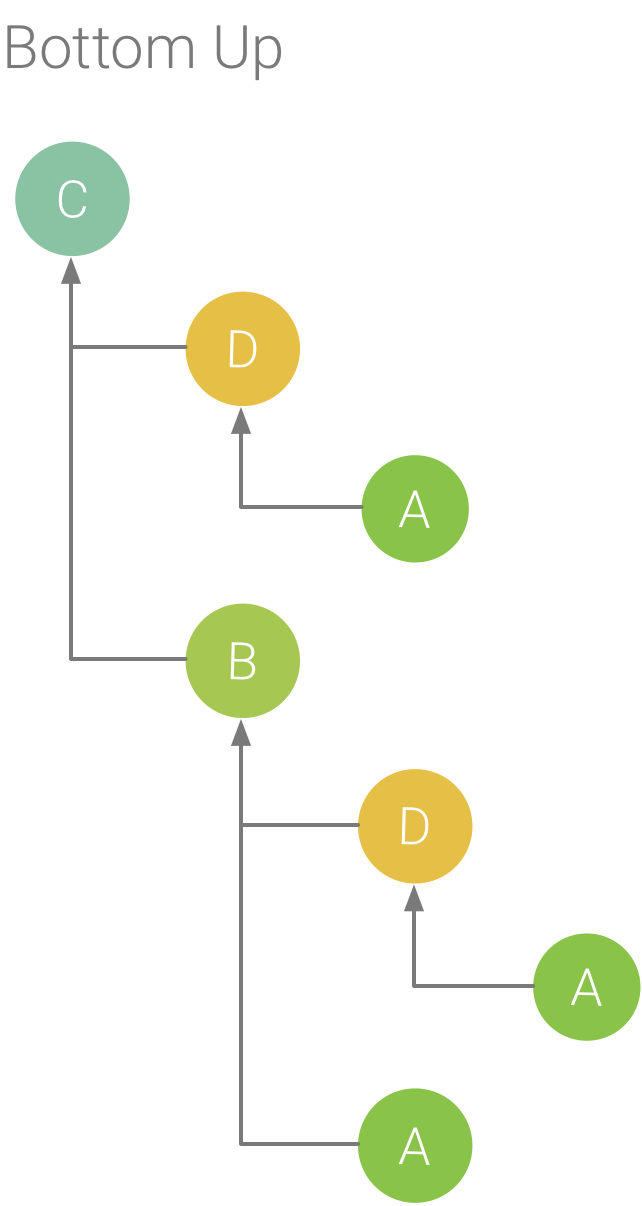
Figure 3. A Bottom Up tree for method C from Figure 5.
The Bottom Up tab displays a list of calls in which expanding a function or method's node displays its callers. Using the example trace shown in Figure 2, figure 3 provides a bottom up tree for method C. Opening the node for method C in the bottom up tree displays each of its unique callers, methods B and D. Note that, although B calls C twice, B appears only once when expanding the node for method C in the bottom up tree. After that, expanding the node for B displays its caller, methods A and D.
The Bottom Up tab is useful for sorting methods or functions by those that consume the most (or least) CPU time. You can inspect each node to determine which callers spend the most CPU time invoking those methods or functions. Compared to the top down tree, timing info for each method or function in a bottom up tree is in reference to the method at the top of each tree (top node). CPU time is also represented as a percentage of the thread's total time during that recording. The following table helps explain how to interpret timing information for the top node and its callers (sub-nodes).
| Self | Children | Total | |
|---|---|---|---|
| Method or function at the top of the bottom up tree (top node) | Represents the total time the method or function spent executing its own code and not that of its callees. Compared to the top down tree, this timing information represents a sum of all calls to this method or function over the duration of the recording. | Represents the total time the method or function spent executing its callees and not its own code. Compared to the top down tree, this timing information represents the sum of all calls to this method or function's callees over the duration of the recording. | The sum of the self time and children time. |
| Callers (sub-nodes) | Represents the total self time of the callee when being called by the caller. Using the bottom up tree in Figure 6 as an example, the self time for method B would equal the sum of the self times for each execution of method C when called by B. | Represents the total children time of the callee when being invoked by the caller. Using the bottom up tree in Figure 6 as an example, the children time for method B would equal the sum of the children times for each execution of method C when called by B. | The sum of the self time and children time. |
Note: For a given recording, Android Studio stops collecting new data when the profiler reaches the file size limit (however, this does not stop the recording). This typically happens much more quickly when performing instrumented traces because this type of tracing collects more data in a shorter time, compared to a sampled trace. If you extend the inspection time into a period of the recording that occurred after reaching the limit, timing data in the trace pane does not change (because no new data is available). Additionally, the trace pane displays NaN for timing information when you select only the portion of a recording that has no data available.