
The Background Task Inspector helps you visualize, monitor, and debug your app's background workers when using WorkManager library 2.5.0 or higher.
Get started
To list workers in the Background Task Inspector, do the following:
Run your app on an emulator or connected device running API level 26 or higher.
Select View > Tool Windows > App Inspection from the menu bar.
Select the Background Task Inspector tab.
Select the running app process from the menu.
The workers in the currently running app appear in the Background Task Inspector pane. Click on the worker that you want to inspect further.
View and inspect workers
When you deploy an app using WorkManager 2.5.0 or higher on a device running API level 26 or higher, the Background Task Inspector tab shows active workers. The Background Task Inspector (shown in a later section as figure 3) lists the class name, current status, start time, and retries of all jobs, whether they are running, failed, or completed.
Work Details
Click a job from the list to open the Work Details panel, which displays detailed information about the worker, as shown in figure 1.
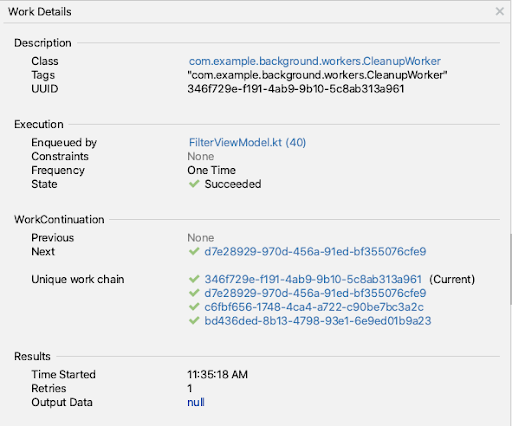
- Description: This section lists the worker class name, with the fully qualified package, as well as the assigned tag and the UUID of the worker.
- Execution: This section shows the worker’s constraints (if any), running frequency, and state, as well as which class created and queued the worker.
- WorkContinuation: This section displays where the worker is in the work chain. To check the details of another worker in the work chain, click its UUID.
- Results: This section displays the start time, retry count, and the output data of the selected worker.
Cancel workers
To stop a currently running or enqueued worker, select the worker and click
Cancel Selected Worker  from the toolbar.
View Graph View
Because workers can be chained together, it’s sometimes useful to visualize worker dependencies as a graph.
To see a visual representation of a worker
chain, select a worker from the table and click Show Graph View  from the toolbar. Only workers are drawn in the graph.
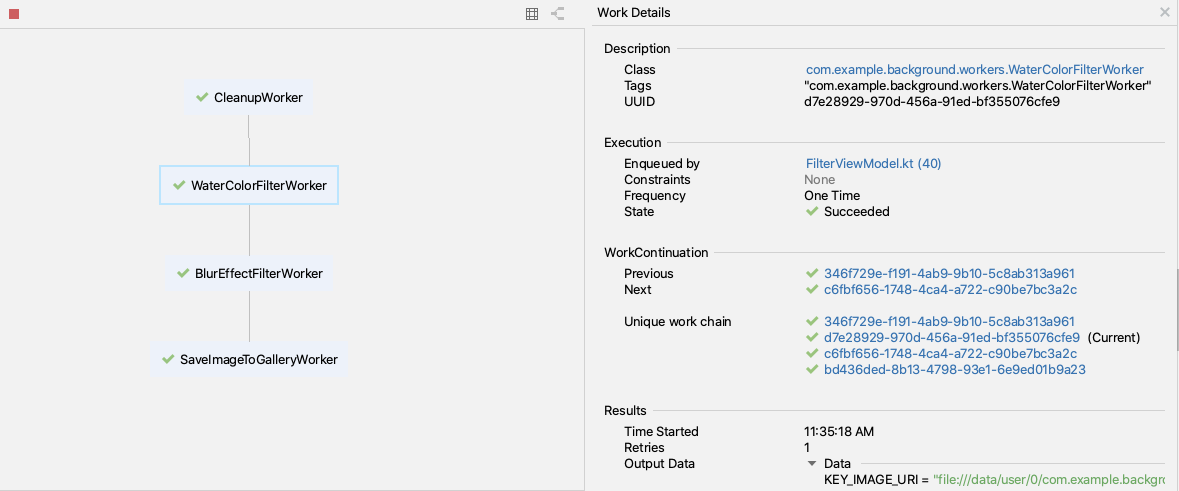
The graph lets you quickly see relationships between workers and monitor their progress in complex chaining relationships.
To return to the list view, click Show List View  .
.
View and inspect Jobs, Alarms, and Wakelocks
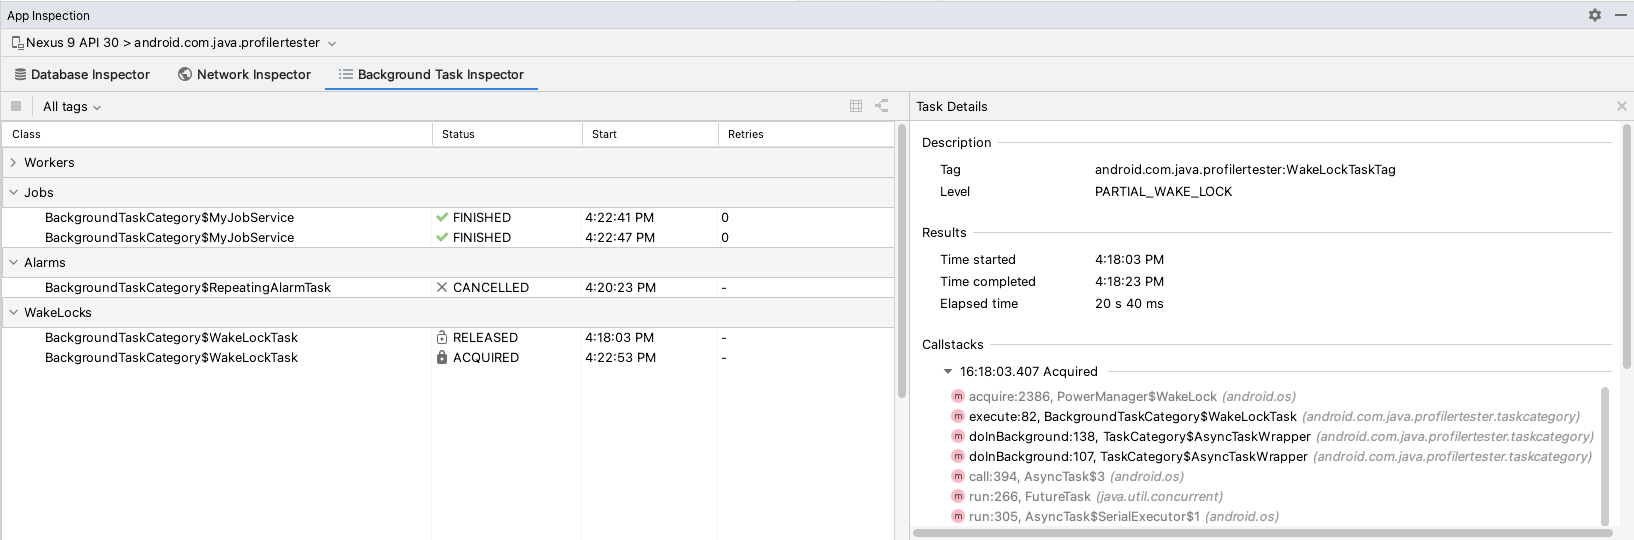
The Background Task Inspector also lets you inspect your app’s Jobs, Alarms, and Wakelocks. Each type of asynchronous task appears under the appropriate heading in the inspector tab, letting you easily monitor its status and progress.
Similar to workers, you can select a Job, Alarm, or Wakelock to inspect its detailed information in the Task Details panel.
To view detailed information for a Worker, Job, Alarm, or Wakelock, select it in the Task Details panel on the right.
Additional resources
To learn more about the Background Task Inspector, see the following additional resources: