
Android renders UI by generating a frame from your app and displaying it on the screen. If your app suffers from slow UI rendering, then the system is forced to skip frames. When this happens, the user perceives a recurring flicker on their screen, which is referred to as jank.
When jank occurs, it's usually because of some deceleration or blocking async call on the UI thread (in most apps, it's the main thread). You can use system traces to identify where the problem is.
If you are using Jetpack Compose, the best way to investigate rendering performance in the trace is by enabling composition tracing. To read about common Compose performance issues, see Jetpack Compose Performance.
For Compose apps, use the steps in this guide when you need a macro-level view of your app. The system traces introduced here help you identify jank caused by system-level issues blocking the main thread, such as heavy disk I/O, aggressive garbage collection, or GPU rendering bottlenecks. Use the Jetpack Compose Performance guide if you have isolated the jank to your UI layer. That guide helps you fix Compose-specific inefficiencies like excessive recompositions, reading state in the wrong phase, or using unstable parameters.
Detect jank on Android 12 and higher
For devices using Android 12 (API level 31) or higher, a captured trace is shown in the Janky frames track under the Display pane in the CPU Profiler.
To detect jank,
In Android Studio, select View > Tool Windows > Profiler or click Profile
 in the toolbar.
If prompted by the Select Deployment Target dialog, choose the device to which to deploy your app for profiling. If you've connected a device over USB but don't see it listed, ensure that you have enabled USB debugging.
Click anywhere in the CPU timeline to open the CPU Profiler.
Select System Trace from the configurations menu in the CPU Profiler and click Record. After you finish interacting with your app, click Stop.
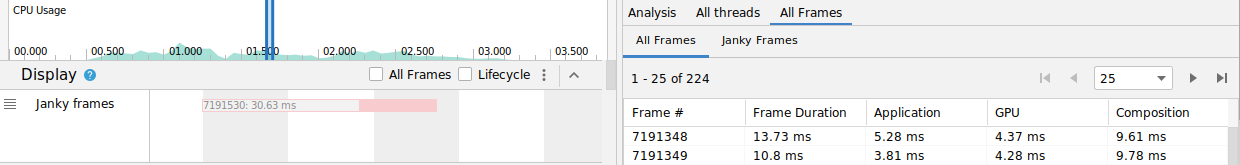
You should see the Janky frames track under Display. By default, the Profiler only shows janky frames as candidates for investigation. Within each janky frame, the red portion highlights the duration the frame takes past its rendering deadline.
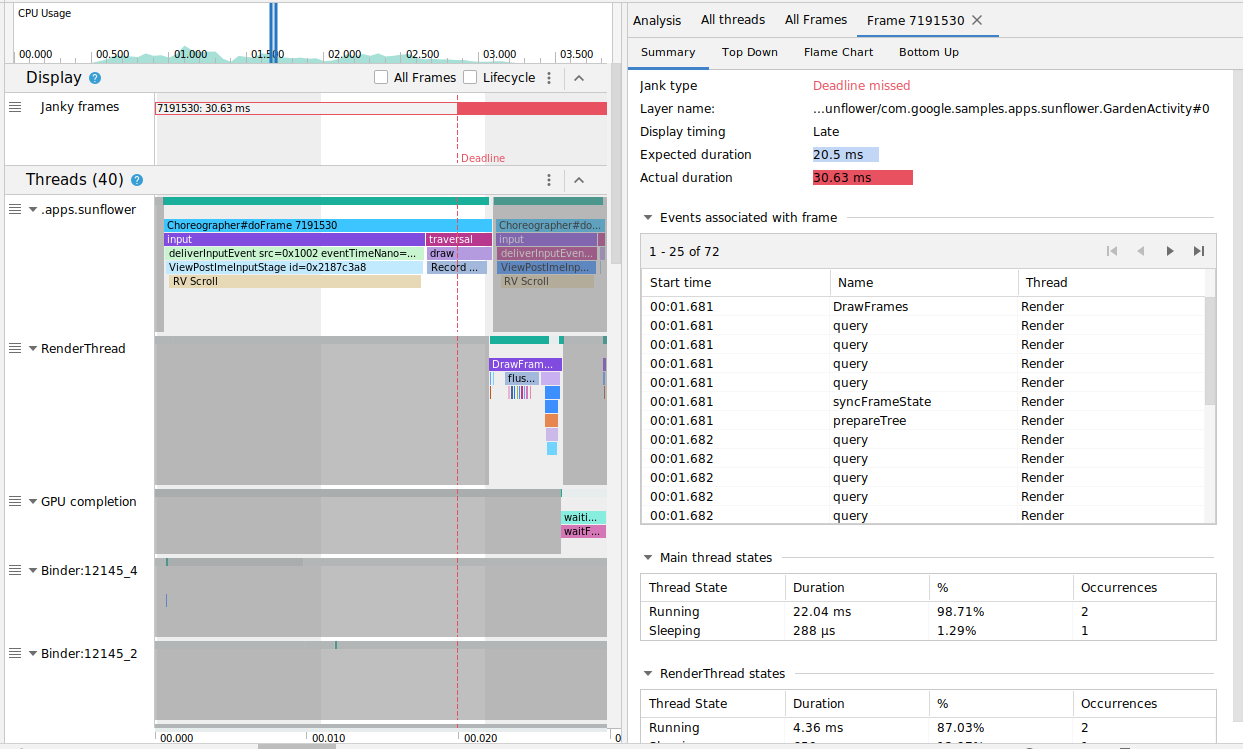
Once you find a janky frame, click on it; optionally, you can press M to adjust the zoom to focus on the selected frame. The relevant events are highlighted in these threads: the main thread, RenderThread and GPU completion.
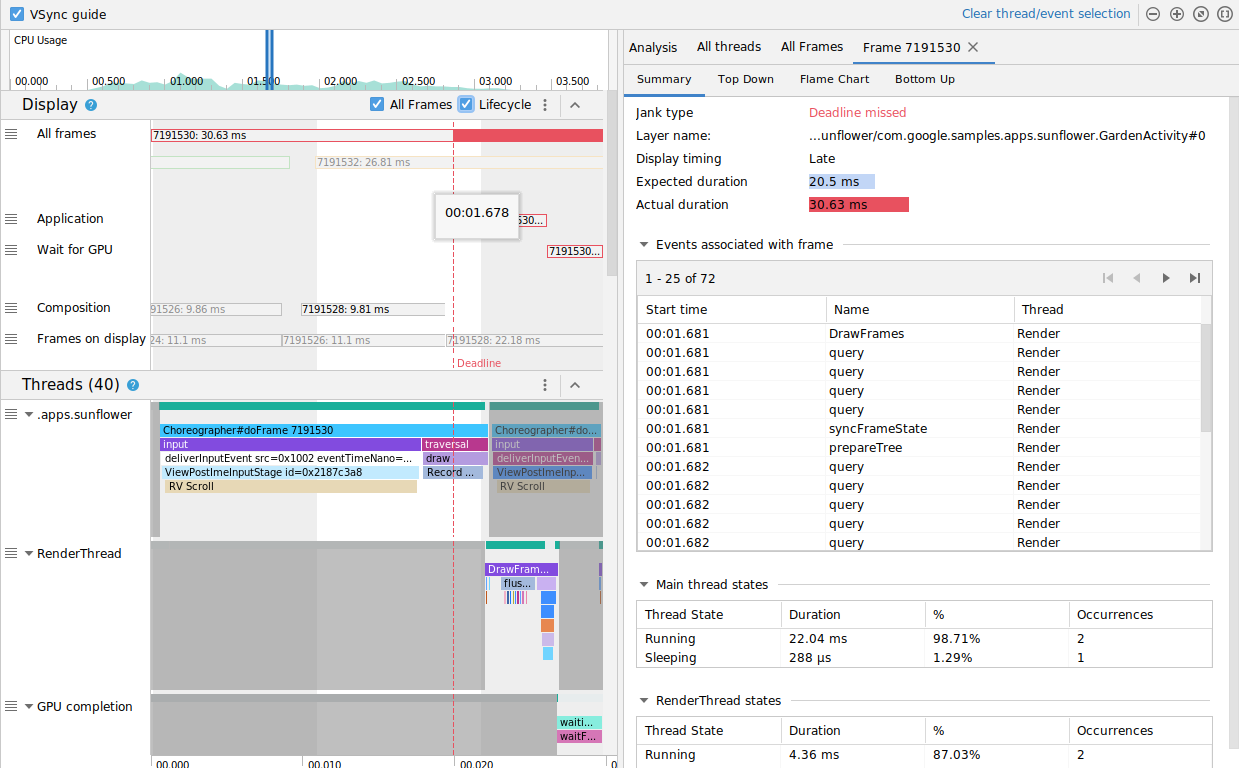
You can optionally see all frames or a breakdown of the rendering time by toggling the checkboxes All Frames and Lifecycle, respectively.
Detect jank on Android 11
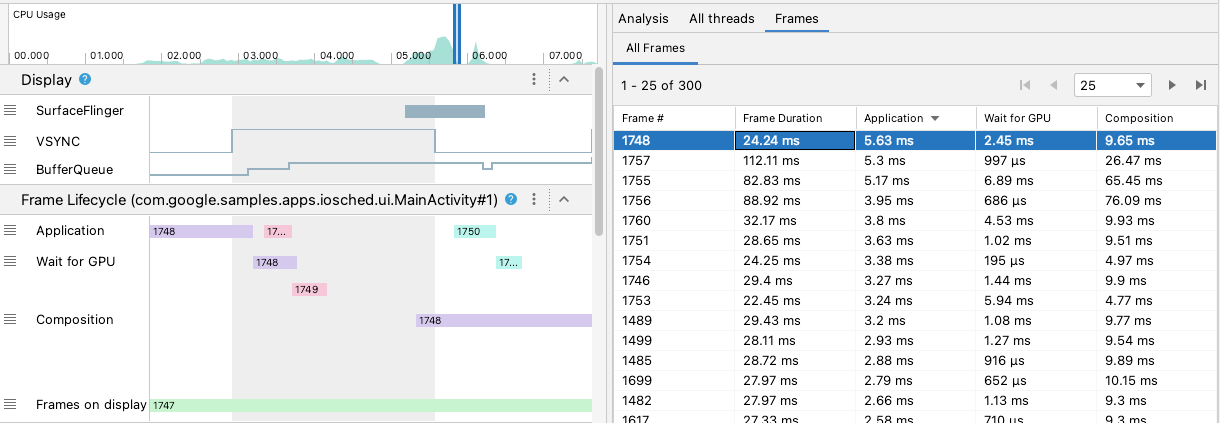
For devices using Android 11 (API level 30), a captured trace is shown in the Frame Lifecycle section in the CPU Profiler.
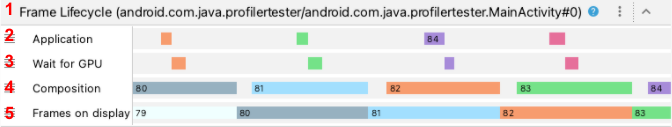
The Frame Lifecycle section contains the layer name and four tracks. Each track represents one stage in the frame rendering pipeline. The Frame Lifecycle elements are as follows:
- Frame Lifecycle (Layer name): The section title contains the layer name in parentheses. A layer is a single unit of composition.
- Application: This track shows the time from when the buffer was dequeued
by the app to when it was enqueued back. This usually corresponds to the
trace events in
RenderThread. - Wait for GPU: This track shows how long the buffer was owned by the GPU. This is the time from when the buffer is sent to the GPU to when the GPU finishes its work on the buffer. This does not indicate that the GPU was working only on this buffer during this time. For detailed info on what the GPU works on during a given time, you may want to use Android GPU Inspector.
- Composition: This track shows the time starting from when SurfaceFlinger latches on to the buffer and sends it for composition, to when the buffer is sent to the display.
- Frames on display: This track shows how long the frame was on the screen.
The Frame Lifecycle section illustrates how a frame buffer moves between different stages of the rendering pipeline. The frames are color coded by frame number so that it's easier to track a particular frame.
Android Studio also shows all frames in the trace in a table format in the All Frames tab.
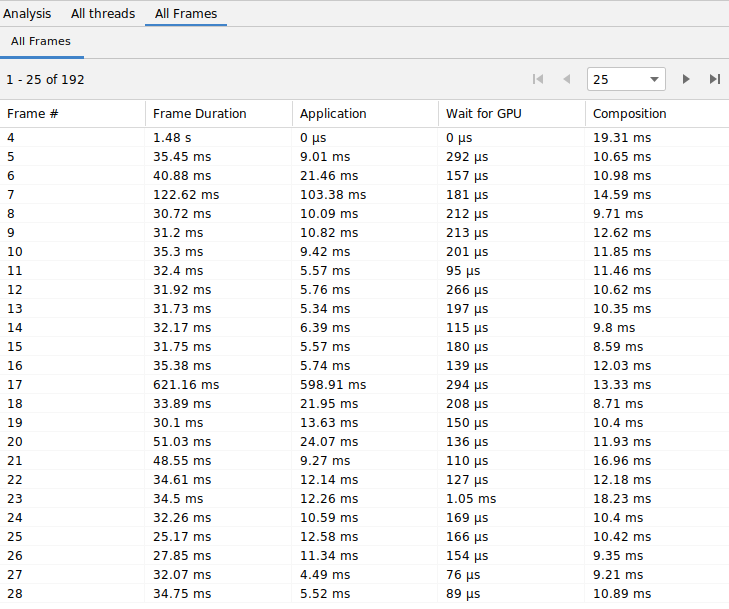
The Frame #, Application, Wait for GPU, and Composition columns represent the same data as the tracks in the Frame Lifecycle section as above. The column Frame Duration represents the time from the start of Application to the start of Frames on Display. This is essentially how long it takes to render a frame end-to-end.
You can sort the frames table by any column to quickly find the shortest or longest frame. The table also supports pagination controls that help you navigate through hundreds of frames.
To detect and investigate jank on Android 11, follow these steps:
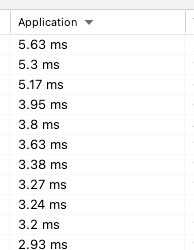
Sort the All Frames table by the Application column in descending order, so that the frames that take the longest appear first.
Find the longest running frames and select the table row. This zooms in on the selected frame in the timeline view to the left.
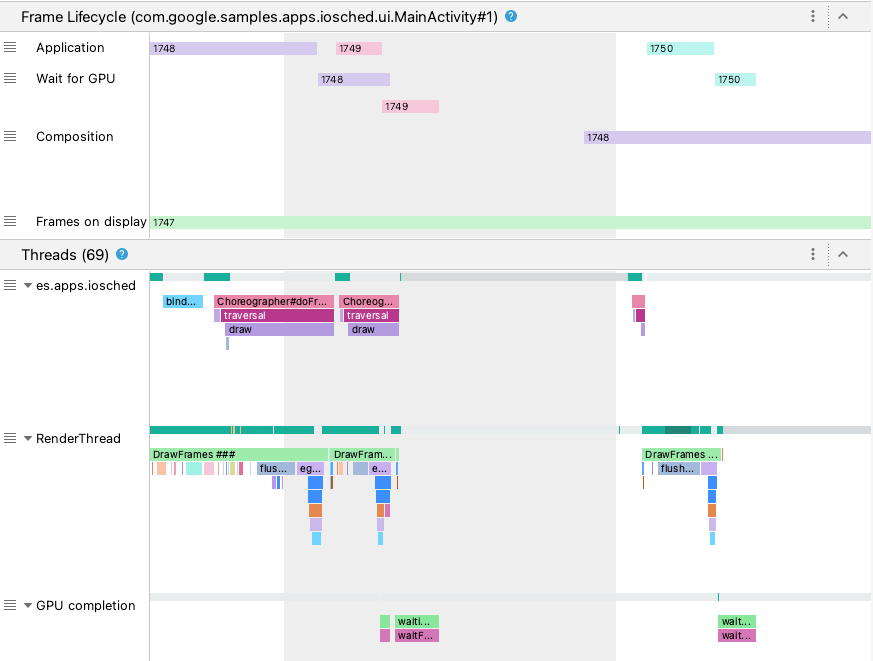
Look for relevant threads in the Frame Lifecycle and Threads sections.
Detect jank on Android 10 and lower
For devices using Android 10 (API level 29) and lower, relevant OS graphics pipeline information is displayed in a single section on the CPU Profiler system trace called Display.
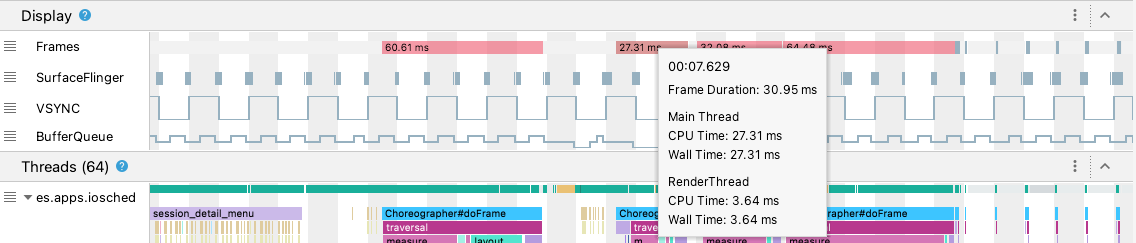
- Frames: This section shows the UI thread and
RenderThreadtrace events in your app. Events that are longer than 16ms are colored red to highlight potential janky frames because they exceed the deadline to render at 60 frames per second (fps). - SurfaceFlinger: This section shows when the SurfaceFlinger processes the frame buffers. SurfaceFlinger is a system process that is responsible for sending buffers to display.
- VSYNC: This section displays the VSYNC, a signal that synchronizes the display pipeline. The track displays the VSYNC-app signal, which shows when your app is starting too late. Typically, this occurs because the UI thread is busy. It causes a visible flicker to appear on your screen during an animation and adds extra input latency until the animation or scroll completes. This is especially important to view for high-refresh-rate displays, as they may occur more frequently than 60 times per second or at a variable rate.
- BufferQueue: This section shows how many frame buffers are queued up and
are waiting for SurfaceFlinger to consume. For apps deployed to devices
running Android 9 (API level 28) or higher, this track shows the buffer
count of the app's surface BufferQueue (
0,1, or2). BufferQueue can help you understand the state of image buffers as they move between the Android graphics components. For example, a value of2means that the app is currently triple-buffered, which results in extra input latency.
The Display section provides useful signals to detect potential jank—for
example, when the UI thread or RenderThread takes longer than 16 ms. To
investigate exact details of what caused the jank, you can probe the Threads
section, which shows the threads relevant to UI rendering.
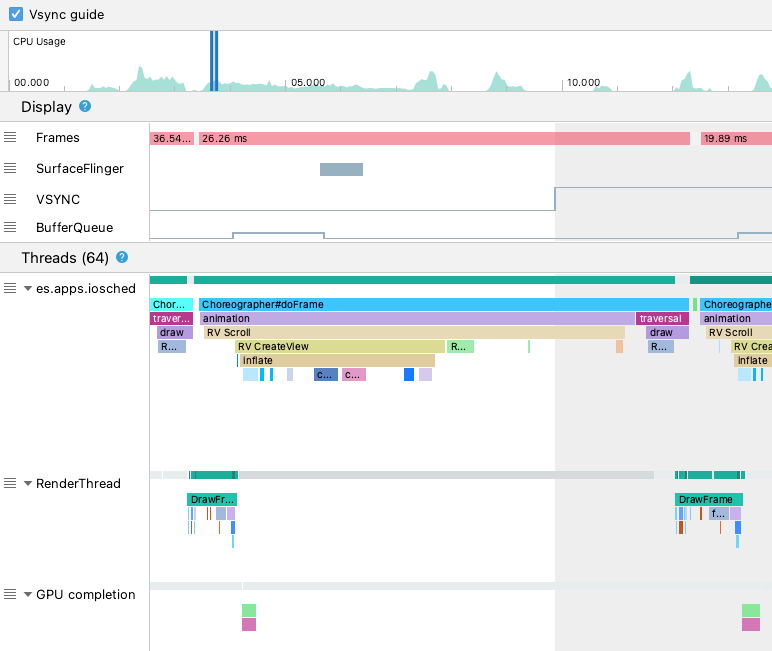
In the figure above, the Threads section shows the UI thread
(java.com.google.samples.apps.iosched), RenderThread, and the GPU
completion thread. These are the threads relevant to UI rendering and may
contribute to jank.
To detect jank on Android 10 or lower, follow these steps:
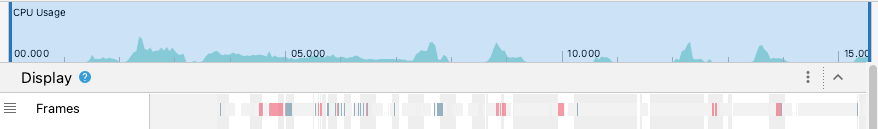
Look at the Frames track in Display. The red frames are candidates for investigation.
Once you find a potentially janky frame, zoom in by pressing
Wor scrolling the mouse wheel while holding Control (Command on macOS). Continue zooming in until you start to see the trace events in the UI thread andRenderThread.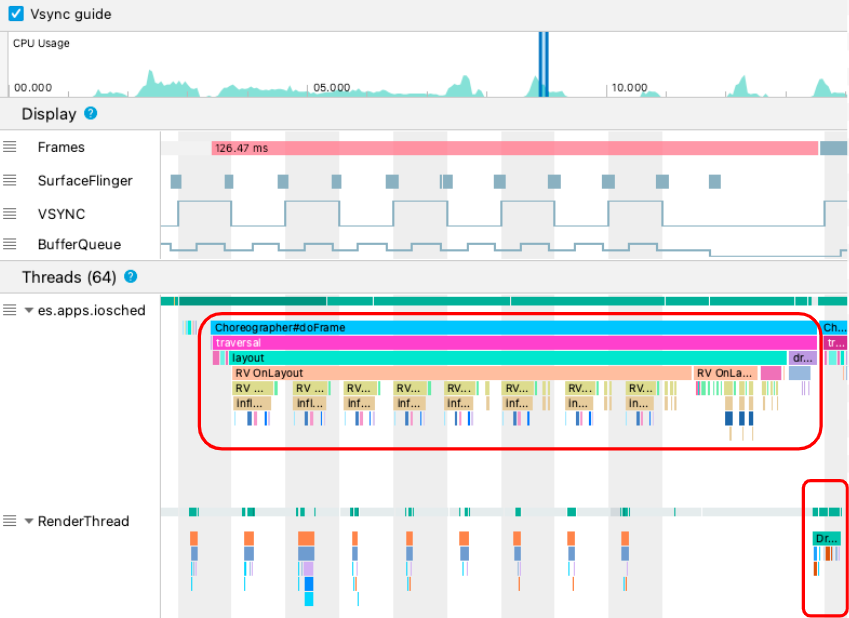
In the figure above,
Choreographer#doFrameshows when the UI thread callsChoreographerto coordinate animation, view layout, image drawing, and related processes.DrawFramesshows whenRenderThreadforms and issues actual drawing commands to the GPU.If you see a particularly long trace event on the main thread, zoom in to see which UI component or composable function is delaying the frame.
Advanced investigation with Perfetto
The Android Studio system trace profiling task is powered by Perfetto. If you are dealing with complex rendering issues and need custom SQL queries or advanced timeline navigation, you can take your trace analysis outside of the IDE.
Export your system trace from Android Studio by clicking the Export trace icon in the Profiler pane, then drag the resulting file into the web-based Perfetto UI. This provides a dedicated environment for system-level performance analysis. For information on how to interpret the details of the OS graphics pipeline, such as VSYNC, SurfaceFlinger, and the Frame Timeline tracks, see the official Perfetto documentation.
Learn more
To learn more about how to reduce jank, see Common sources of jank.