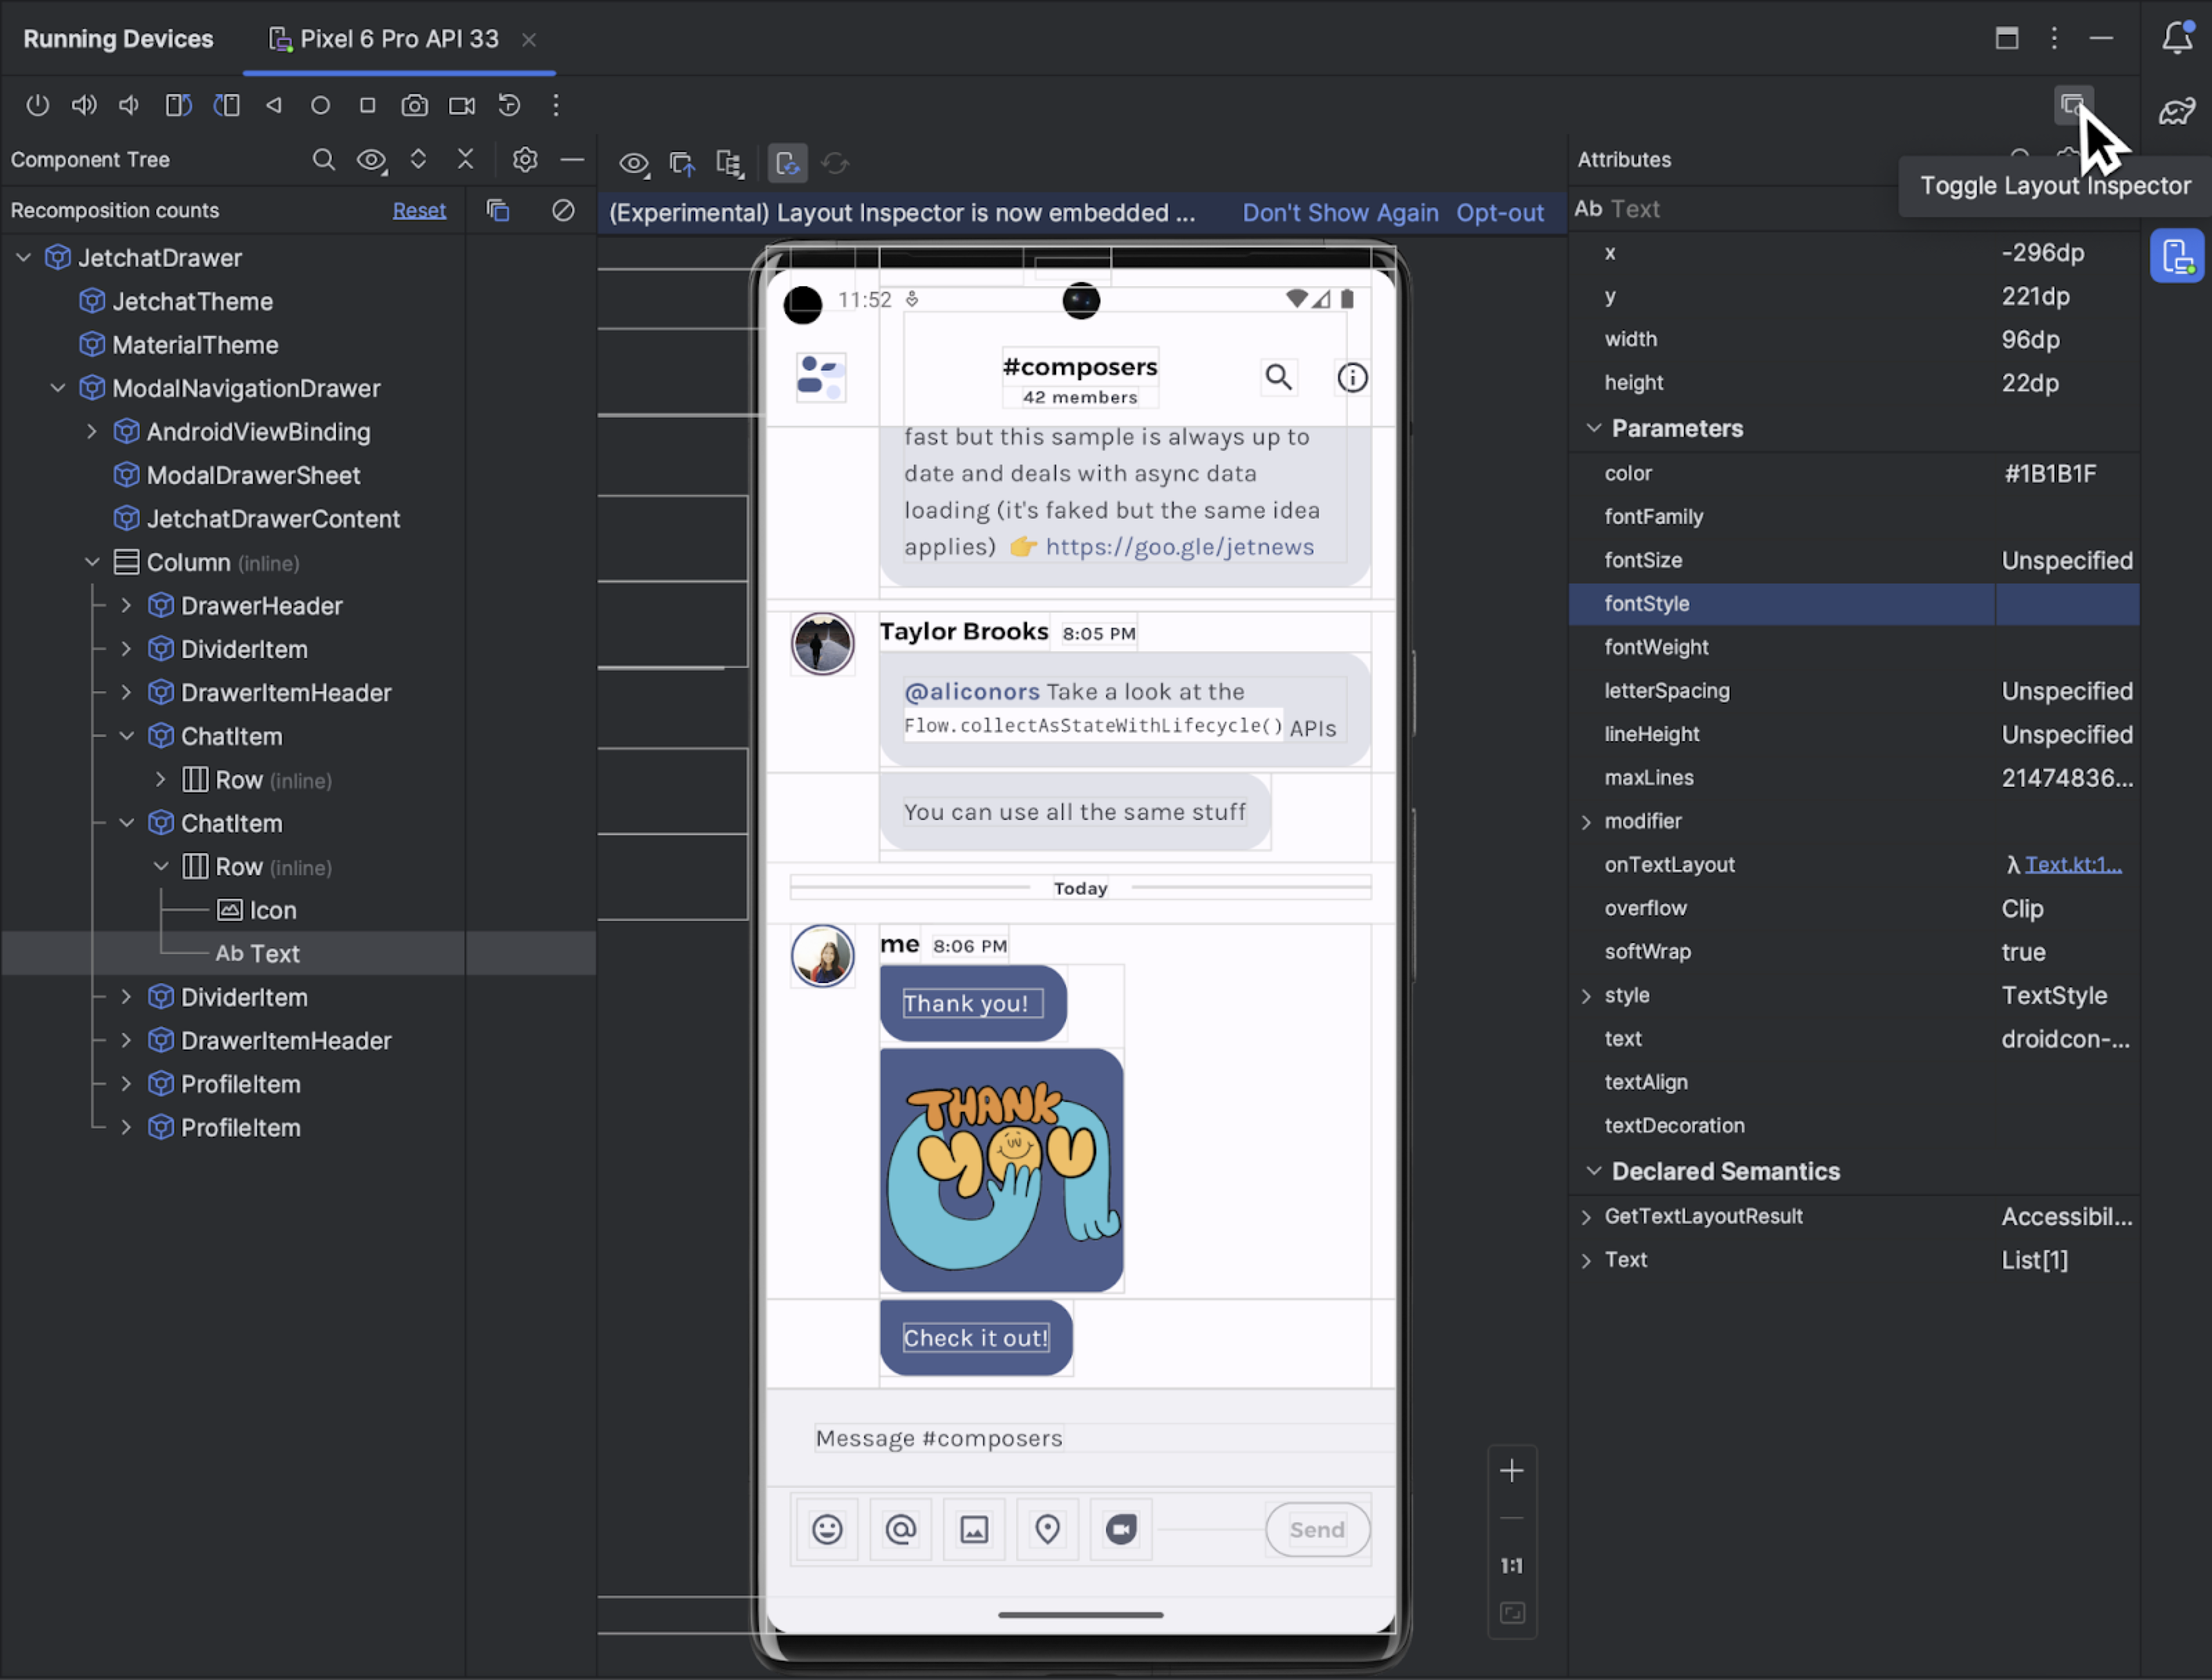
Debug your layout with Layout Inspector and Layout Validation

The Layout Inspector in Android Studio allows you to debug the layout of your app by showing a view hierarchy and allowing you to inspect the properties of each view. With the Layout Inspector, you can compare your app layout with design mockups, display a magnified or 3D view of your app, and examine details of its layout at runtime. This is especially useful when your layout is built at runtime rather than entirely in XML and the layout is behaving unexpectedly.

Layout Validation allows you to simultaneously preview layouts on different devices and display configurations, including variable font sizes or user languages, making it easy to test for a variety of common layout problems.

To open the Layout Inspector, run your app on a connected device or emulator, and then select Tools > Layout Inspector. If you switch among multiple devices or projects, the Layout Inspector automatically connects to the debuggable processes running in the foreground of the connected device.

Layout inspector snapshot for the Sunflower sample app

Figure 1. Layout Inspector snapshot for the Sunflower sample app. The Layout Inspector displays the following from left to right: Component Tree, Layout Display, and Attributes.

  • Component Tree: The hierarchy of views in the layout.
  • Layout Display: Rendering of the app's layout as it appears on your device or emulator, with layout bounds shown for each view.
  • Attributes: The layout attributes for the selected view. Layout Inspector requires an activity restart to access the attributes. For more information, see Activity restart.

To learn about the Layout Editor, see Introduction to the Layout Editor.

Embedded Layout Inspector (experimental)

Starting in Android Studio Hedgehog, you can run the Layout Inspector directly in the Running Devices tool window. This experimental feature significantly improves performance of Layout Inspector, conserves screen real estate, and helps organize your UI debugging workflow in a single tool window. To enable embedded mode:

  • On Windows, go to File > Settings > Experimental > Layout Inspector
  • On macOS, go to Android Studio > Settings > Experimental > Layout Inspector

Here's how to get started and do some common tasks:

  • To start the Layout Inspector, go to the Running Devices window and click Toggle Layout Inspector Toggle embedded layout inspector button.
  • To view hierarchy and inspect the properties of each view, use Component Tree and Attribute Panel tool window.
  • To select views by single clicking directly on the views or navigate to code by double clicking on the views, enable Toggle Deep Inspect Toggle deep inspect button.
  • To interact with the app, disable Toggle Deep Inspect Toggle deep inspect button.
  • To inspect physical devices, enable device mirroring.
  • To use 3D mode, take a Layout Inspector Snapshot Layout Inspector Snapshot.

Embedded Layout Inspector

Figure 2. Embedded Layout Inspector for Jetchat app

Live Updates

The Layout Display renders your app's layout as it appears on your device or emulator, with layout bounds shown for each view. You can click on each component to inspect it.

The Live Layout Inspector provides complete, real-time insights into your app’s UI while it’s deployed to a device or emulator running API level 29 or higher.

To enable the Live Layout Inspector, select the Live Updates option from the Layout Inspector toolbar.

The Live Layout Inspector includes a dynamic layout hierarchy, updating the Component Tree and Layout Display as views on the device change.

Select or isolate a view

A view usually draws something the user can see and interact with. The Component Tree shows your app's hierarchy in real time with each view component, which helps you debug your app's layout because you can visualize the elements within your app and the values associated with them.

To select a view, click it in the Component Tree or the Layout Display. All of the layout attributes for the selected view appear in the Attributes panel.

If your layout includes overlapping views, you can select a view that is not in front by clicking it in the Component Tree or by rotating the layout.

To work with complex layouts, you can isolate individual views so that only a subset of the layout is shown in the Component Tree and rendered in the Layout Display.

Isolate view menu

Figure 3. To isolate a view, right-click the view in the Component Tree and select Show Only Subtree or Show Only Parents.

To return to the full view, right-click the view and select Show All.

Hide layout borders and view labels

To hide the bounding box or view labels for a layout element, click View Options View Options button at the top of the Layout Display and toggle Show Borders or Show View Label.

View options drop down menu

Figure 4. To hide layout borders and view labels, click on the second View Options in the Layout Inspector toolbar.

3D mode

The Layout Display features an advanced 3D visualization of your app’s view hierarchy at runtime. To use this feature, in the Live Layout Inspector window, click on the 3D Mode button 3D button and rotate it by dragging the mouse.

Layout Inspector: 3D view

Figure 5. Rotated 3D view of a Layout.

Layout inspector: layer spacing view

Figure 6. To expand or contract the layers of the Layout, use the Layer Spacing slider.

Compare app layout to a reference image overlay

To compare your app layout with a reference image, such as a UI mockup, you can load a bitmap image overlay in the Layout Inspector.

  • To load an overlay, select the Load Overlay option from the Layout Inspector toolbar. The overlay is scaled to fit the layout.
  • To adjust the transparency of the overlay, use the Overlay Alpha slider.
  • To remove the overlay, click Clear Overlay .

Capture layout hierarchy snapshots

Layout Inspector allows you to save snapshots of your running app’s layout hierarchy, so that you can easily share them with others or refer to them later.

Snapshots capture the data you would typically see when using the Layout Inspector, including a detailed 3D rendering of your layout, the component tree of your View, Compose, or hybrid layout, and detailed attributes for each component of your UI. To save a snapshot, do the following:

  1. Open the layout inspector.
  2. The Layout Inspector should connect to your app process automatically. If not, select the app process from the dropdown menu.
  3. When you want to capture a snapshot, click Export snapshot Export
icon from the Layout Inspector toolbar.
  4. In the system dialog that appears, specify the name and location you want to save your snapshot. Make sure to save the file with a *.li extension.

You can then load a Layout Inspector snapshot by selecting File > Open from the main menu bar, and opening a *.li file.

Layout Inspector snapshot gif

Figure 7. Taking a snapshot in the Layout Inspector.

Inspect Compose

Layout Inspector lets you inspect a Compose layout inside a running app in an emulator or physical device. You can use the Layout Inspector to check how often a composable is recomposed or skipped, which can help identify issues with your app. For example, some coding errors might force your UI to recompose excessively, which can cause poor performance. Some coding errors can prevent your UI from recomposing and, therefore, preventing your UI changes from showing up on the screen.

Learn more about Layout Inspector for Compose

Avoiding activity restarts

Layout Inspector requires one of the following global settings to function properly. If you don't specify a global setting, Layout Inspector automatically sets one.

  1. adb shell settings put global debug_view_attributes_application_package <processname>

    This option generates extra information for inspection of the specified process.

  2. adb shell settings put global debug_view_attributes 1

    This option generates extra information for inspection on all of the processes on the device.

Changing a global setting may cause an activity restart. To avoid an activity restart, you can either change the settings in Android Studio or change the Developer Options in your device's settings.

To enable automatic refresh in Android Studio, open the Run/Debug Configurations by selecting Run > Edit Configurations from the menu. Then, navigate to the Miscellaneous tab and check the Connect to Layout Inspector without restarting activity box under Layout Inspector Options.

Activity restart option in Run configurations

Figure 12. Enable automatic refresh from the Run/Debug Configurations.

Alternatively, enable your device's developer options, and then turn on Enable view attribute inspection from the device's developer settings.

Layout Validation

Layout Validation is a visual tool for simultaneously previewing layouts for different devices and display configurations, helping you catch problems in your layouts earlier in the process. To access this feature, click on the Layout Validation tab in the top-right corner of the IDE window:

Screenshot of Layout Validation tab

Figure 13. Layout Validation tab.

To switch between the available configuration sets, select one of the following from the Reference Devices dropdown at the top of the Layout Validation window:

  • Reference Devices
  • Custom
  • Color Blind
  • Font Sizes

Screenshot of dropdown menu in the Layout Validation tool

Figure 14. Reference Devices dropdown menu option.

Reference Devices

Reference devices are a set of devices that we recommend you test against. They include phone, foldable, tablet, and desktop interfaces. You should preview how your layout appears on this set of reference devices:

Screenshot of layout previews for different reference devices

Figure 15. Reference device previews in the Layout Validation tool.

Custom

To customize a display configuration to preview, choose from a variety of settings including language, device, or screen orientation:

Customize a device display in the Layout Validation tool

Figure 16. Configure a custom display in the Layout Validation tool.

Color Blind

To help make your app more accessible for users who are color blind, validate your layout with simulations of common types of color blindness:

Screenshot of simulation previews for different types of color blindness

Figure 17. Color blindness simulation previews in the Layout Validation tool.

Font Sizes

Validate your layouts at various font sizes, and improve your app's accessibility for visually impaired users by testing your layouts with larger fonts:

Previews of app layouts at different font sizes with visible layout errors for large fonts

Figure 18. Variable font size previews in the Layout Validation tool.