ऐप्लिकेशन की परफ़ॉर्मेंस का आकलन करना
संग्रह की मदद से व्यवस्थित रहें
अपनी प्राथमिकताओं के आधार पर, कॉन्टेंट को सेव करें और कैटगरी में बांटें.
Android Studio Profiler के स्टैंडअलोन वर्शन का इस्तेमाल करके, अपने ऐप्लिकेशन की परफ़ॉर्मेंस का आकलन किया जा सकता है. प्रोफ़ाइलर शुरू करने के लिए, यह तरीका अपनाएं:
डीबगर चलाएं.
Visual Studio टूलबार में, प्रोफ़ाइलर बटन पर क्लिक करें.
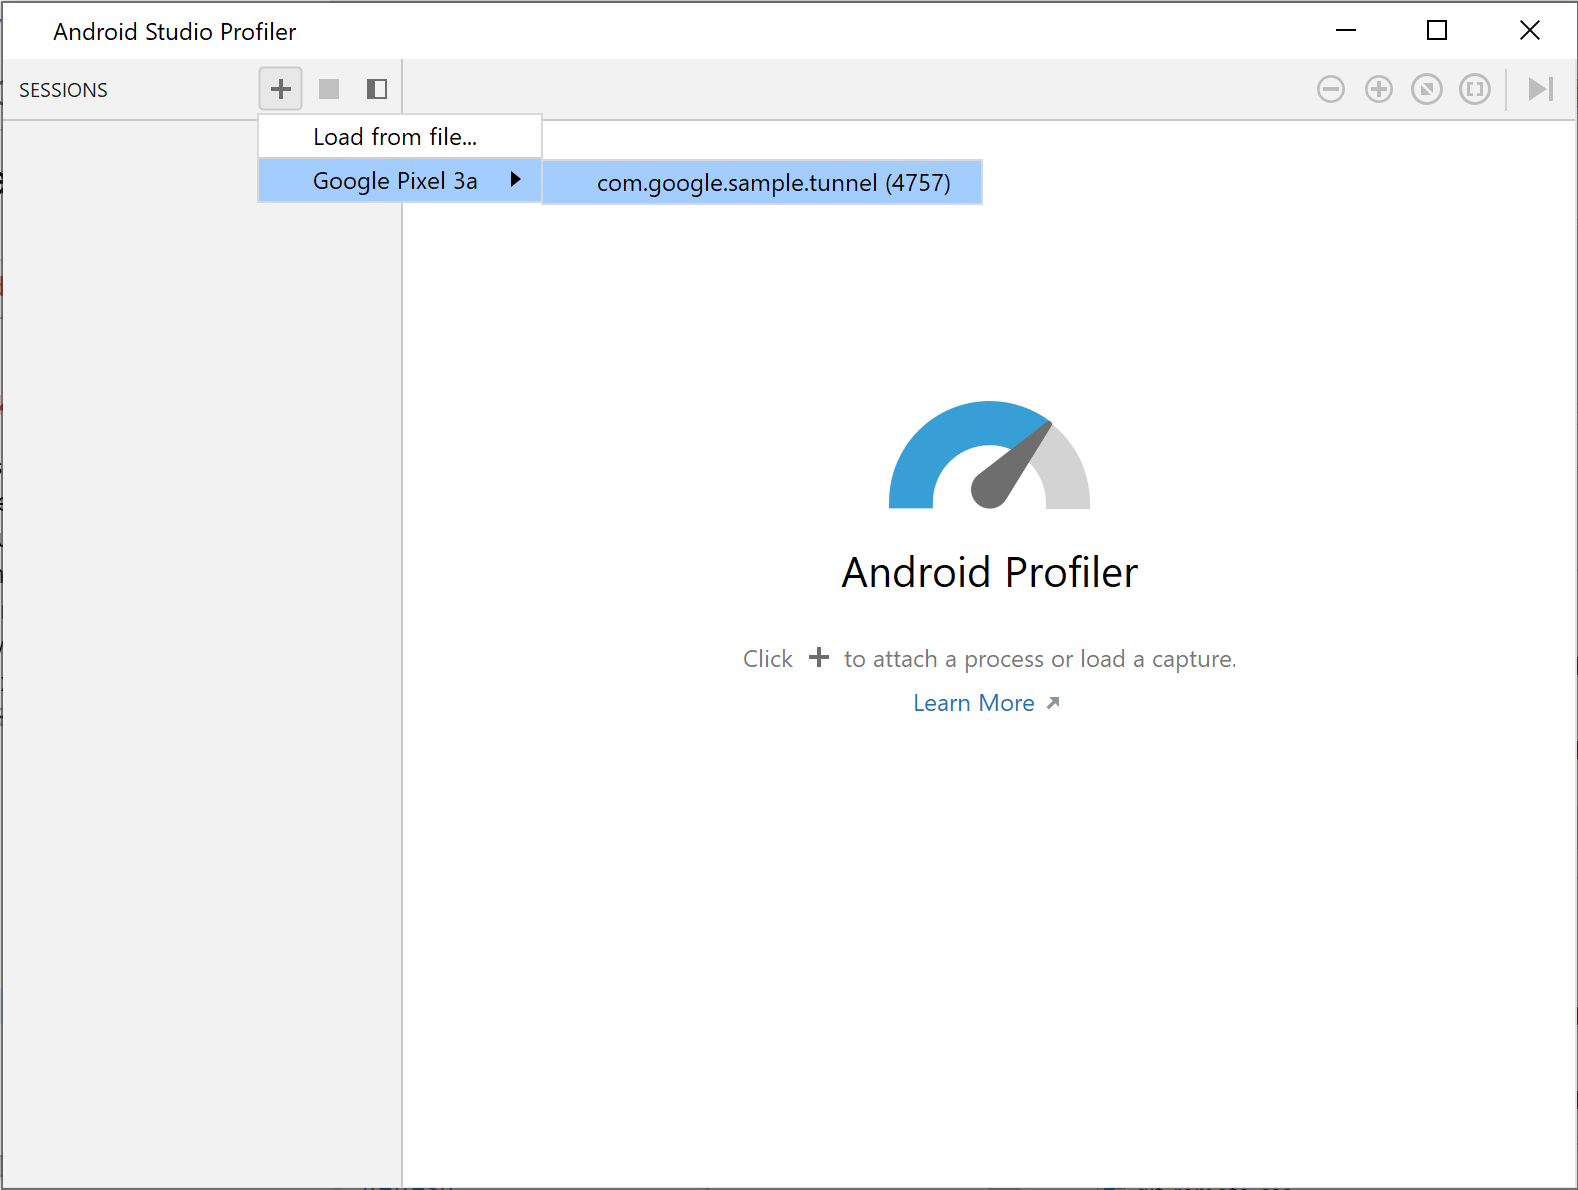
सेशन के बगल में मौजूद, + बटन पर क्लिक करें. इसके बाद, डीबग की जा सकने वाली प्रोसेस चुनें.
पहली इमेज
1. प्रोफ़ाइलर में कोई प्रोसेस चुनें
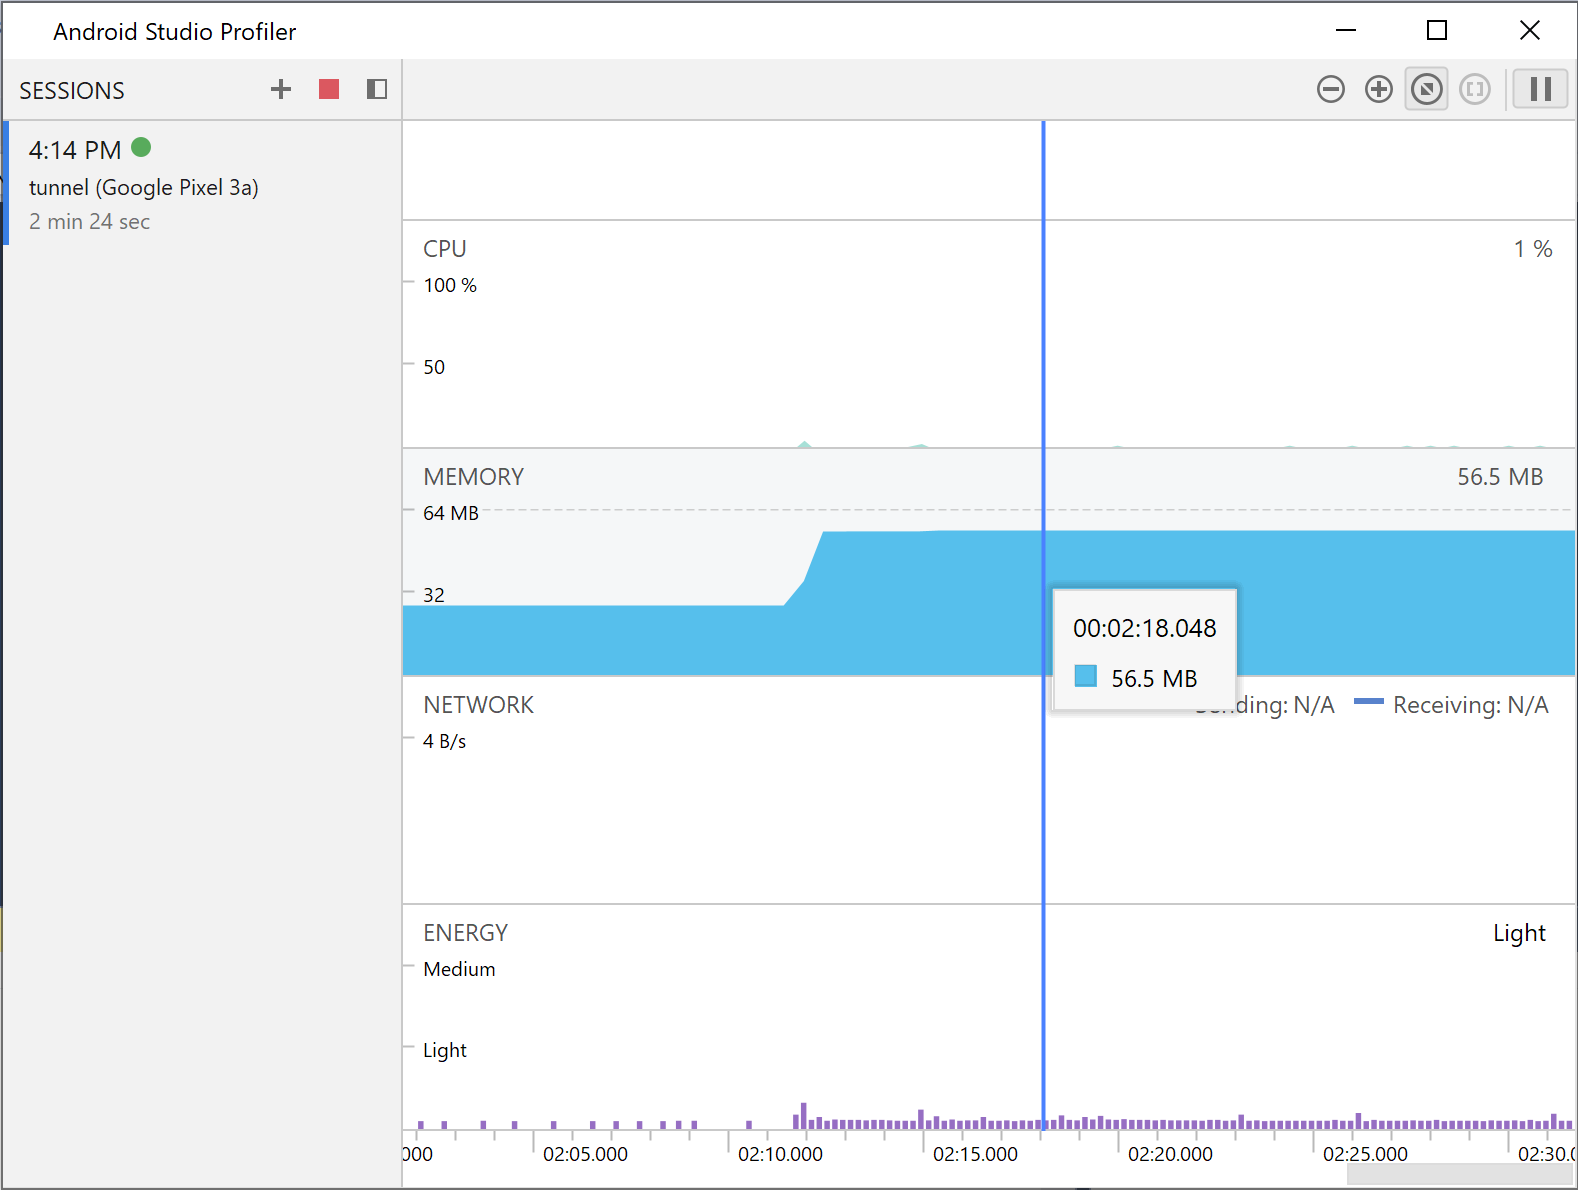
प्रोफ़ाइलर, इन कैटगरी के लिए इस्तेमाल के आंकड़े रीयल टाइम में दिखाता है:
सीपीयू, मेमोरी, नेटवर्क, और ऊर्जा.
दूसरी इमेज
2. कभी न खत्म होने वाले टनल वाले ऐप्लिकेशन के सैंपल के लिए, प्रोफ़ाइलर के आंकड़े
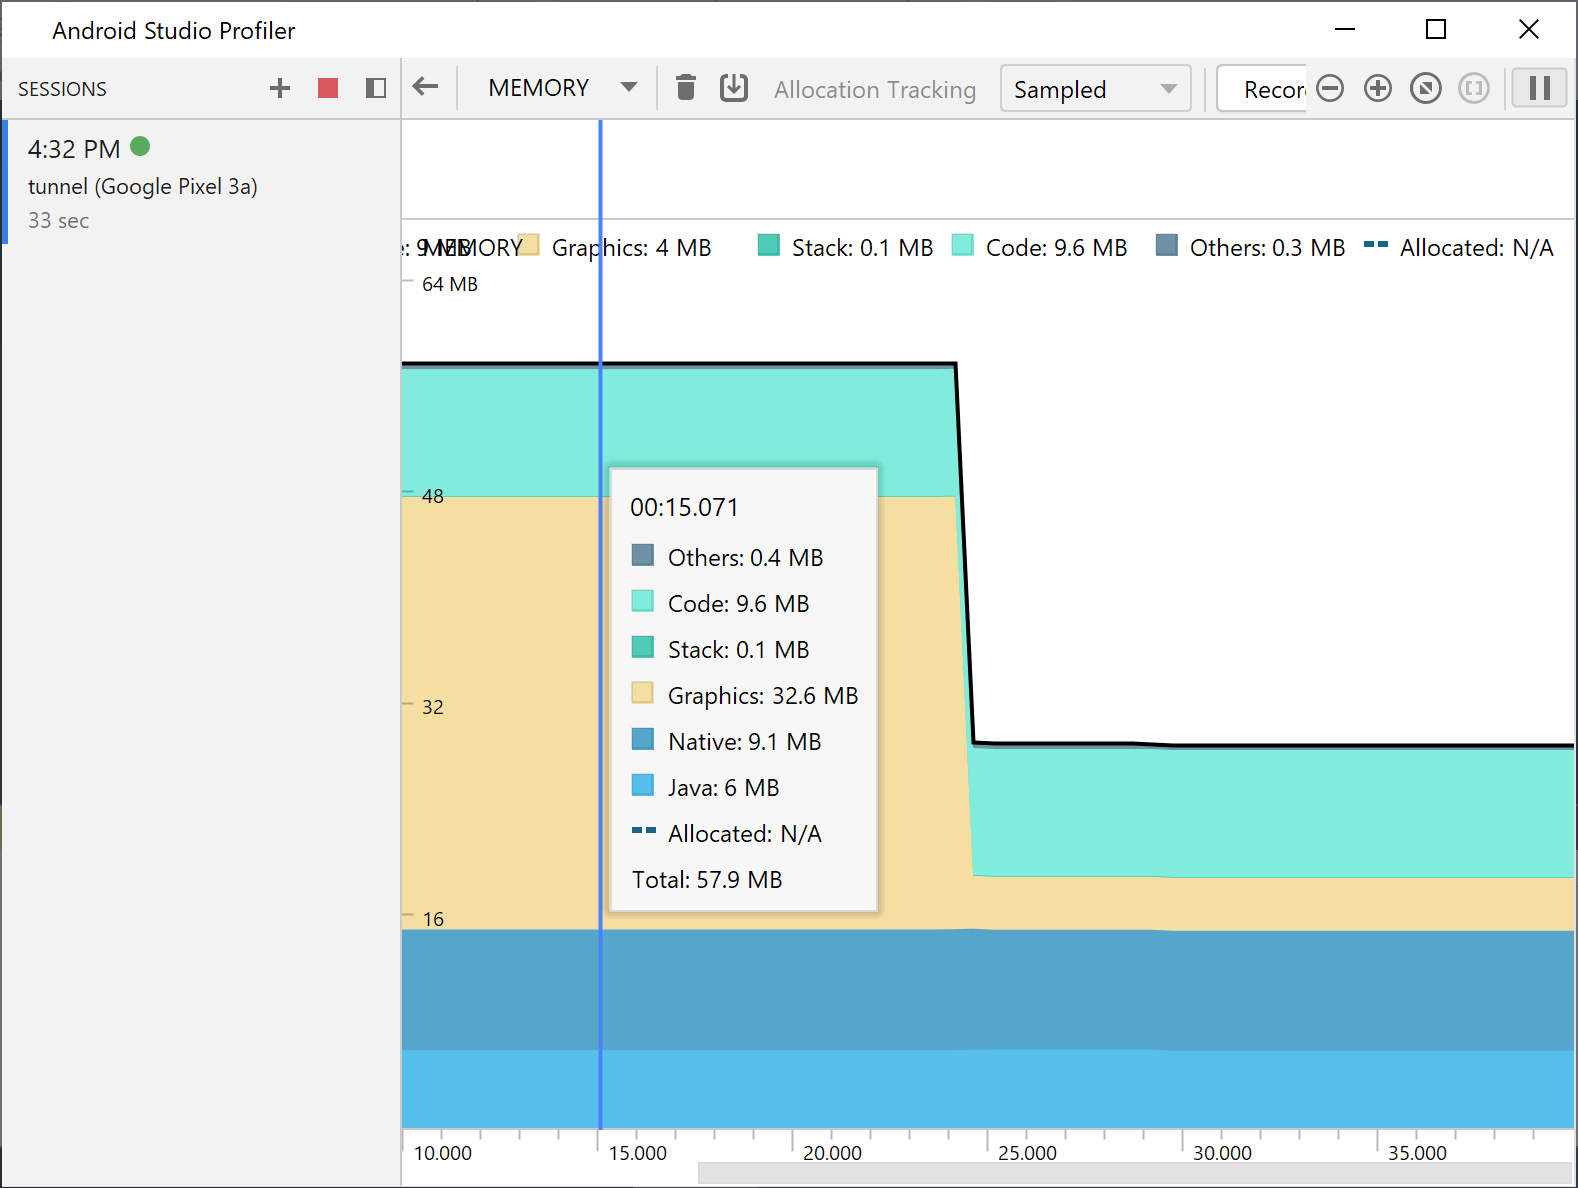
किसी कैटगरी के बारे में ज़्यादा जानने के लिए, उस कैटगरी के ग्राफ़ पर क्लिक करें.
इस पेज पर मौजूद कॉन्टेंट और कोड सैंपल कॉन्टेंट के लाइसेंस में बताए गए लाइसेंस के हिसाब से हैं. Java और OpenJDK, Oracle और/या इससे जुड़ी हुई कंपनियों के ट्रेडमार्क या रजिस्टर किए हुए ट्रेडमार्क हैं.
आखिरी बार 2025-07-27 (UTC) को अपडेट किया गया.
[[["समझने में आसान है","easyToUnderstand","thumb-up"],["मेरी समस्या हल हो गई","solvedMyProblem","thumb-up"],["अन्य","otherUp","thumb-up"]],[["वह जानकारी मौजूद नहीं है जो मुझे चाहिए","missingTheInformationINeed","thumb-down"],["बहुत मुश्किल है / बहुत सारे चरण हैं","tooComplicatedTooManySteps","thumb-down"],["पुराना","outOfDate","thumb-down"],["अनुवाद से जुड़ी समस्या","translationIssue","thumb-down"],["सैंपल / कोड से जुड़ी समस्या","samplesCodeIssue","thumb-down"],["अन्य","otherDown","thumb-down"]],["आखिरी बार 2025-07-27 (UTC) को अपडेट किया गया."],[],[]]

 बटन पर क्लिक करें.