이 페이지에 나와 있는 콘텐츠와 코드 샘플에는 콘텐츠 라이선스에서 설명하는 라이선스가 적용됩니다. 자바 및 OpenJDK는 Oracle 및 Oracle 계열사의 상표 또는 등록 상표입니다.
최종 업데이트: 2025-07-27(UTC)
[[["이해하기 쉬움","easyToUnderstand","thumb-up"],["문제가 해결됨","solvedMyProblem","thumb-up"],["기타","otherUp","thumb-up"]],[["필요한 정보가 없음","missingTheInformationINeed","thumb-down"],["너무 복잡함/단계 수가 너무 많음","tooComplicatedTooManySteps","thumb-down"],["오래됨","outOfDate","thumb-down"],["번역 문제","translationIssue","thumb-down"],["샘플/코드 문제","samplesCodeIssue","thumb-down"],["기타","otherDown","thumb-down"]],["최종 업데이트: 2025-07-27(UTC)"],[],[]]

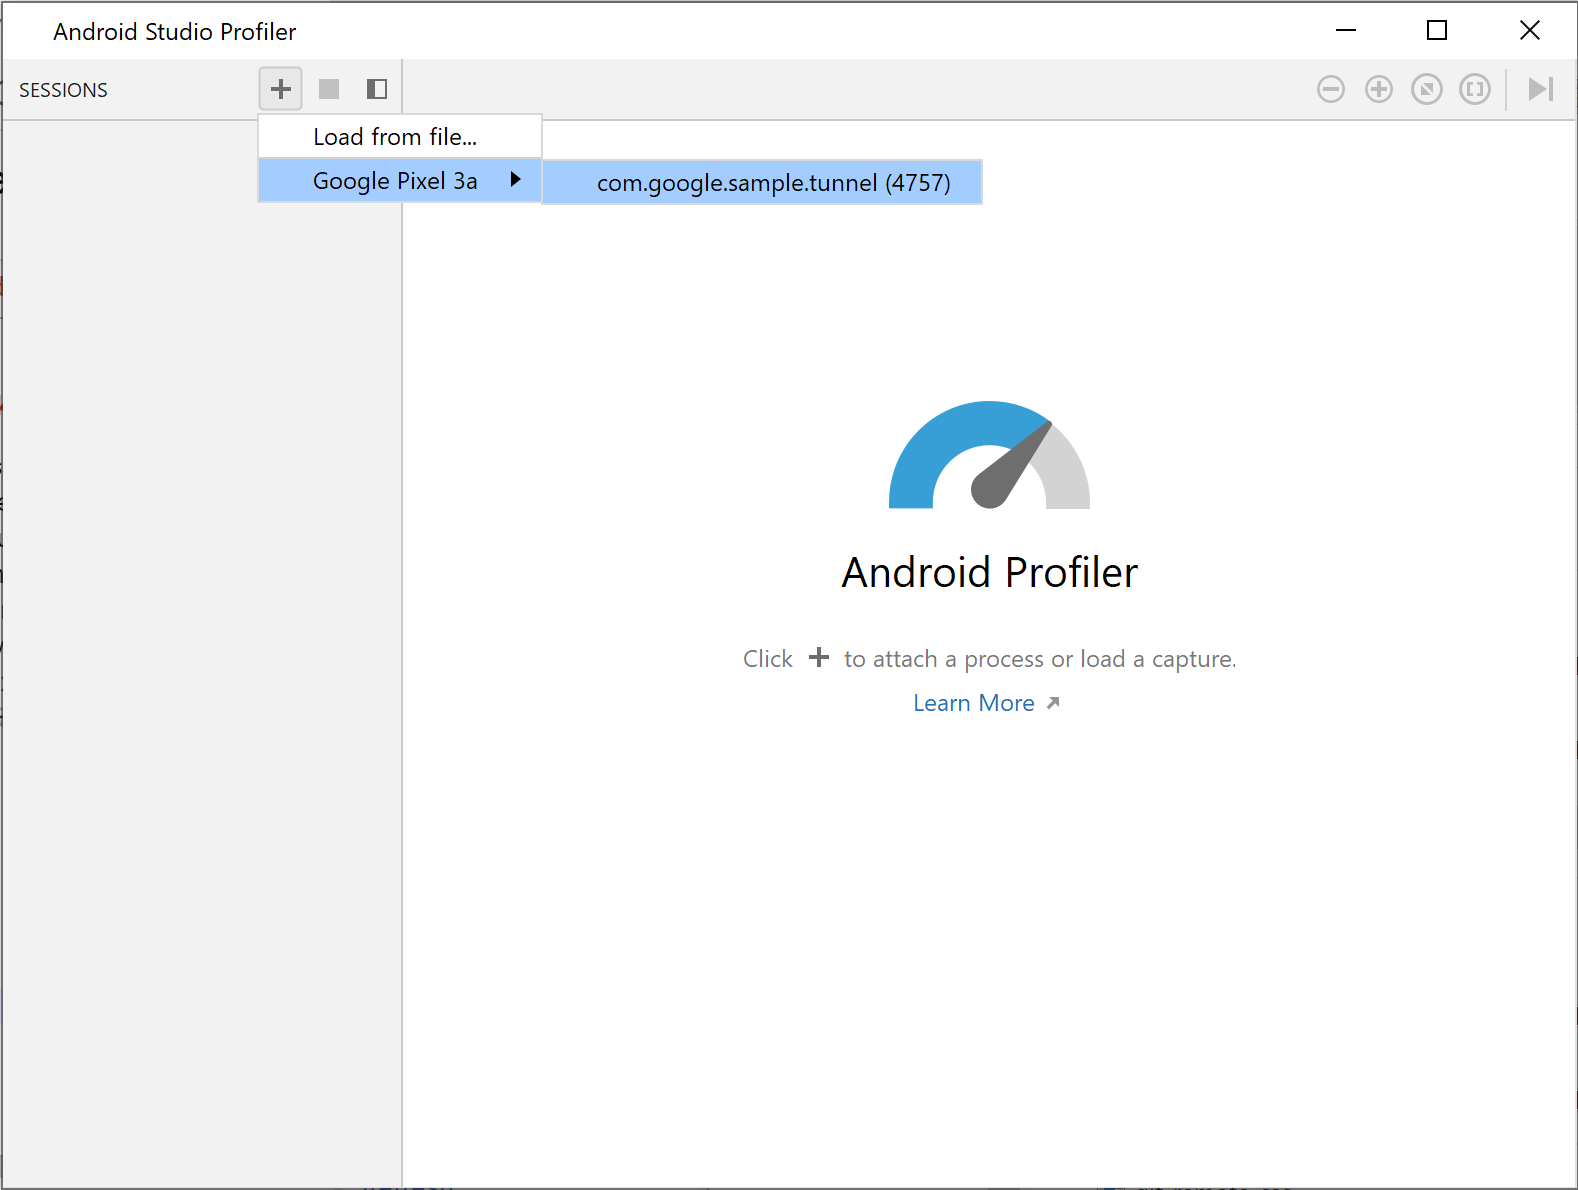
 버튼을 클릭합니다.