アプリのパフォーマンスを測定する
コレクションでコンテンツを整理
必要に応じて、コンテンツの保存と分類を行います。
Android Studio Profiler のスタンドアロン バージョンを使用して、アプリのパフォーマンスを測定できます。プロファイラを起動する手順は次のとおりです。
- デバッガを実行します。
- Visual Studio ツールバーのプロファイラ ボタン
 をクリックします。
[SESSIONS] の横にある「+」ボタンをクリックし、デバッグ可能なプロセスを選択します。
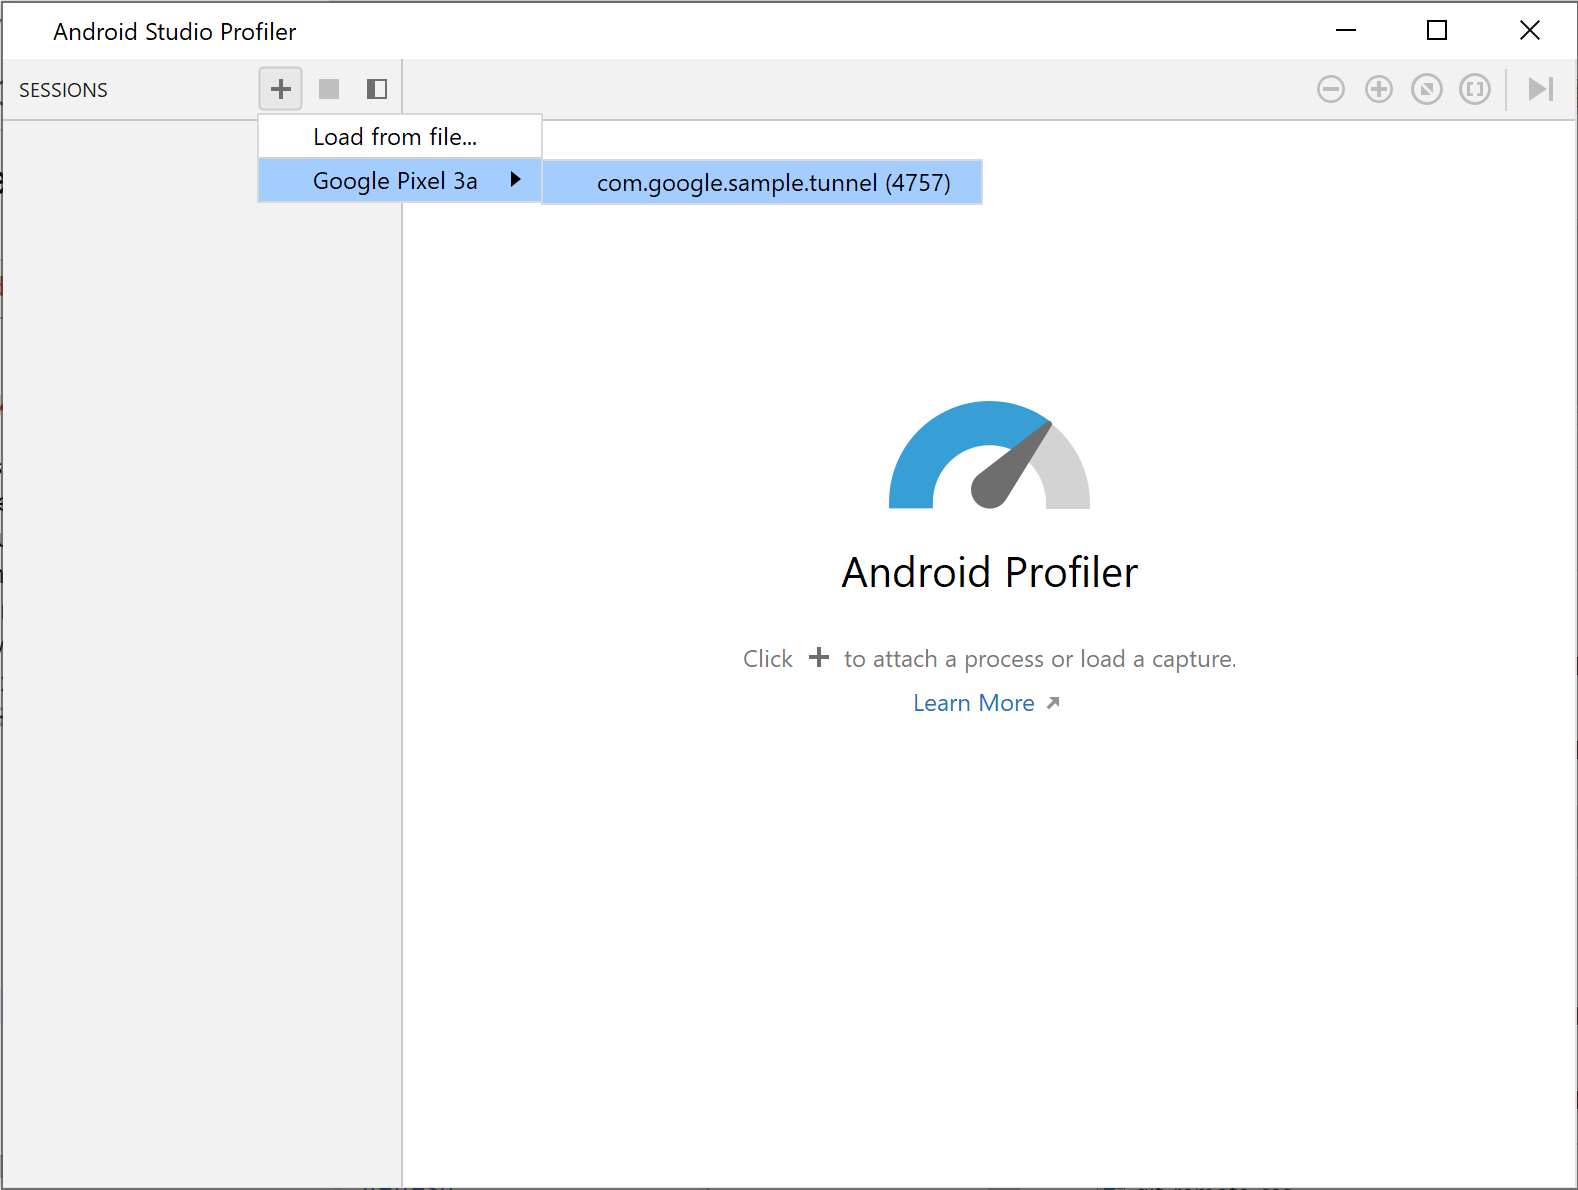
図 1. プロファイラでプロセスを選択する
プロファイラには、CPU、メモリ、ネットワーク、エネルギーのカテゴリに関する使用統計情報がリアルタイムで表示されます。
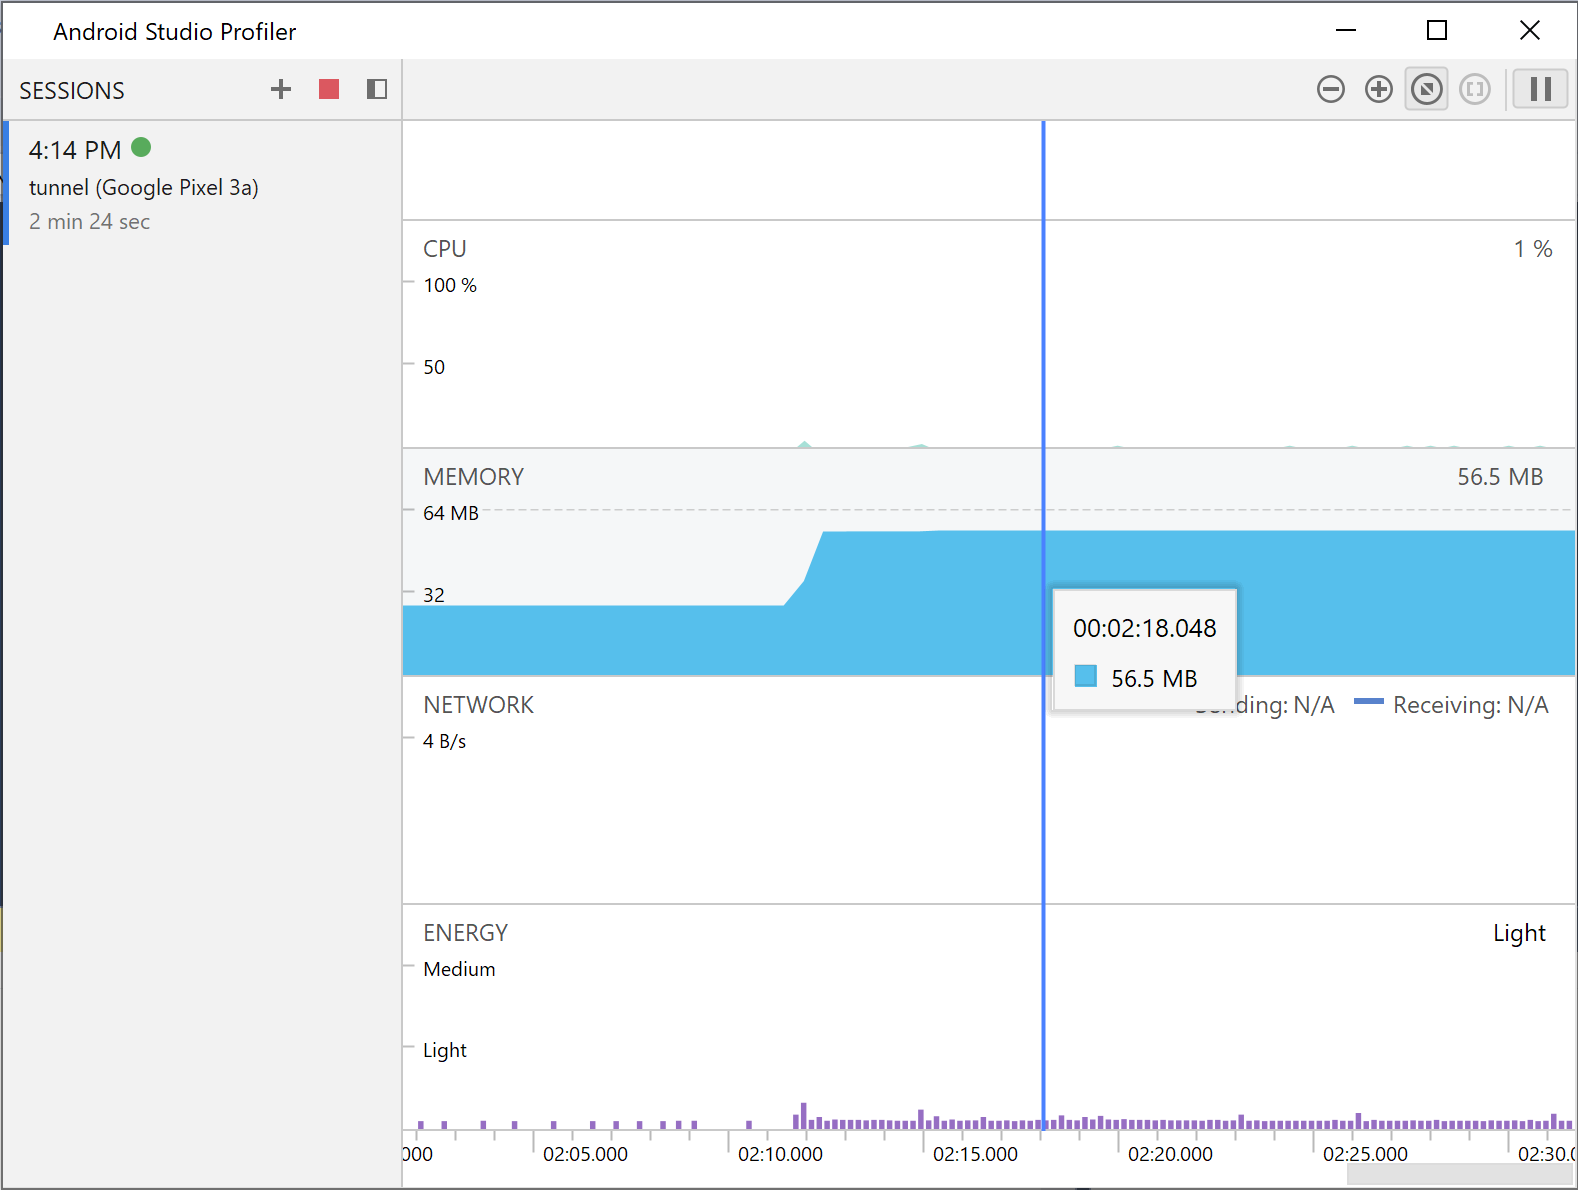
図 2. サンプルのエンドレス トンネル アプリのプロファイラ統計情報
特定のカテゴリの詳細を確認するには、そのカテゴリのグラフをクリックします。
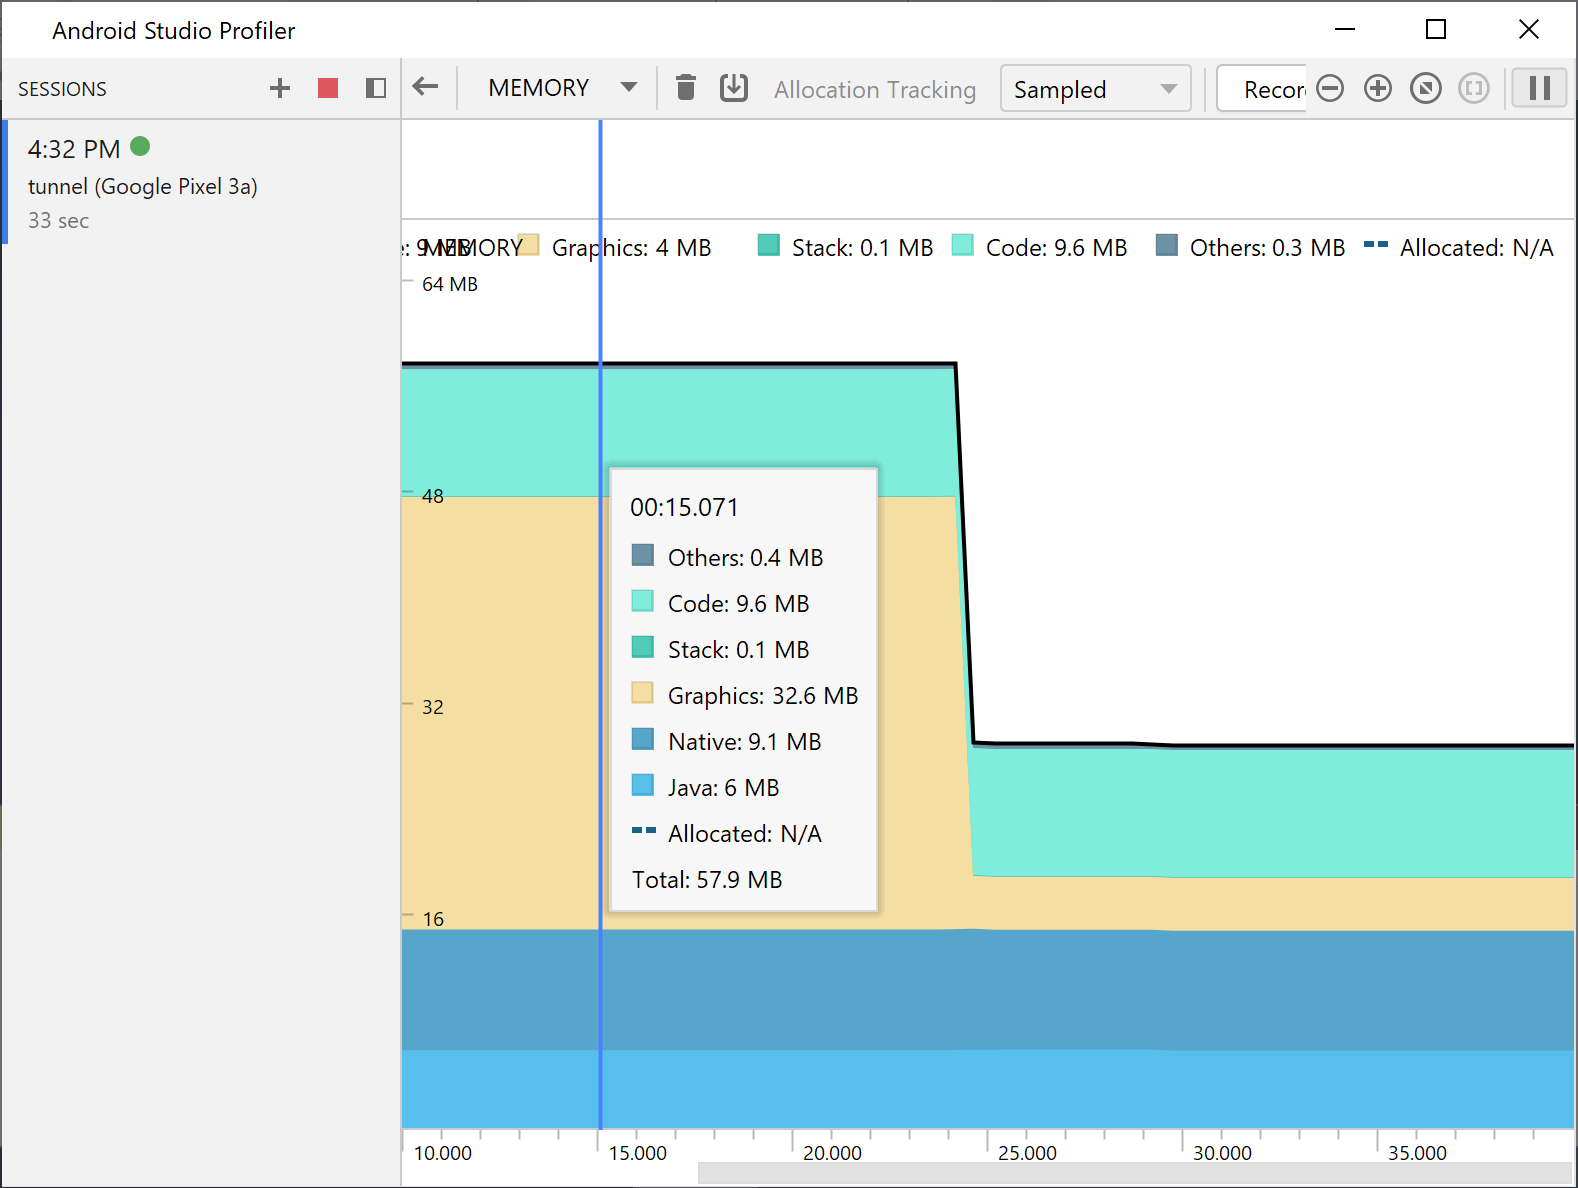
図 3. 詳細なメモリ統計情報
プロファイラの使用方法について詳しくは、Android Studio Profiler のドキュメントをご覧ください。
このページのコンテンツやコードサンプルは、コンテンツ ライセンスに記載のライセンスに従います。Java および OpenJDK は Oracle および関連会社の商標または登録商標です。
最終更新日 2025-07-27 UTC。
[[["わかりやすい","easyToUnderstand","thumb-up"],["問題の解決に役立った","solvedMyProblem","thumb-up"],["その他","otherUp","thumb-up"]],[["必要な情報がない","missingTheInformationINeed","thumb-down"],["複雑すぎる / 手順が多すぎる","tooComplicatedTooManySteps","thumb-down"],["最新ではない","outOfDate","thumb-down"],["翻訳に関する問題","translationIssue","thumb-down"],["サンプル / コードに問題がある","samplesCodeIssue","thumb-down"],["その他","otherDown","thumb-down"]],["最終更新日 2025-07-27 UTC。"],[],[]]
