অ্যাপের কর্মক্ষমতা পরিমাপ করুন
সেভ করা পৃষ্ঠা গুছিয়ে রাখতে 'সংগ্রহ' ব্যবহার করুন
আপনার পছন্দ অনুযায়ী কন্টেন্ট সেভ করুন ও সঠিক বিভাগে রাখুন।
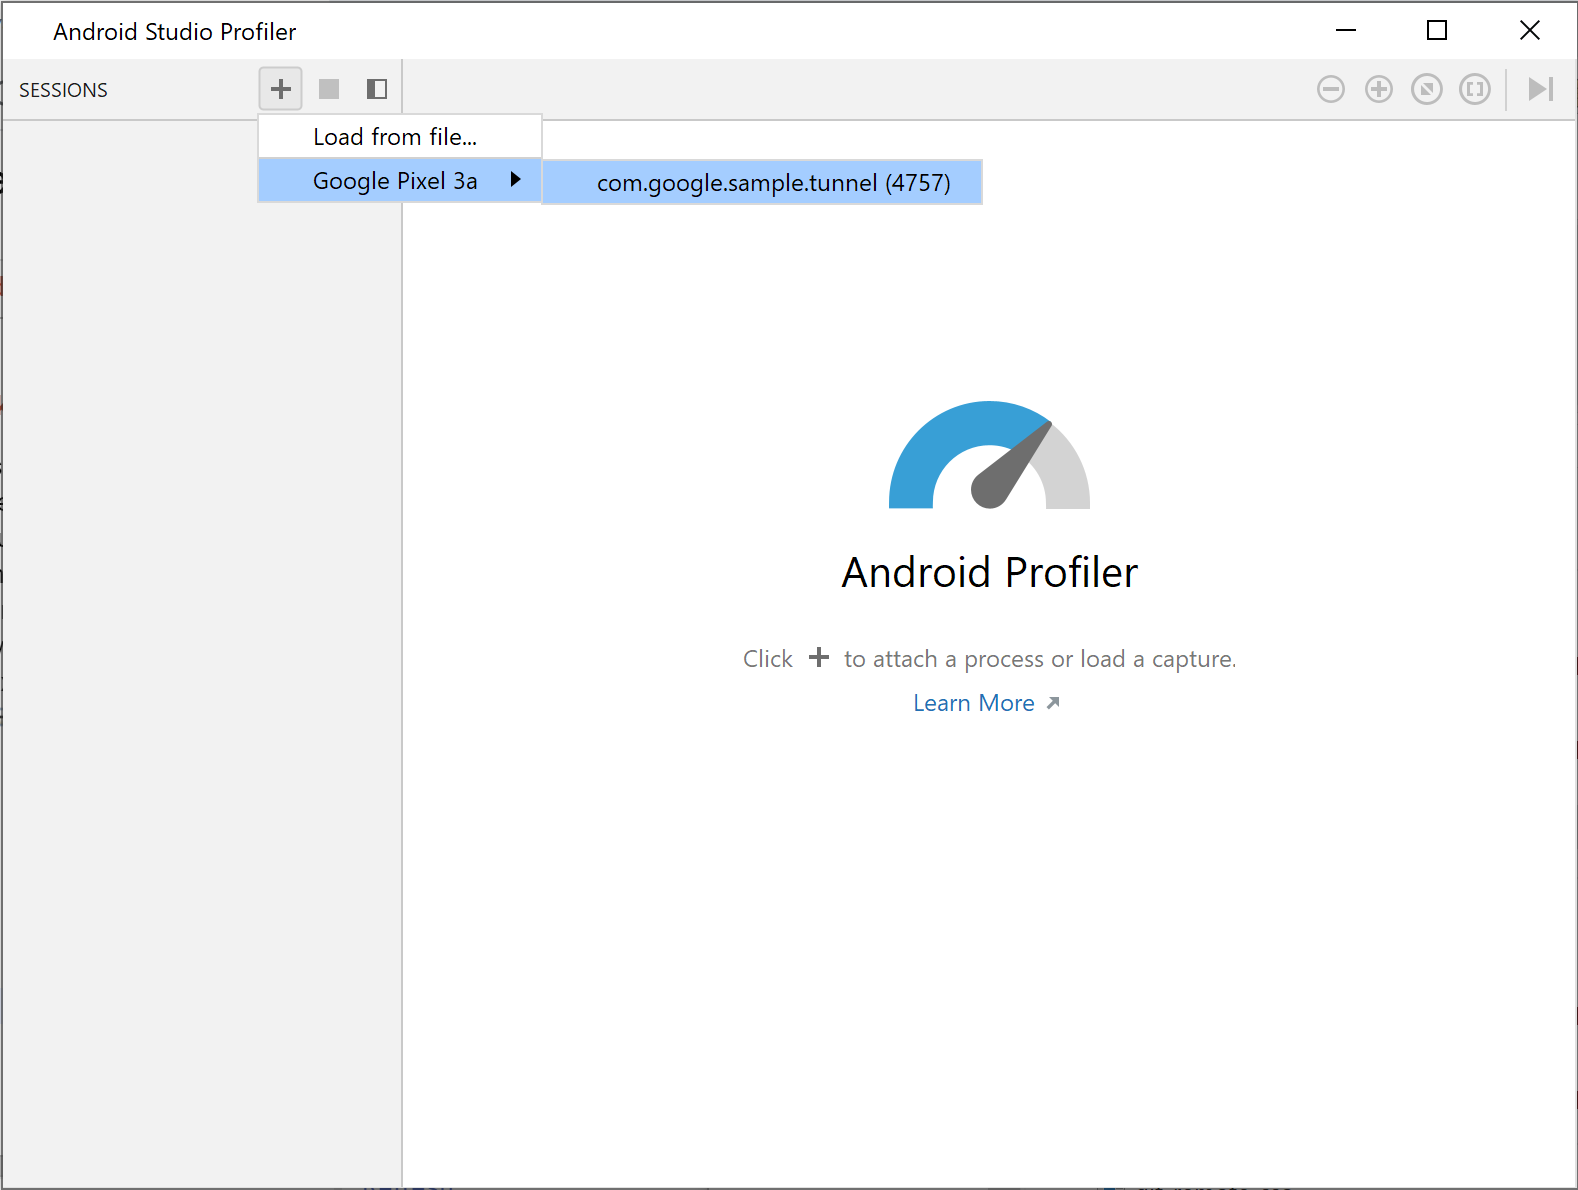
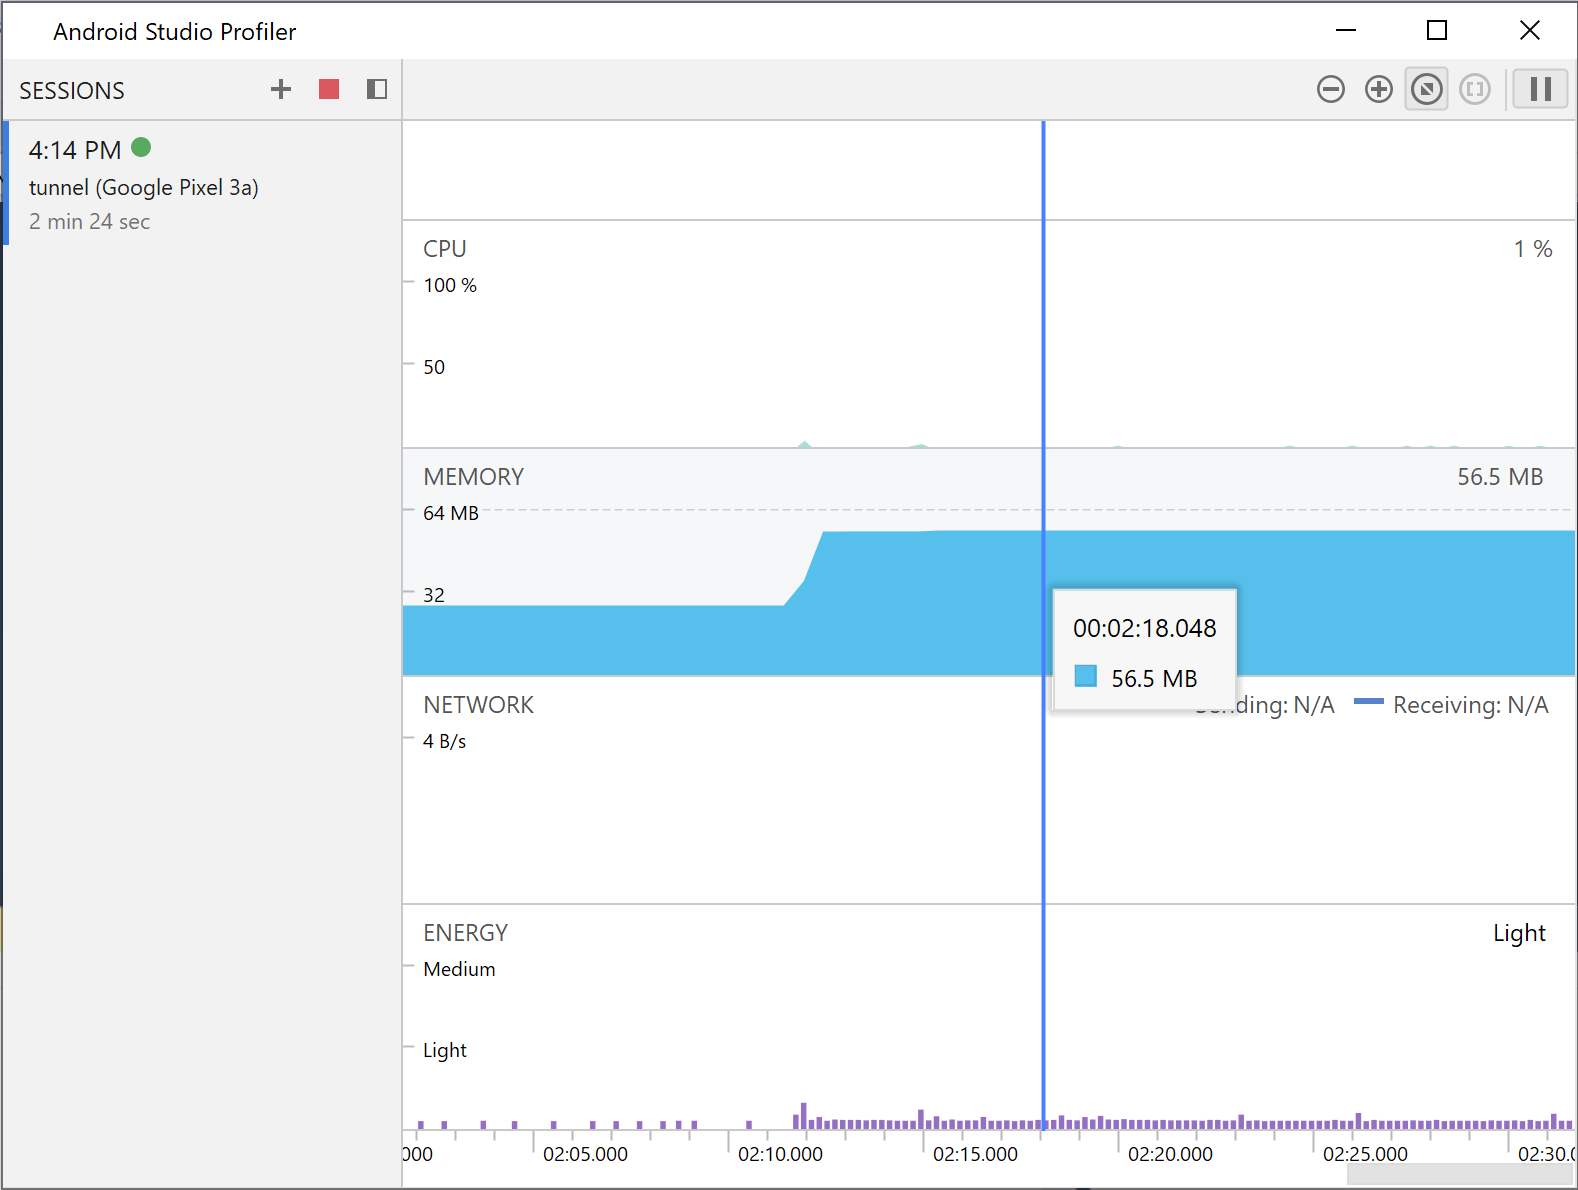
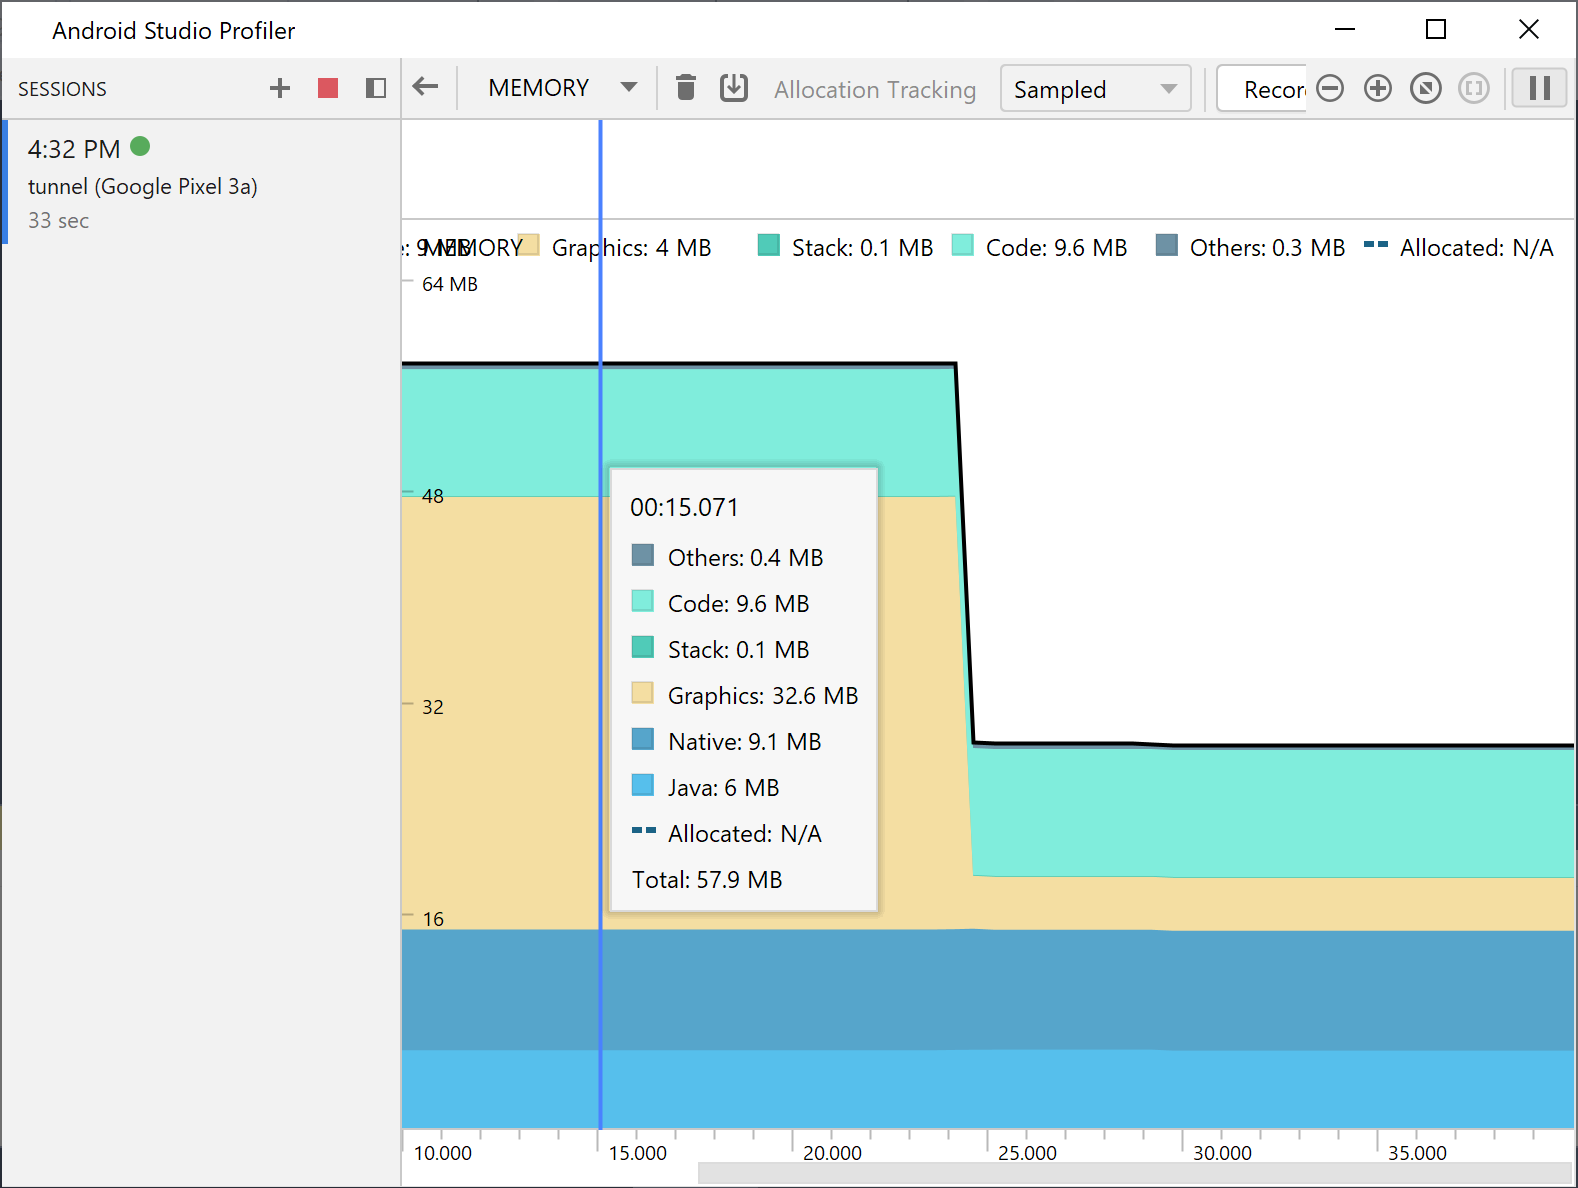
আপনি অ্যান্ড্রয়েড স্টুডিও প্রোফাইলারের একটি স্বতন্ত্র সংস্করণ ব্যবহার করে আপনার অ্যাপের কর্মক্ষমতা পরিমাপ করতে পারেন। প্রোফাইলার শুরু করতে, নিম্নলিখিতগুলি করুন:
এই পৃষ্ঠার কন্টেন্ট ও কোডের নমুনাগুলি Content License-এ বর্ণিত লাইসেন্সের অধীনস্থ। Java এবং OpenJDK হল Oracle এবং/অথবা তার অ্যাফিলিয়েট সংস্থার রেজিস্টার্ড ট্রেডমার্ক।
2025-07-29 UTC-তে শেষবার আপডেট করা হয়েছে।
[[["সহজে বোঝা যায়","easyToUnderstand","thumb-up"],["আমার সমস্যার সমাধান হয়েছে","solvedMyProblem","thumb-up"],["অন্যান্য","otherUp","thumb-up"]],[["এতে আমার প্রয়োজনীয় তথ্য নেই","missingTheInformationINeed","thumb-down"],["খুব জটিল / অনেক ধাপ","tooComplicatedTooManySteps","thumb-down"],["পুরনো","outOfDate","thumb-down"],["অনুবাদ সংক্রান্ত সমস্যা","translationIssue","thumb-down"],["নমুনা / কোড সংক্রান্ত সমস্যা","samplesCodeIssue","thumb-down"],["অন্যান্য","otherDown","thumb-down"]],["2025-07-29 UTC-তে শেষবার আপডেট করা হয়েছে।"],[],[]]

 ভিজ্যুয়াল স্টুডিও টুলবারে বোতাম।