应用的内存用量特征是其性能的一个基本方面。您可以使用系统分析器 ,通过查看可用的 GPU 计数器信息来分析这些特征。
Adreno 设备
在 Adreno 设备上,首先要突出显示与单个 GPU 帧一致的时间段,如 估算 CPU 和 GPU 帧处理时间中所述。 使用该页面上介绍的技术,即使用 GPU 利用率 (%) 或类似的计数器轨道作为帧时间边界,因为计数器轨道都使用相同的计时技术,并且可以更准确地估算内存利用率(与使用从 GPU 切片派生的帧时间边界相比,GPU 切片的数据独立于计数器轨道数据收集)。
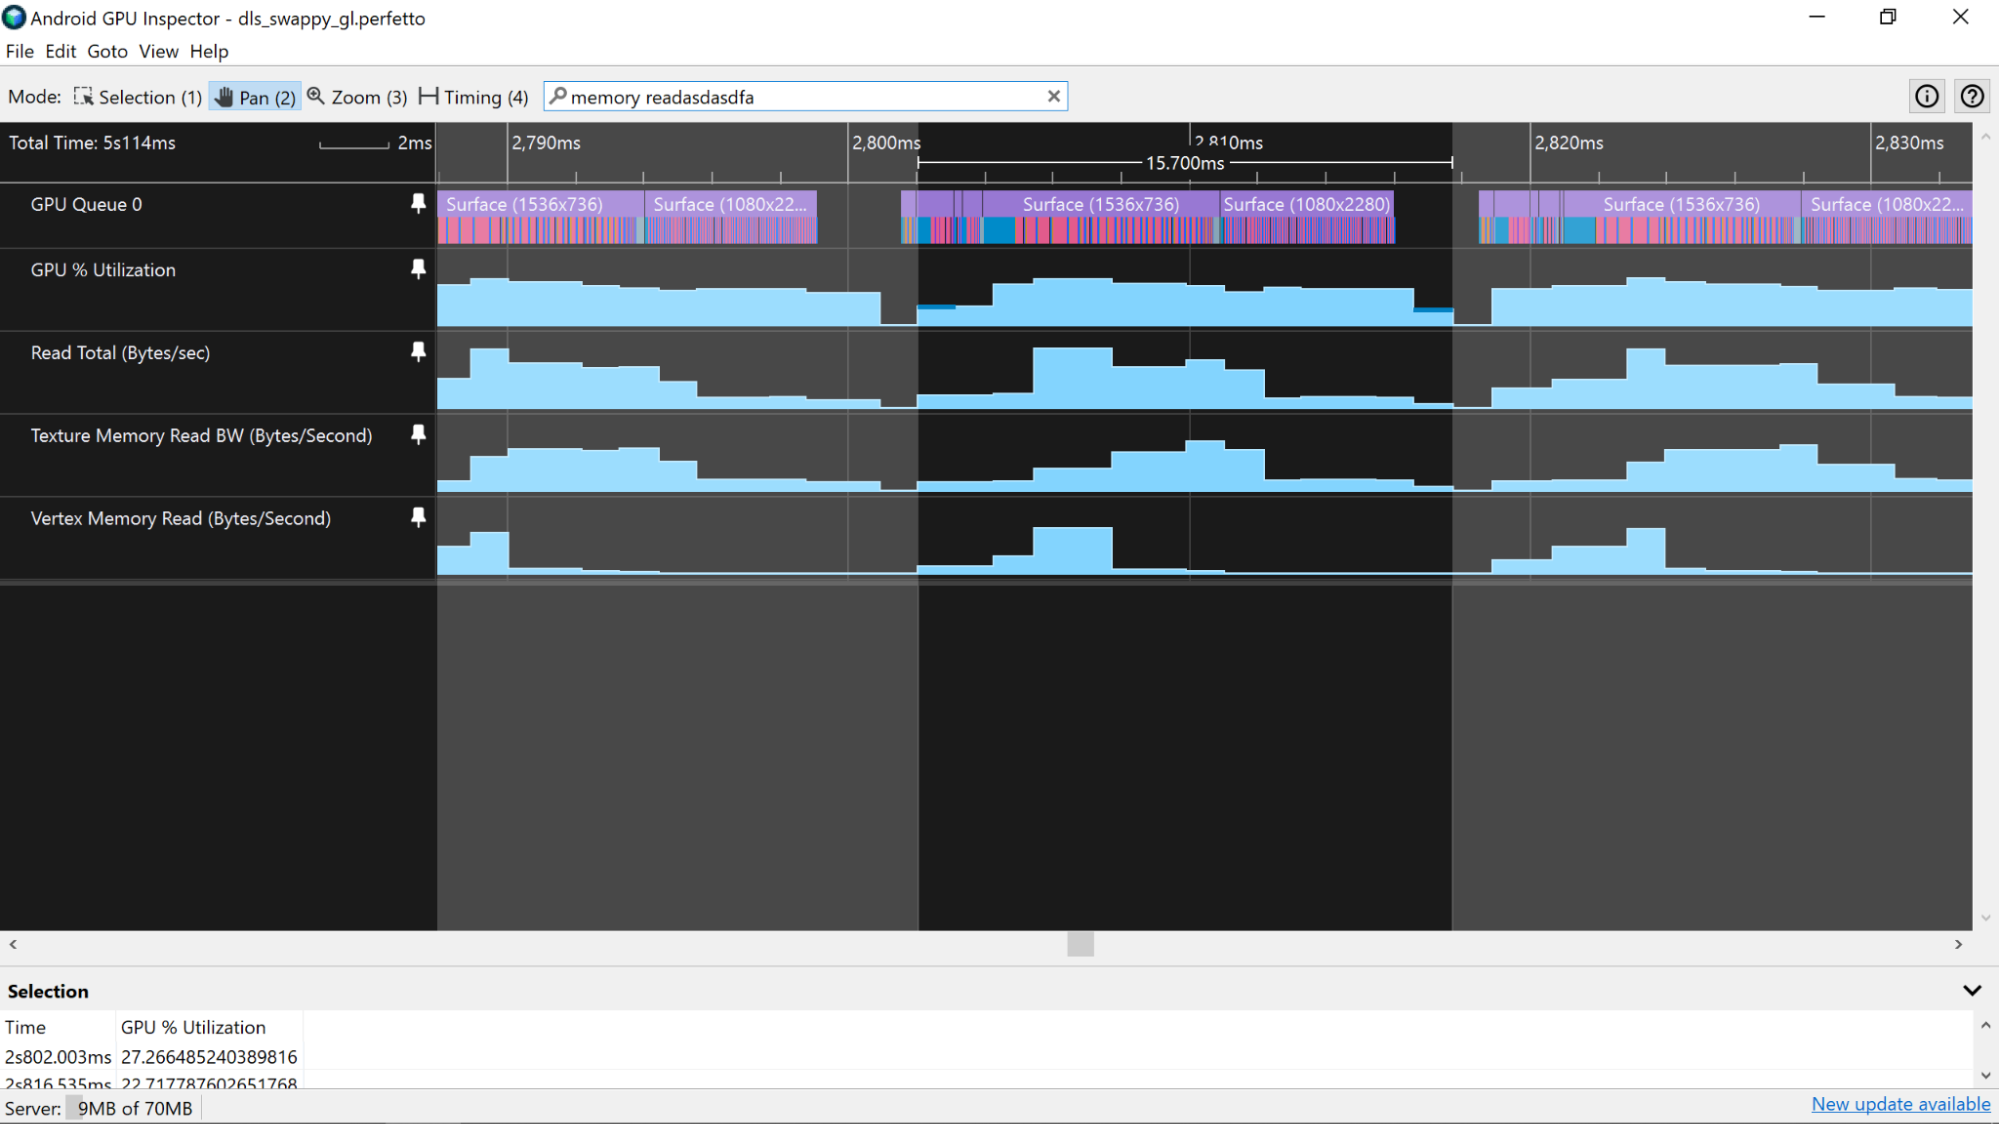
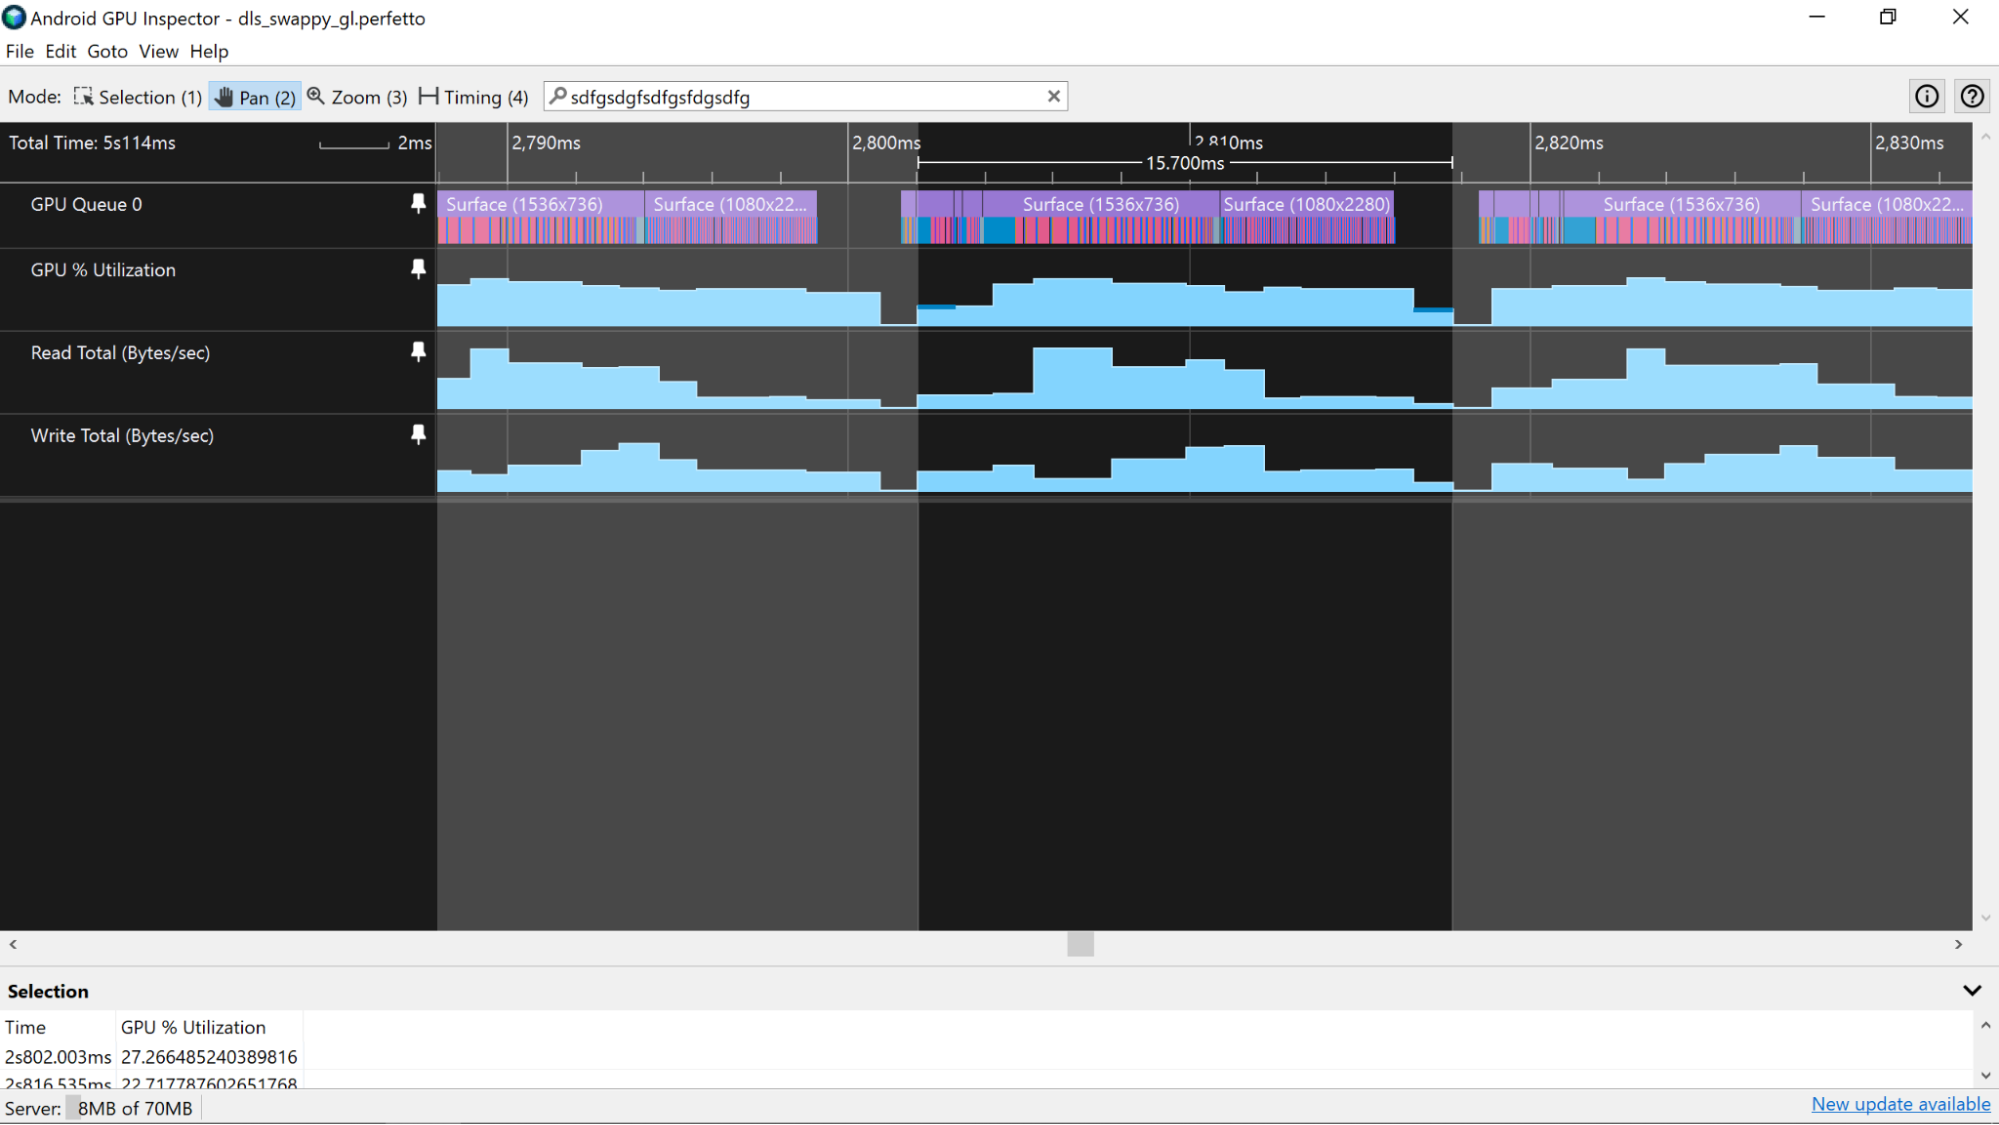
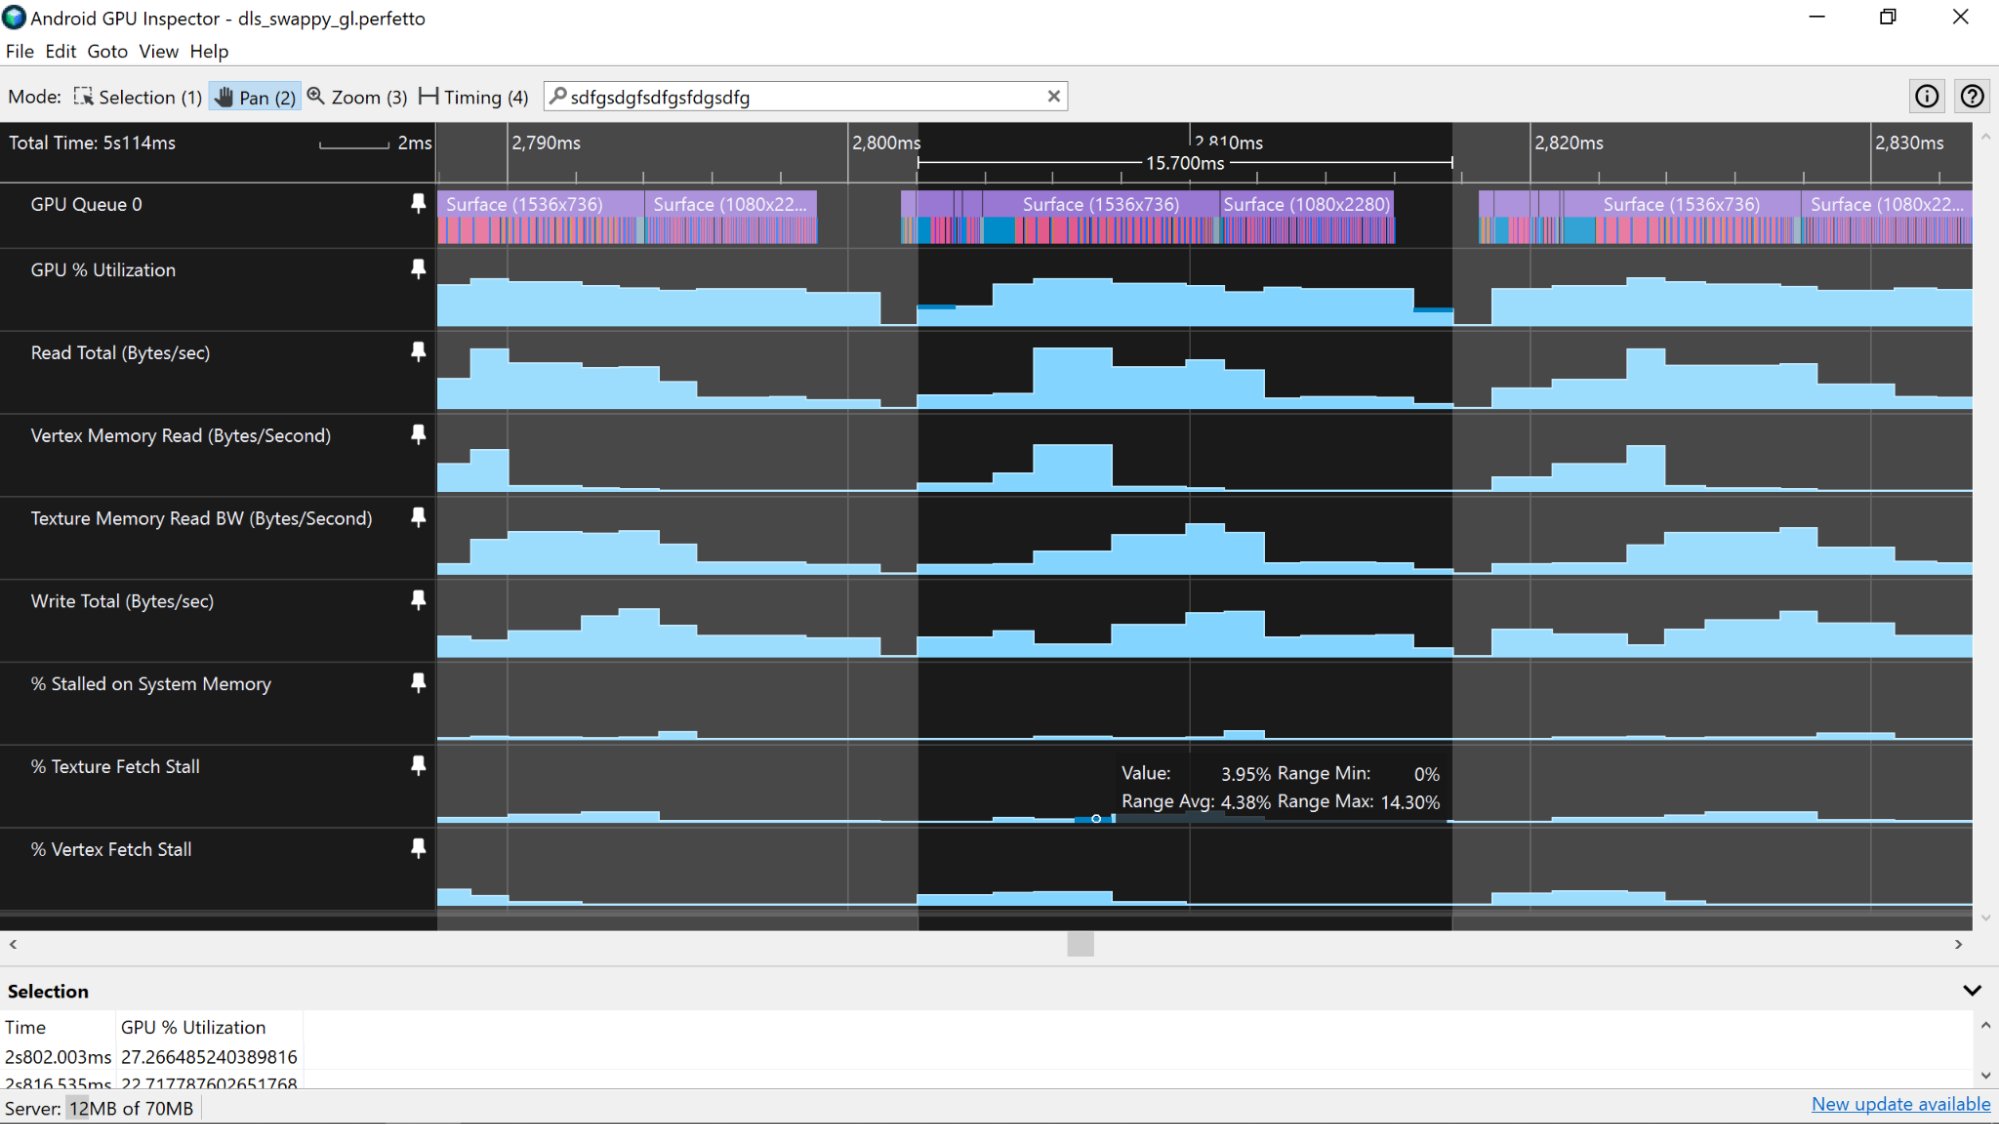
读/写总数
在性能分析器中突出显示单个帧后,首先查看读取总数(字节/秒) 和写入总数(字节/秒) 计数器。这些计数器可以很好地总体了解在单个帧期间有多少数据通过内存总线。请尽力减少通过总线发送的数据量,因为内存带宽是移动设备上电池耗电量的重要来源。
您还可以检查 Vertex 内存读取(字节/秒) 和 Texture 内存读取(字节/秒) 计数器,以确定用于顶点和纹理数据的带宽部分。
您认为这些值的“良好”程度取决于应用中看到的工作负载类型。例如,2D 应用可能会看到相对较大的纹理内存读取带宽用量(约 2+GB/秒),但顶点内存带宽可能非常小(约 50MB/秒)。如需了解详情,请参阅 分析顶点内存带宽和 分析纹理内存带宽用量文档。
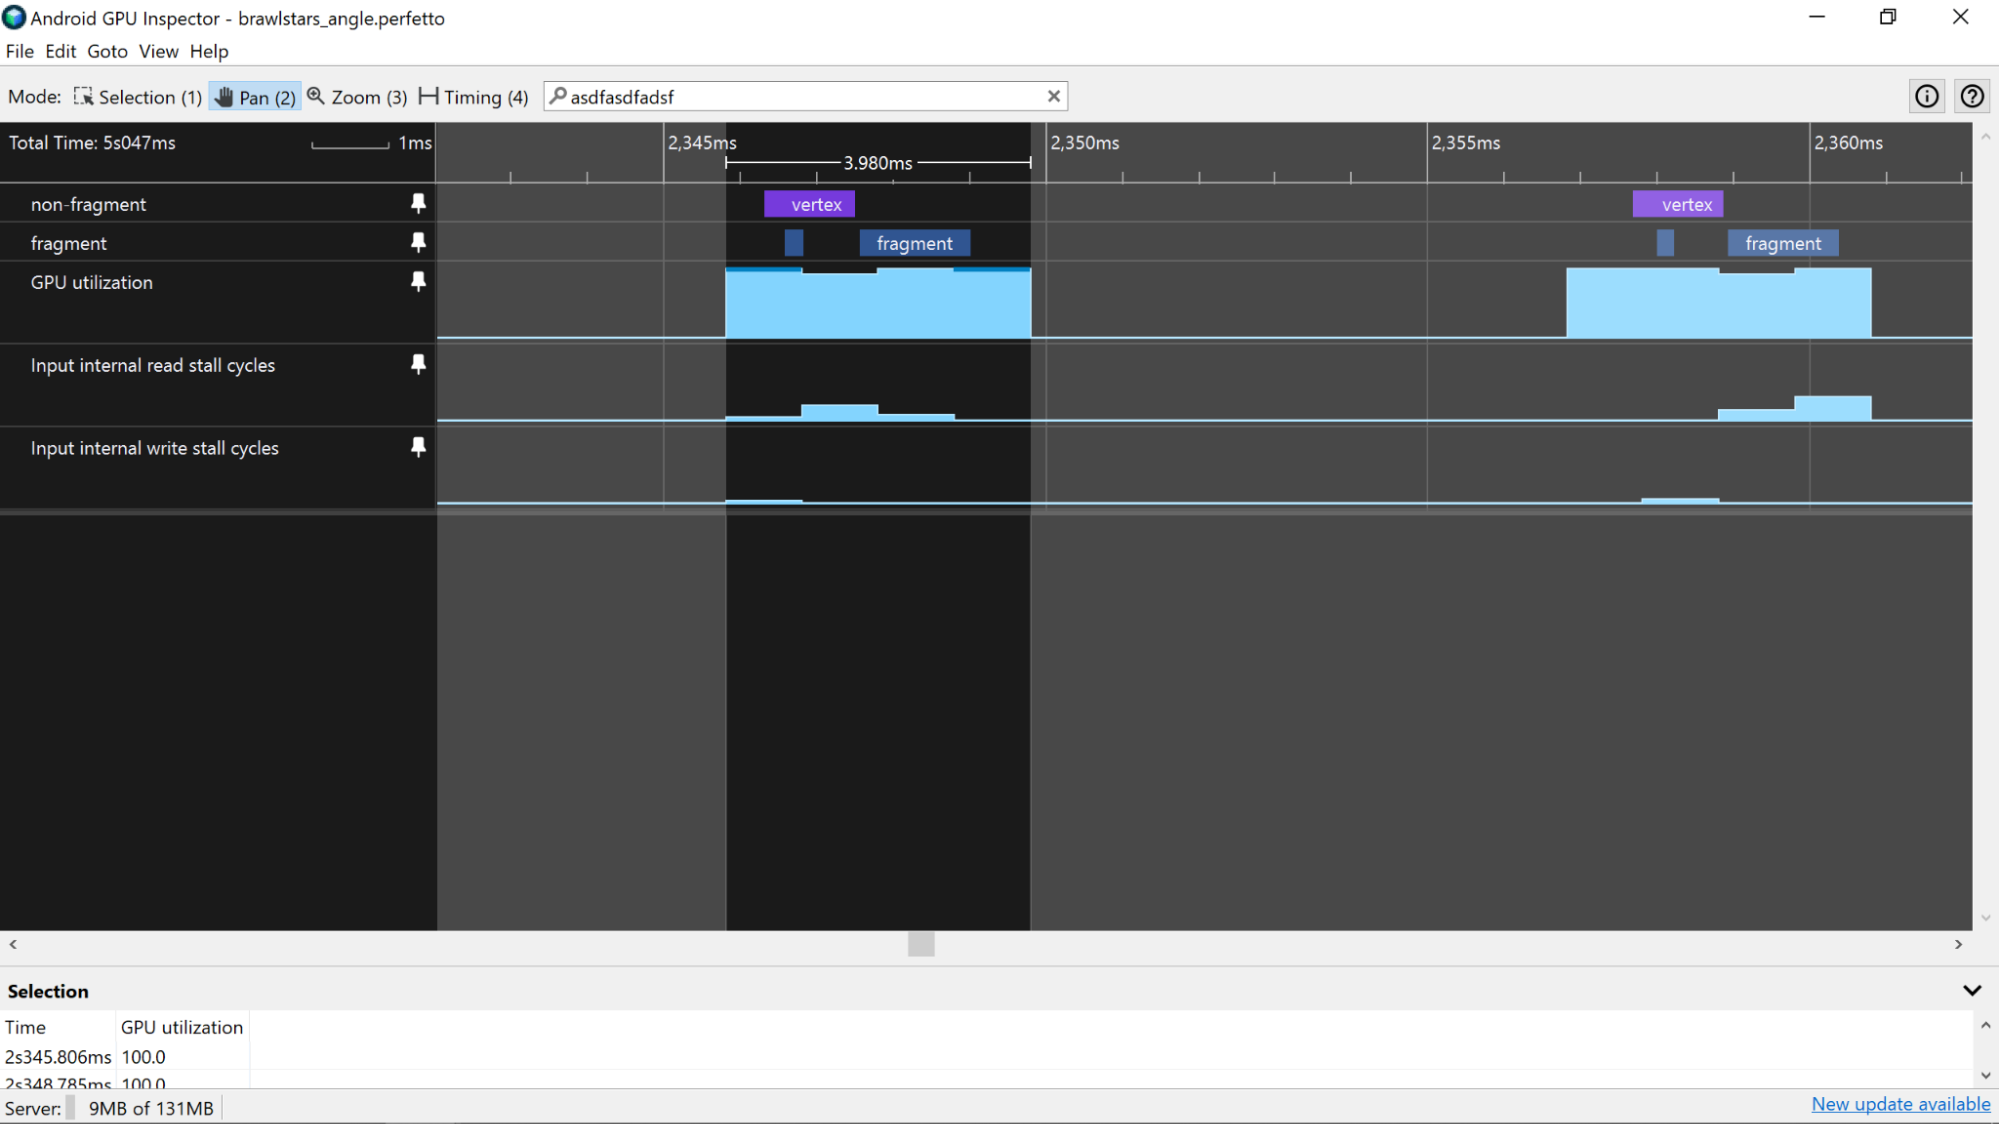
提取停顿
查看顶点提取停顿 (%)、纹理提取停顿 (%)和系统内存停顿 (%)计数器,因为这些计数器会提供一些有关应用整体内存性能的提示。如果这些值高于大约 5%,则表明您的应用要么没有以高效的方式在内存中布局数据,要么没有以高效的方式访问其数据以利用缓存。 如需详细了解如何提高这些类型资源的内存用量,请参阅分析顶点内存带宽和 分析纹理内存带宽用量。
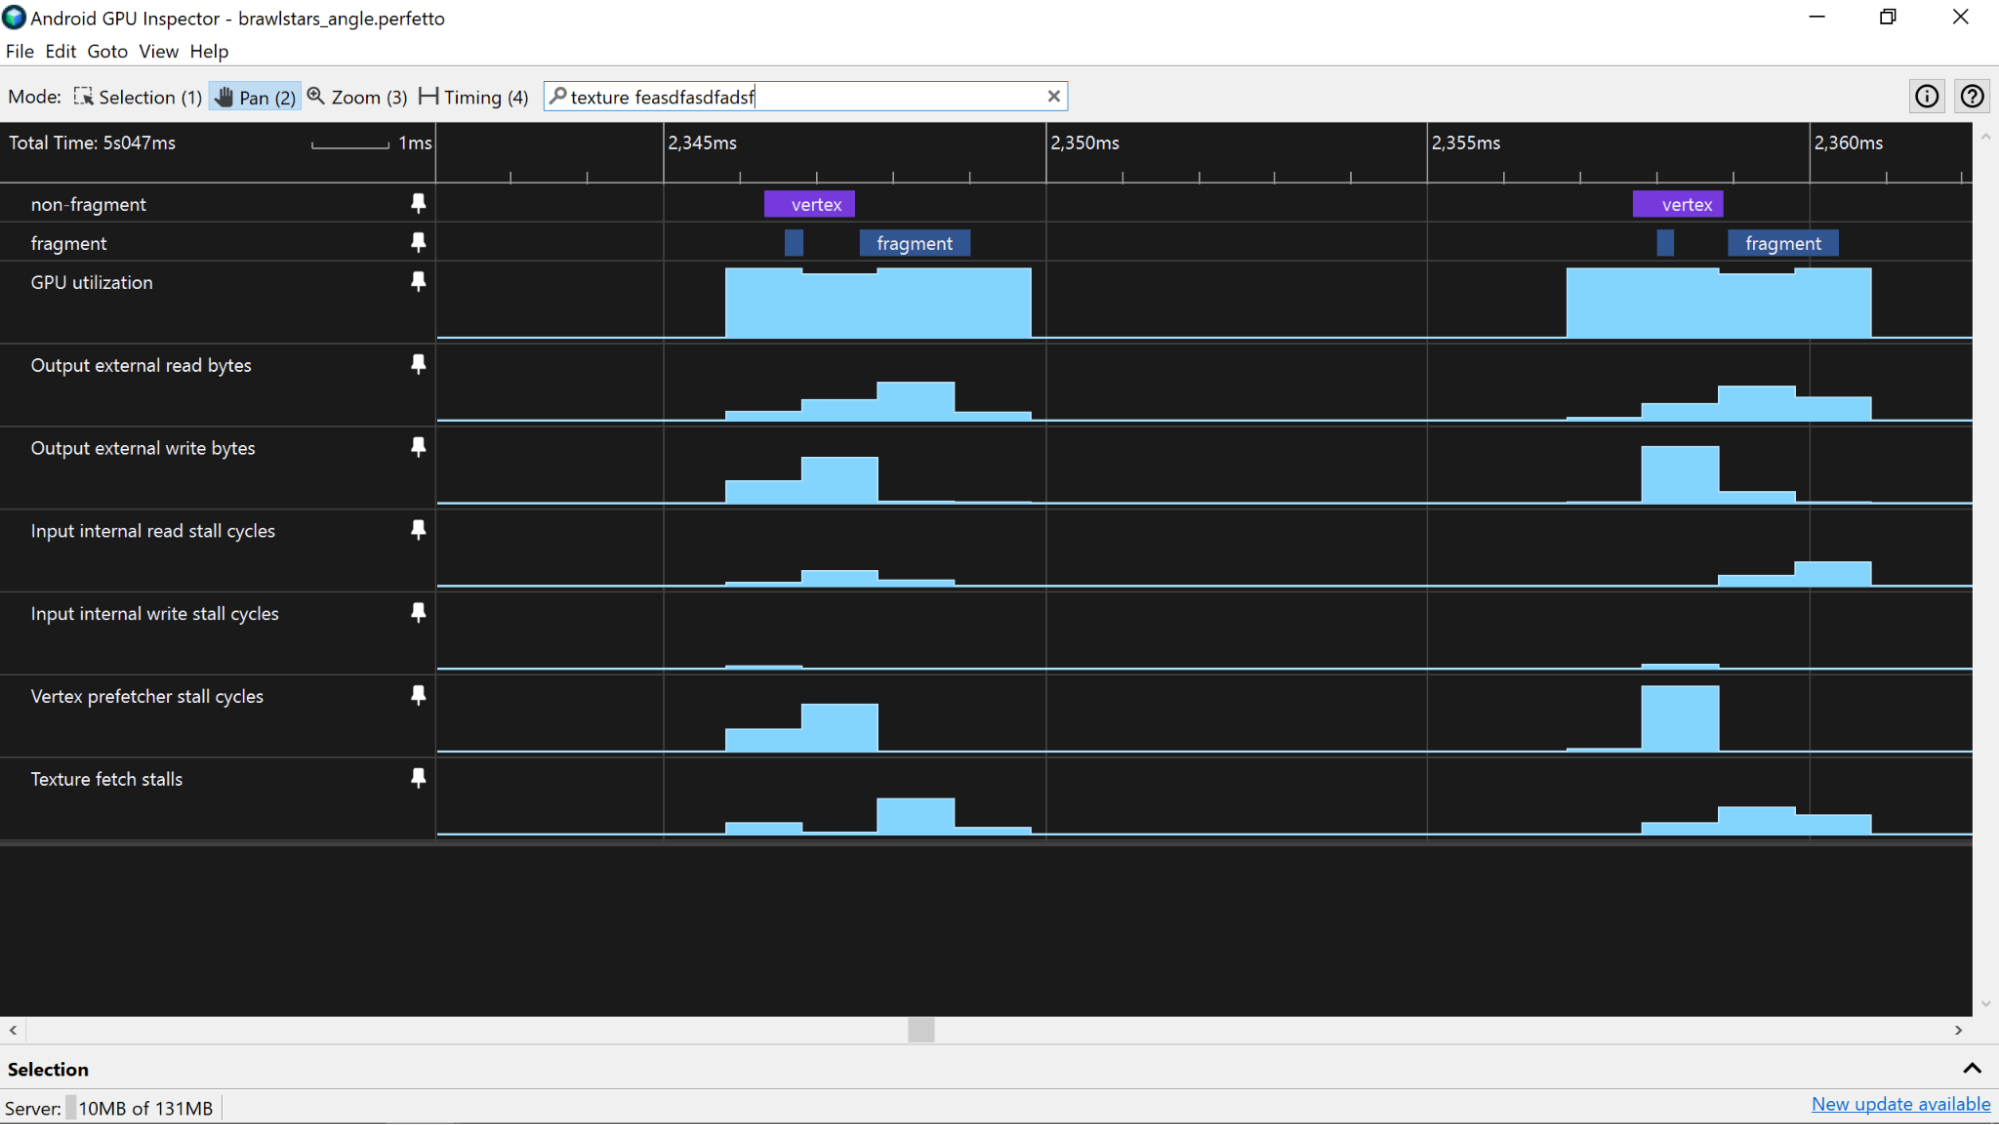
Mali 设备
在 Mali 设备上,首先要突出显示与单个 GPU 帧一致的时间段,如估算 CPU 和 GPU 帧处理时间中所述。 使用该页面上介绍的技术,即使用 GPU 利用率 (%) 或类似的计数器轨道作为帧时间边界,因为计数器轨道都使用相同的计时技术,并且可以更准确地估算内存利用率(与使用从 GPU 切片派生的帧时间边界相比,GPU 切片的数据独立于计数器轨道数据收集)。
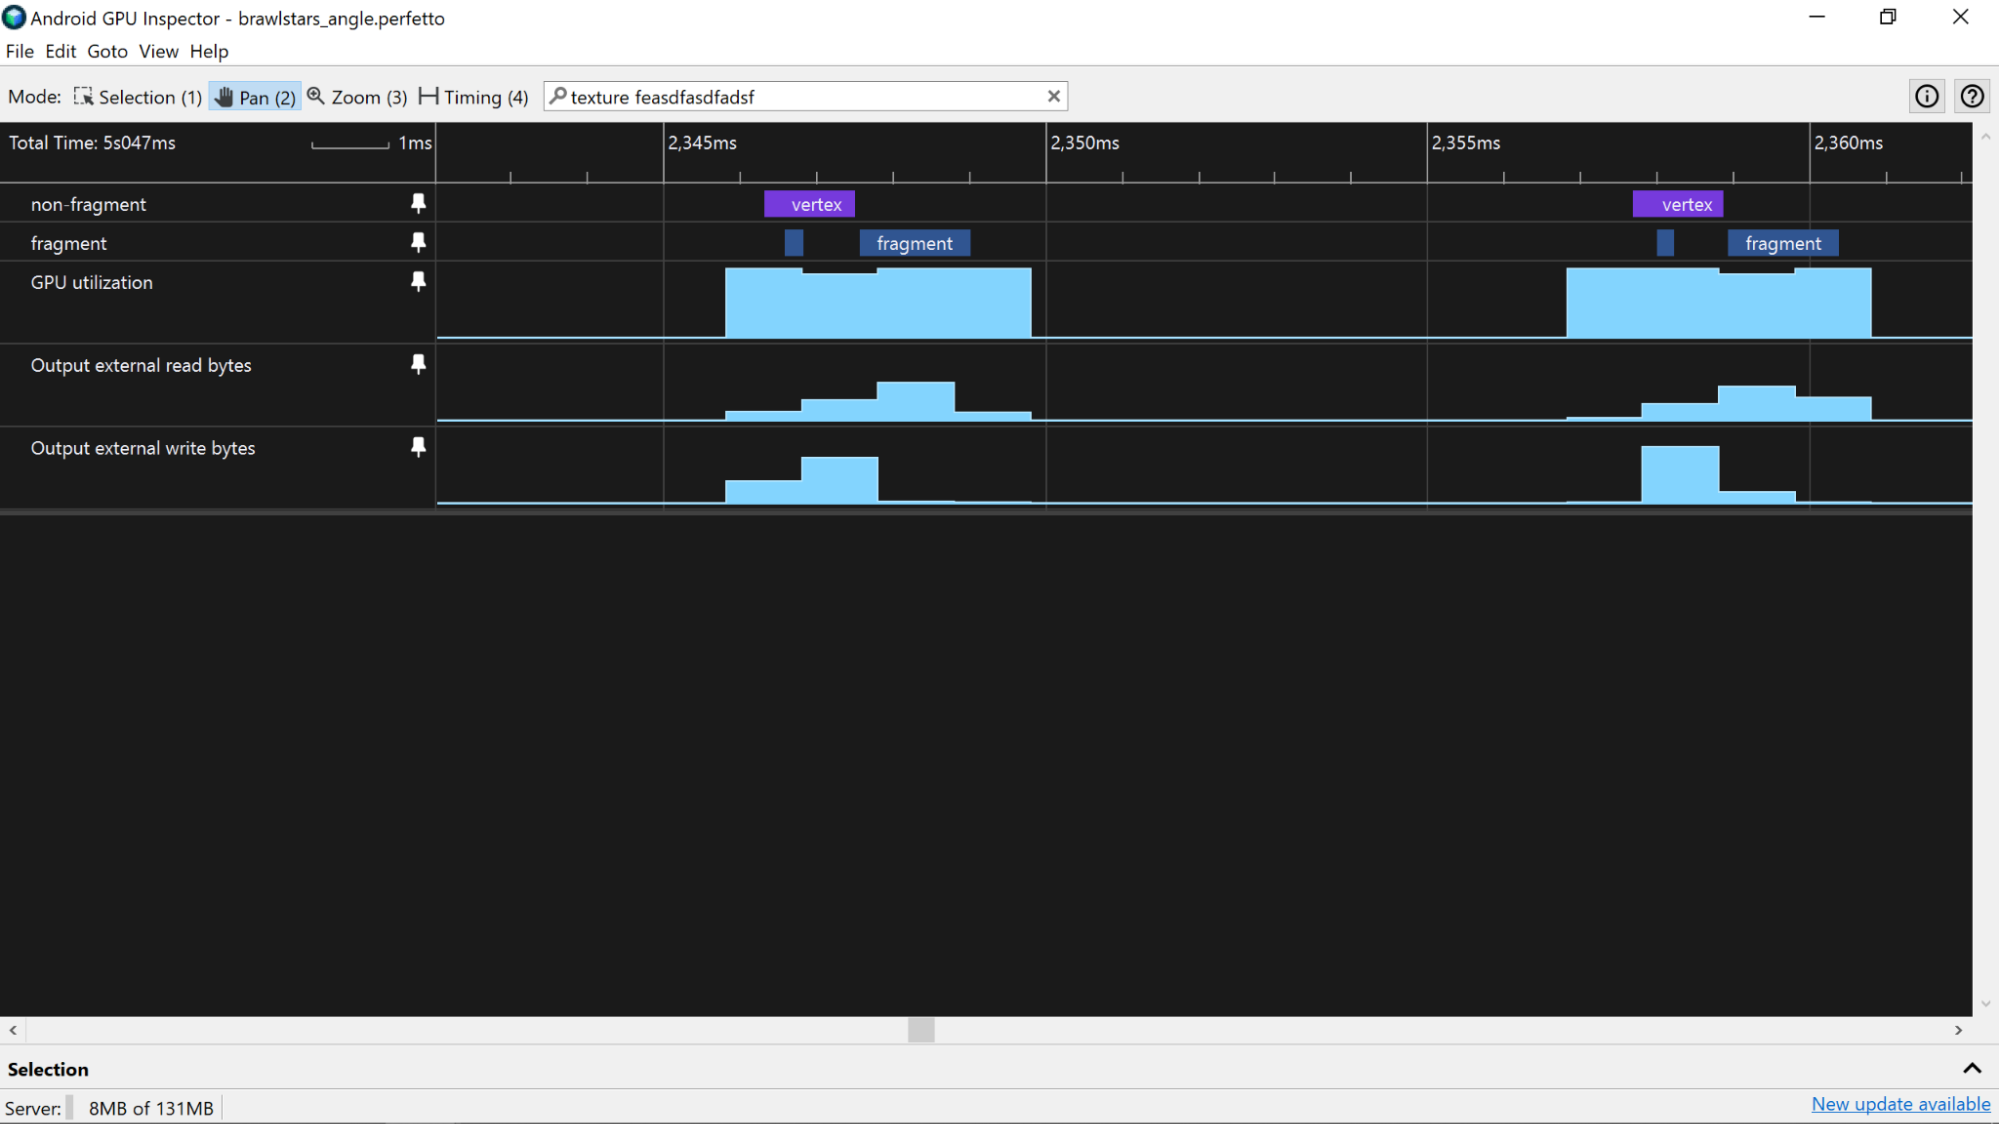
输出外部总数
在系统分析器中突出显示单个帧后,首先 查看输出外部读取字节数 输出外部写入字节数 计数器。这些计数器可以很好地总体了解在单个帧期间有多少数据通过内存总线。请尽力减少通过总线发送的数据量,因为内存带宽是移动设备上电池耗电量的重要来源。
输入内部总数
还有一些计数器可提供有关缓存本身的信息。您感兴趣的计数器是“输入内部 [读取|写入] 停顿周期”。这些值越高,表示您成功访问了缓存,但发出的读取请求过多,导致着色器代码停顿,等待访问内存。
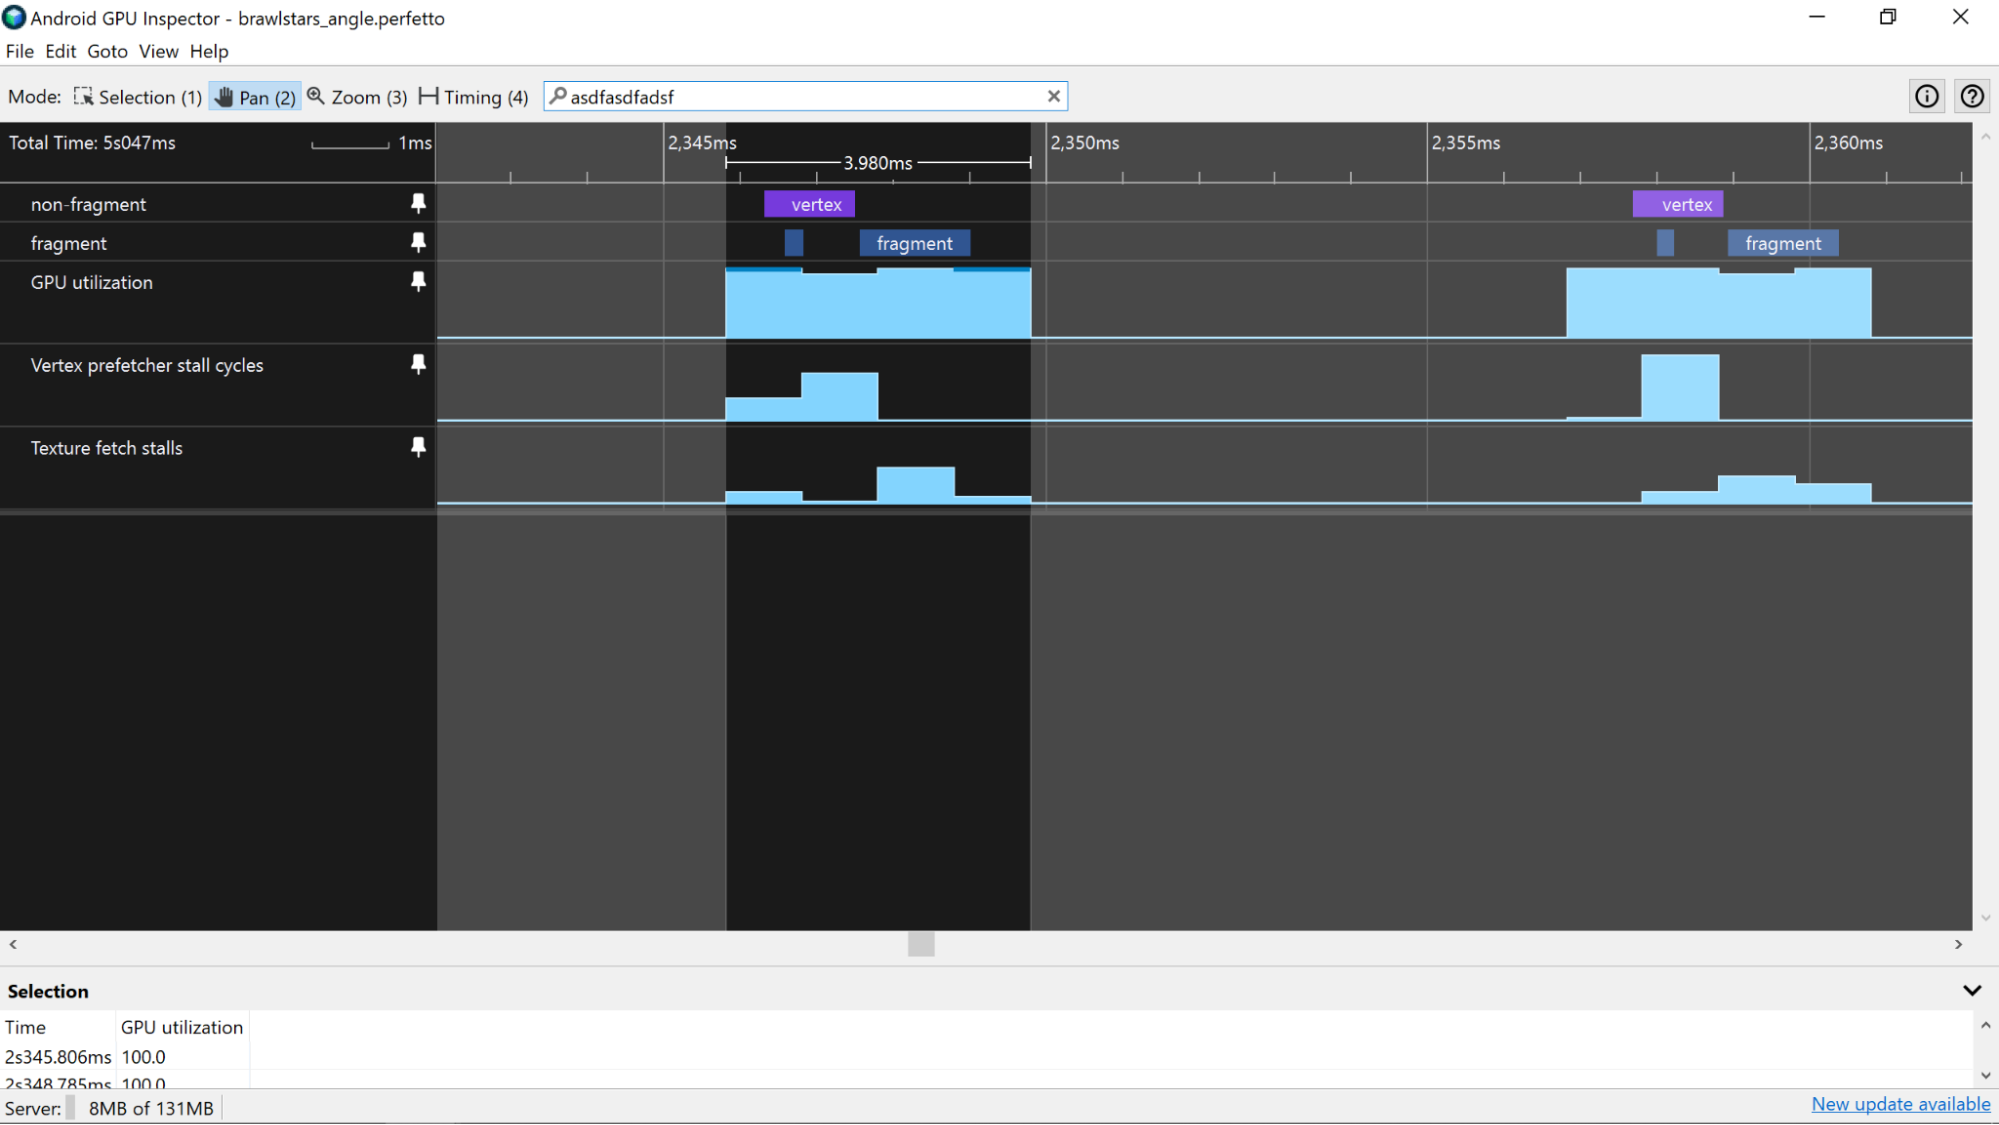
提取停顿
接下来,您可以查看顶点预提取器停顿周期 和纹理提取停顿 计数器,因为这些计数器会提供一些有关应用整体内存性能的提示。如果您看到的值高于大约 5%,则表明您要么没有以高效的方式在内存中布局数据,要么没有以高效的方式访问数据以利用缓存。如需详细了解如何提高这些类型资源的内存用量,请参阅分析 [顶点|纹理] 内存带宽文章