संग्रह की मदद से व्यवस्थित रहें
अपनी प्राथमिकताओं के आधार पर, कॉन्टेंट को सेव करें और कैटगरी में बांटें.
मेमोरी पैन में, चुनी गई कमांड के लिए RAM या GPU मेमोरी में मौजूद वैल्यू दिखती हैं.
पहली इमेज. मेमोरी पैन
इस पैनल में यह दिखता है कि चुनी गई कमांड ने किन मेमोरी लोकेशन से डेटा पढ़ा और/या उनमें डेटा लिखा. आम तौर पर, हर कमांड में पढ़ने या लिखने की कई कार्रवाइयां होती हैं;
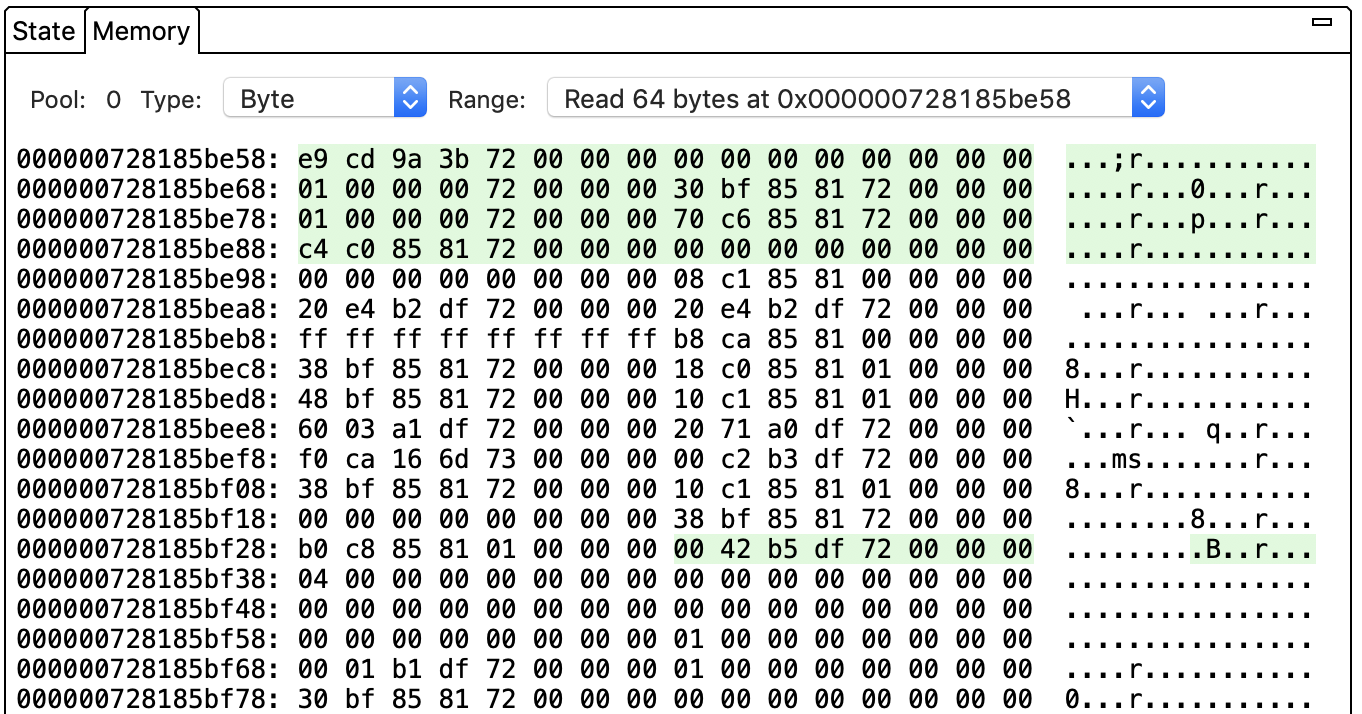
रेंज सूची से कोई एक चुनें. व्यू अपडेट हो जाता है और ऑपरेशन के लिए शुरुआती मेमोरी पता दिखता है. हरा रंग, पढ़ने की कार्रवाई को दिखाता है, जबकि लाल रंग लिखने की कार्रवाई को दिखाता है. उदाहरण के लिए, ऊपर दी गई इमेज में मौजूद कमांड में, मेमोरी पते 0x000000728185be58 से शुरू होने वाले 64 बाइट का रीड ऑपरेशन शामिल है. टाइप सूची से कोई दूसरा डेटा टाइप चुनकर, डेटा को दिखाने का तरीका बदला जा सकता है.
ऐप्लिकेशन की मेमोरी से जुड़ी वैल्यू दिखाने के लिए, पूल फ़ील्ड को 0 पर सेट किया जाता है. अगर पूल को किसी अन्य नंबर पर सेट किया जाता है, तो पैनल में GPU को असाइन की गई मेमोरी की वैल्यू दिखती हैं. ऐप्लिकेशन मेमोरी, रैम का इस्तेमाल करती है. वहीं, GPU को असाइन की गई मेमोरी, रैम या GPU मेमोरी का इस्तेमाल कर सकती है.
कमांड पैन में किसी पॉइंटर वैल्यू पर क्लिक करके, सीधे मेमोरी पैन में उस पते पर जाएं.
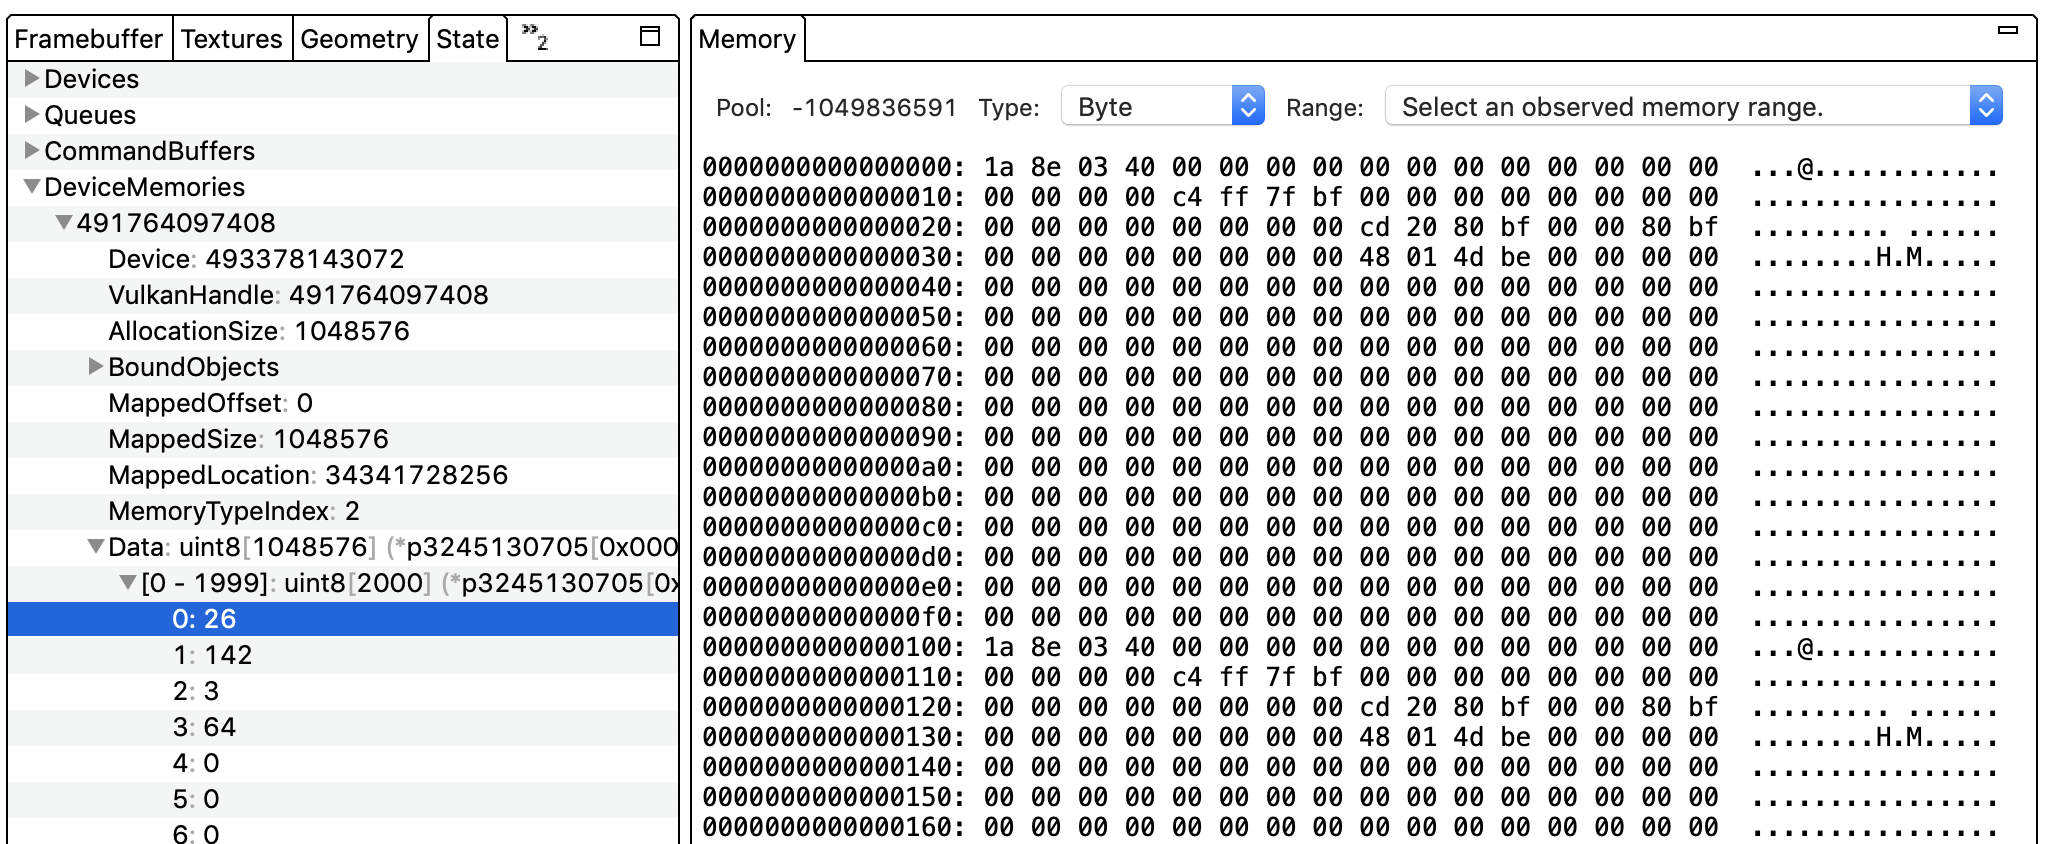
इस पैनल में, सिर्फ़ कुछ पतों की रेंज देखने की सुविधा नहीं मिलती है. कोई कमांड और फिर स्टेट पैनल चुनें. DeviceMemories को चुनें. (यह सेक्शन, Vulkan ट्रेस के लिए Vulkan हैंडल के हिसाब से व्यवस्थित किया गया है.) हैंडल को बड़ा करें और डेटा चुनें. व्यू में किसी पते को दिखाने के लिए, उस पर क्लिक करें.
दूसरी इमेज. मेमोरी की स्थिति
इस पेज पर मौजूद कॉन्टेंट और कोड सैंपल कॉन्टेंट के लाइसेंस में बताए गए लाइसेंस के हिसाब से हैं. Java और OpenJDK, Oracle और/या इससे जुड़ी हुई कंपनियों के ट्रेडमार्क या रजिस्टर किए हुए ट्रेडमार्क हैं.
आखिरी बार 2025-07-27 (UTC) को अपडेट किया गया.
[[["समझने में आसान है","easyToUnderstand","thumb-up"],["मेरी समस्या हल हो गई","solvedMyProblem","thumb-up"],["अन्य","otherUp","thumb-up"]],[["वह जानकारी मौजूद नहीं है जो मुझे चाहिए","missingTheInformationINeed","thumb-down"],["बहुत मुश्किल है / बहुत सारे चरण हैं","tooComplicatedTooManySteps","thumb-down"],["पुराना","outOfDate","thumb-down"],["अनुवाद से जुड़ी समस्या","translationIssue","thumb-down"],["सैंपल / कोड से जुड़ी समस्या","samplesCodeIssue","thumb-down"],["अन्य","otherDown","thumb-down"]],["आखिरी बार 2025-07-27 (UTC) को अपडेट किया गया."],[],[],null,["# Memory Pane\n\nThe **Memory** pane displays the values in RAM or GPU memory for the selected command.\n**Figure 1.**Memory pane\n\nThis pane shows which memory locations were read from and/or written to by the\nselected command. Each command typically has multiple read or write operations;\nselect one from the **Range** list. The view updates to show the starting memory\naddress for the operation. Green denotes a read operation while red denotes a\nwrite operation. For example, the command in the image above contained a read\noperation of 64 bytes starting at memory address `0x000000728185be58`. You can\nchange how the data is displayed by selecting a different data type from the\n**Type** list.\n\nThe **Pool** field is set to **0** for displaying values corresponding to application memory. If the **Pool** is set to any other number, the pane shows values for GPU-assigned memory. Application memory uses RAM while GPU-assigned memory may use RAM or GPU memory.\n\nClick a pointer value in the **Commands** pane to jump directly to that specific\naddress in the **Memory** pane.\n\nYou aren't limited to viewing specific address ranges in this pane. Select a\ncommand and then the **State** pane. Select **DeviceMemories** . (This section is\norganized by Vulkan handle for Vulkan traces.) Expand a handle and select\n**Data**. Click a specific address to display it in the view.\n**Figure 2.**Memory state"]]