
Capture a heap dump to see which objects in your app are using up memory at the time of the capture and identify memory leaks, or memory allocation behavior that leads to stutter, freezes, and even app crashes. It's especially helpful to take heap dumps after an extended user session, when it could show objects still in memory that should no longer be there.
This page describes the tooling that Android Studio provides to collect and
analyze heap dumps. Alternatively, you can inspect your app memory from the
command line with dumpsys and also
see garbage collection (GC) events in Logcat.
Why you should profile your app memory
Android provides a managed memory environment—when Android determines that your app is no longer using some objects, the garbage collector releases the unused memory back to the heap. How Android goes about finding unused memory is constantly being improved, but at some point on all Android versions, the system must briefly pause your code. Most of the time, the pauses are imperceivable. However, if your app allocates memory faster than the system can collect it, your app might be delayed while the collector frees enough memory to satisfy your allocations. The delay could cause your app to skip frames and cause visible slowness.
Even if your app doesn't exhibit slowness, if it leaks memory, it can retain that memory even while it's in the background. This behavior can slow the rest of the system's memory performance by forcing unnecessary garbage collection events. Eventually, the system is forced to kill your app process to reclaim the memory. Then when the user returns to your app, the app process must restart completely.
For information about programming practices that can reduce your app's memory use, read Manage your app's memory.
Heap dump overview
To capture a heap dump, select the Analyze Memory Usage (Heap Dump) task (use Profiler: run 'app' as debuggable (complete data)) to capture a heap dump. While dumping the heap, the amount of Java memory might increase temporarily. This is normal because the heap dump occurs in the same process as your app and requires some memory to collect the data. After you capture the heap dump, you see the following:
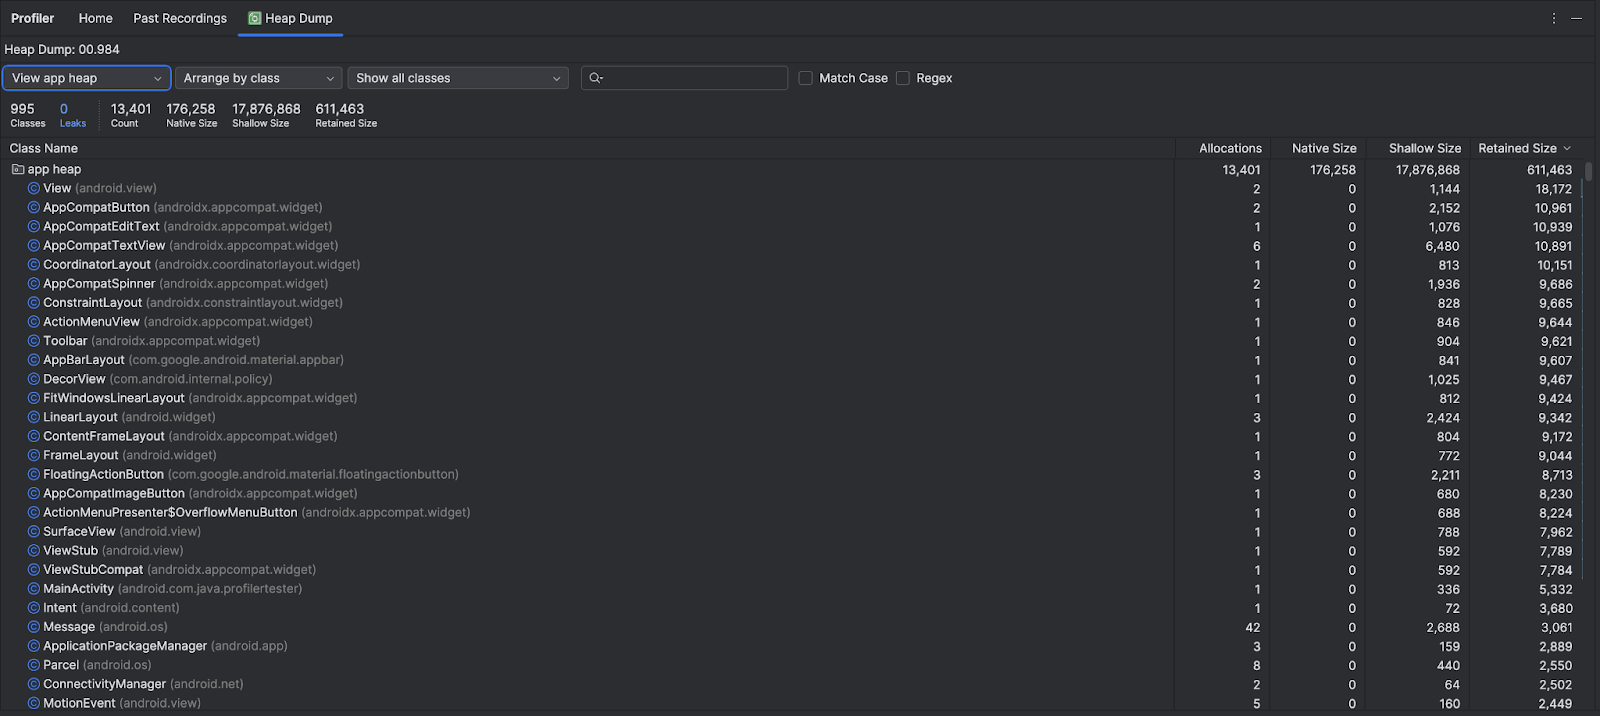
The list of classes shows the following info:
- Allocations: Number of allocations in the heap.
Native Size: Total amount of native memory used by this object type (in bytes). You will see memory here for some objects allocated in Java because Android uses native memory for some framework classes, such as
Bitmap.Shallow Size: Total amount of Java memory used by this object type (in bytes).
Retained Size: Total size of memory being retained due to all instances of this class (in bytes).
Use the heap menu to filter to certain heaps:
- App heap (default): The primary heap on which your app allocates memory.
- Image heap: The system boot image, containing classes that are preloaded during boot time. Allocations here never move or go away.
- Zygote heap: The copy-on-write heap where an app process is forked from in the Android system.
Use the arrangement drop-down to choose how to arrange the allocations:
- Arrange by class (default): Groups all allocations based on class name.
- Arrange by package: Groups all allocations based on package name.
Use the class drop-down to filter to groups of classes:
- All classes (default): Shows all classes, including those from libraries and dependencies.
- Show activity/fragment leaks: Shows classes that are causing memory leaks.
- Show project classes: shows only classes defined by your project.
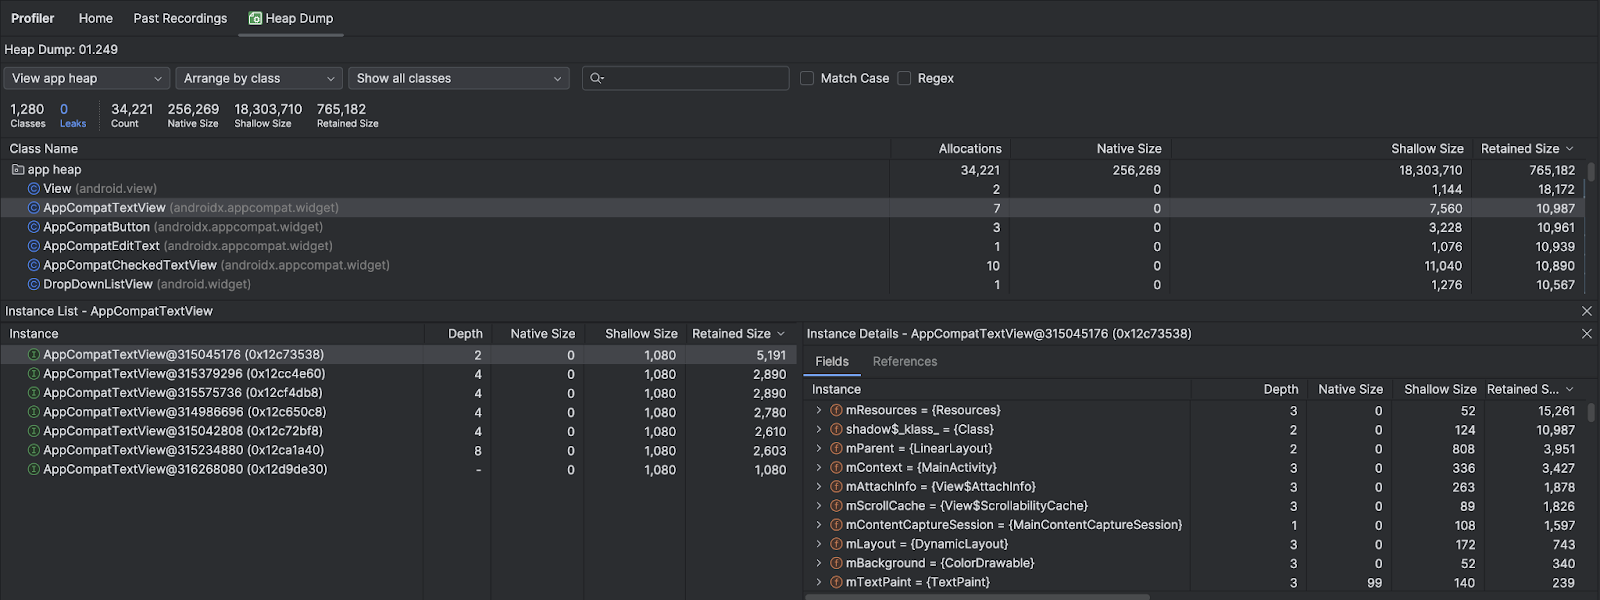
Click a class name to open the Instance pane. Each instance listed includes the following:
- Depth: The shortest number of hops from any GC root to the selected instance.
- Native Size: Size of this instance in native memory. This column is visible only for Android 7.0 and higher.
- Shallow Size: Size of this instance in Java memory.
- Retained Size: Size of memory that this instance dominates (as per the dominator tree).
Click an instance to show the Instance Details, including its Fields
and References. Common field and reference types are structured types
 ,
arrays
,
arrays
 ,
and primitive data types
,
and primitive data types
 in Java. Right-click on a field or reference to go to the associated instance or
line in the source code.
in Java. Right-click on a field or reference to go to the associated instance or
line in the source code.
- Fields: Shows all the fields in this instance.
- References: Shows every reference to the object highlighted in the Instance tab.
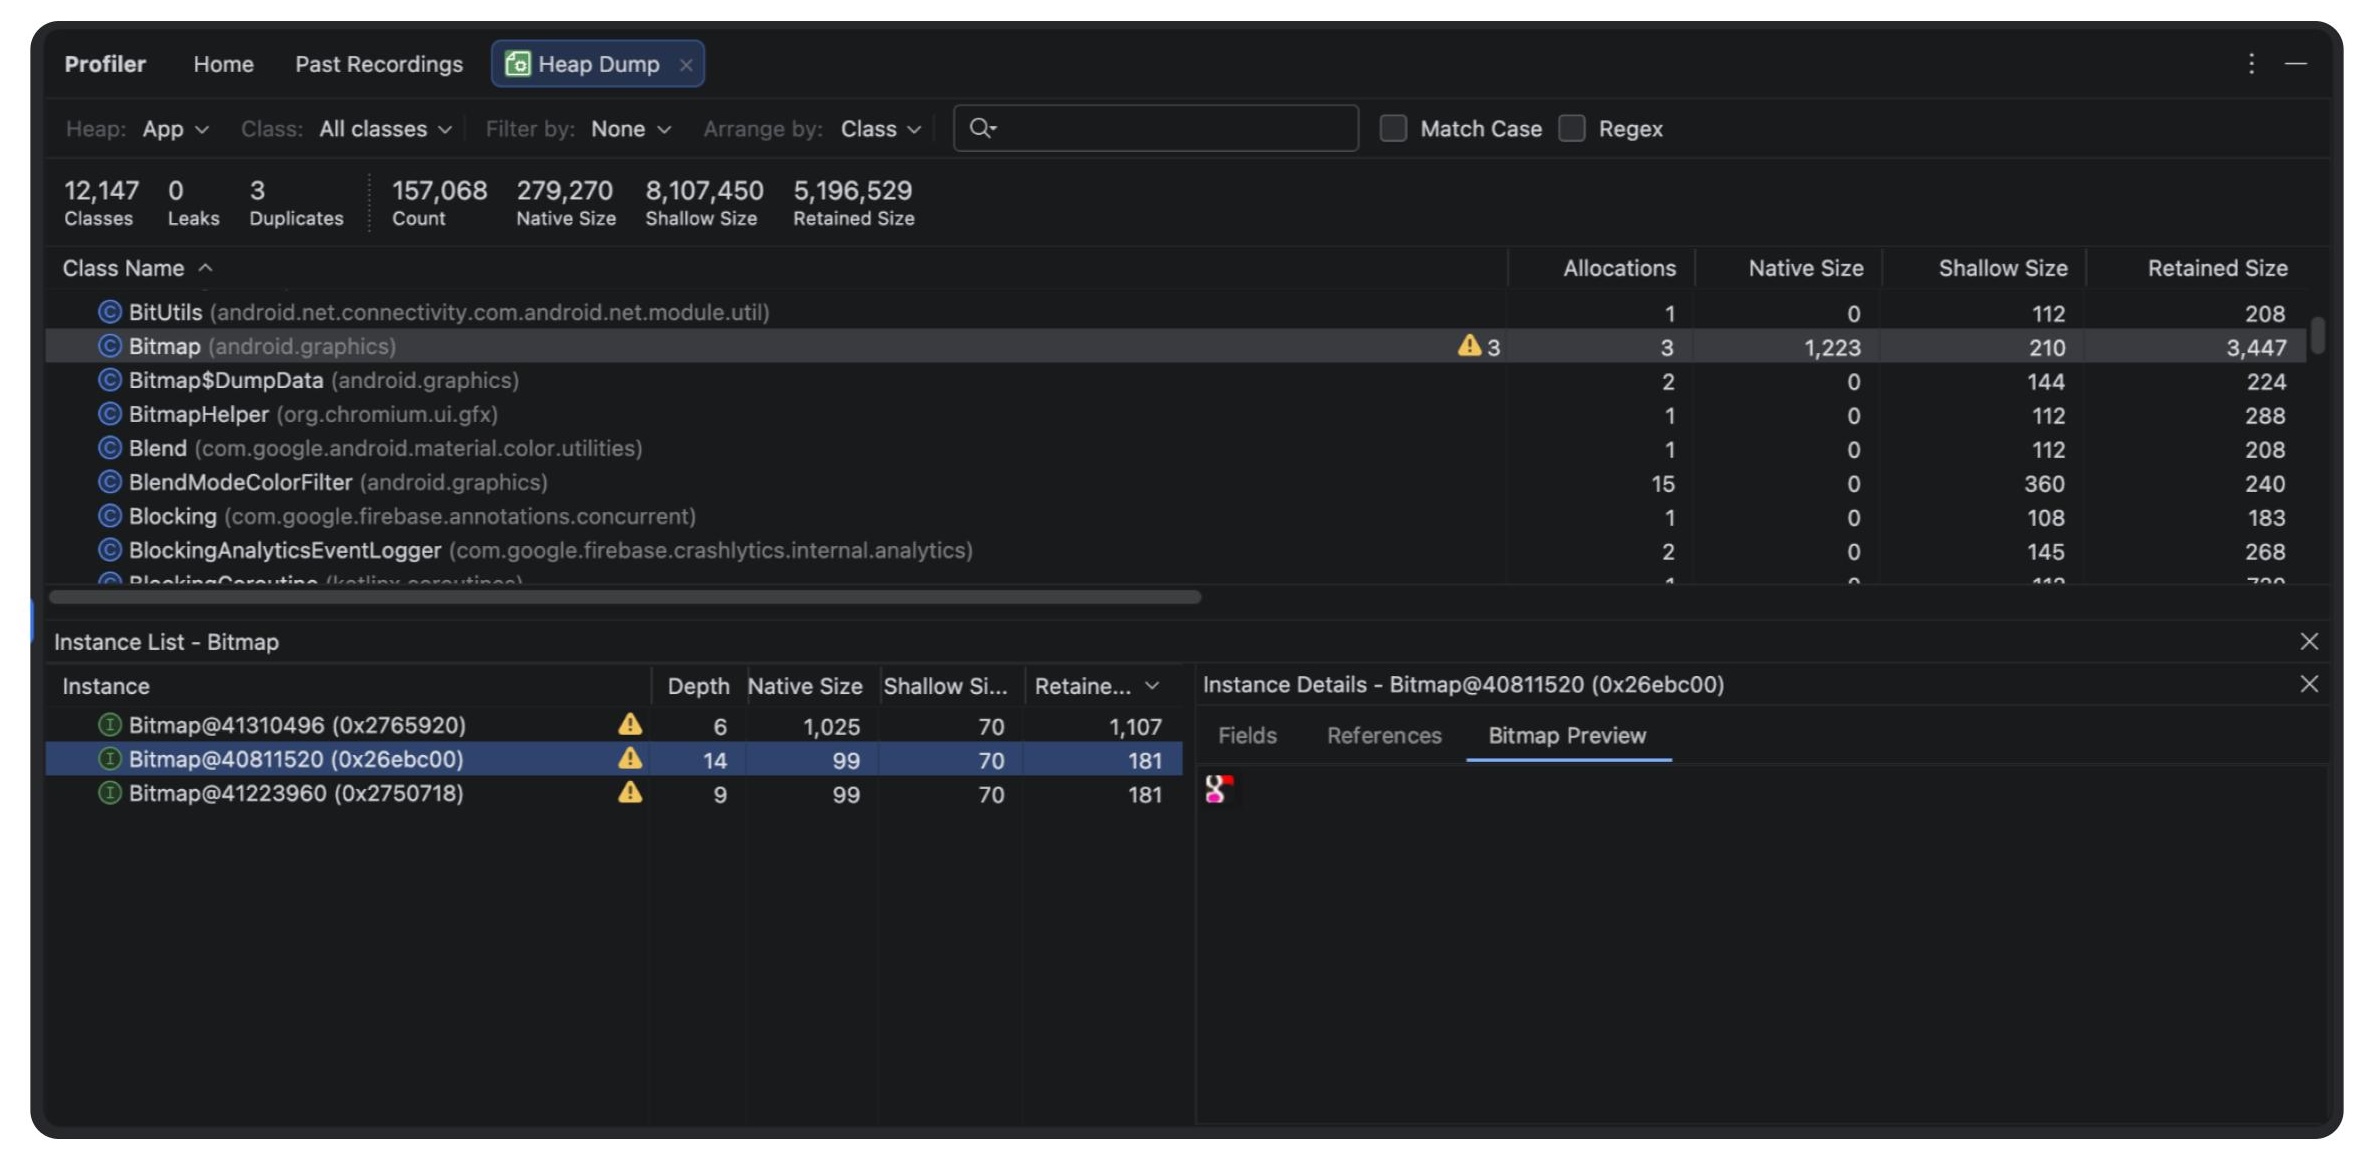
Detect duplicate bitmaps
You can also detect redundant bitmaps in the Heap Dump view starting with Android Studio Narwhal 4.
Here is how to hunt them down:
- Open the Profiler tab in Android Studio
- Click Heap Dump (or Analyze Memory Usage) and click record to take a snapshot of your app's current memory state.
- Scan the analysis results for the yellow warning triangle ⚠️, which
Android Studio uses to flag duplicate bitmaps being stored multiple times.
- Alternatively, navigate to the profiler header, choose Filter by: and pick the Duplicate Bitmaps setting.
- Click any flagged entry to open the Bitmap Preview pane, allowing you to see exactly which image is the repeat offender.
- Use that visual confirmation to track down the redundant loading logic in your code and implement a better caching strategy.
Find memory leaks
To quickly filter to classes that might be associated with memory leaks, open
the class drop-down and select Show activity/fragment leaks. Android Studio
shows classes that it thinks indicate memory leaks for
Activity and
Fragment instances in your app.
To look for memory leaks more manually, browse the class and instance lists to find objects with large Retained Size. Look for memory leaks caused by any of the following:
- Long-lived references to
ActivityorContextthat can leak the hosted Compose composition graph (such as theComposeViewand its sub-composables). - Leaking Jetpack Compose State objects (
MutableState), state holders, or lambdas that captureContext. - Forgetting to clean up listeners or observers in the
onDisposeblock of aDisposableEffect. - Non-static inner classes, such as a
Runnable, that can hold anActivityinstance. - Caches that hold objects longer than necessary.
When you find potential memory leaks, use the Fields and References tabs in Instance Details to jump to the instance or source code line of interest.
Trigger memory leaks for testing
To analyze memory usage, you should stress your app code and try forcing memory leaks. One way to provoke memory leaks in your app is to let it run for a while before inspecting the heap. Leaks might trickle up to the top of the allocations in the heap. However, the smaller the leak, the longer you need to run the app in order to see it.
You can also trigger a memory leak in one of the following ways:
- Rotate the device from portrait to landscape and back again multiple times
while in different activity states. Rotating the device can often cause an app
to leak an
Activity(and consequently its hosted Compose UI tree and associated state trees) if your app holds a reference to theActivityorContextinside asynchronous operations or state holders. - Switch between your app and another app while in different activity states. For example, navigate to the home screen, then return to your app.
Export and import a heap dump recording
You can
export and import a heap dump
file from the Past Recordings tab in the profiler. Android Studio saves the
recording as an .hprof file.
Alternatively, to use a different .hprof file analyzer like
jhat,
you need to convert the .hprof file from Android format to the Java SE
.hprof file format. To convert the file format, use the hprof-conv tool
provided in the {android_sdk}/platform-tools/ directory. Run the hprof-conv
command with two arguments: the original .hprof filename and the location to
write the converted .hprof file, including the new .hprof filename. For
example:
hprof-conv heap-original.hprof heap-converted.hprof