कोड को चलाने, डीबग करने या टेस्ट करने के दौरान, Android Studio, रन/डीबग कॉन्फ़िगरेशन का इस्तेमाल करता है. इससे यह तय किया जाता है कि ऑपरेशन कैसे किया जाए. आम तौर पर, ऐप्लिकेशन को चलाने या डीबग करने के लिए, शुरुआत में बनाया गया कॉन्फ़िगरेशन काफ़ी होता है. हालांकि, इस पेज पर बताए गए तरीके से, कॉन्फ़िगरेशन में बदलाव किया जा सकता है और नए कॉन्फ़िगरेशन बनाए जा सकते हैं. साथ ही, कॉन्फ़िगरेशन टेंप्लेट में बदलाव करके, उन्हें अपनी डेवलपमेंट प्रोसेस के हिसाब से बनाया जा सकता है.
ज़्यादा जानकारी के लिए, IntelliJ का यह दस्तावेज़ भी देखें:
रन/डीबग कॉन्फ़िगरेशन के बारे में जानकारी
रन/डीबग कॉन्फ़िगरेशन में, ऐप्लिकेशन इंस्टॉल करने, लॉन्च करने, और टेस्ट करने के विकल्पों जैसी जानकारी दी जाती है. आपके पास कॉन्फ़िगरेशन को एक बार इस्तेमाल करने के लिए सेट करने का विकल्प होता है. इसके अलावा, इसे आने वाले समय में इस्तेमाल करने के लिए सेव भी किया जा सकता है. सेव करने के बाद, टूलबार में मौजूद रन/डीबग कॉन्फ़िगरेशन चुनें ड्रॉप-डाउन सूची से कॉन्फ़िगरेशन चुना जा सकता है. Android Studio, कॉन्फ़िगरेशन को प्रोजेक्ट के हिस्से के तौर पर सेव करता है.
शुरुआत में बनाया गया रन/डीबग कॉन्फ़िगरेशन
पहली बार कोई प्रोजेक्ट बनाने पर, Android Studio, Android ऐप्लिकेशन टेंप्लेट के आधार पर, मुख्य ऐक्टिविटी के लिए रन/डीबग कॉन्फ़िगरेशन बनाता है. अपने प्रोजेक्ट को चलाने या डीबग करने के लिए, आपके पास हमेशा कम से कम एक रन/डीबग कॉन्फ़िगरेशन होना चाहिए. इसलिए, हमारा सुझाव है कि आप शुरू में बनाए गए कॉन्फ़िगरेशन को न मिटाएं.
प्रोजेक्ट का स्कोप और वर्शन कंट्रोल
रन/डीबग कॉन्फ़िगरेशन और टेंप्लेट में किए गए बदलाव, सिर्फ़ मौजूदा प्रोजेक्ट पर लागू होते हैं. वर्शन कंट्रोल सिस्टम के ज़रिए, रन/डीबग कॉन्फ़िगरेशन (लेकिन टेंप्लेट नहीं) शेयर किया जा सकता है. कॉन्फ़िगरेशन शेयर करने के तरीके के बारे में ज़्यादा जानने के लिए, कॉन्फ़िगरेशन के विकल्पों को नाम देना और उन्हें शेयर करना लेख पढ़ें.
'रन/डीबग कॉन्फ़िगरेशन' डायलॉग बॉक्स खोलना
रन/डीबग कॉन्फ़िगरेशन डायलॉग खोलने के लिए, रन करें > कॉन्फ़िगरेशन में बदलाव करें को चुनें. आपको Run/Debug Configurations डायलॉग दिखेगा. यह पहली इमेज में दिखाया गया है.
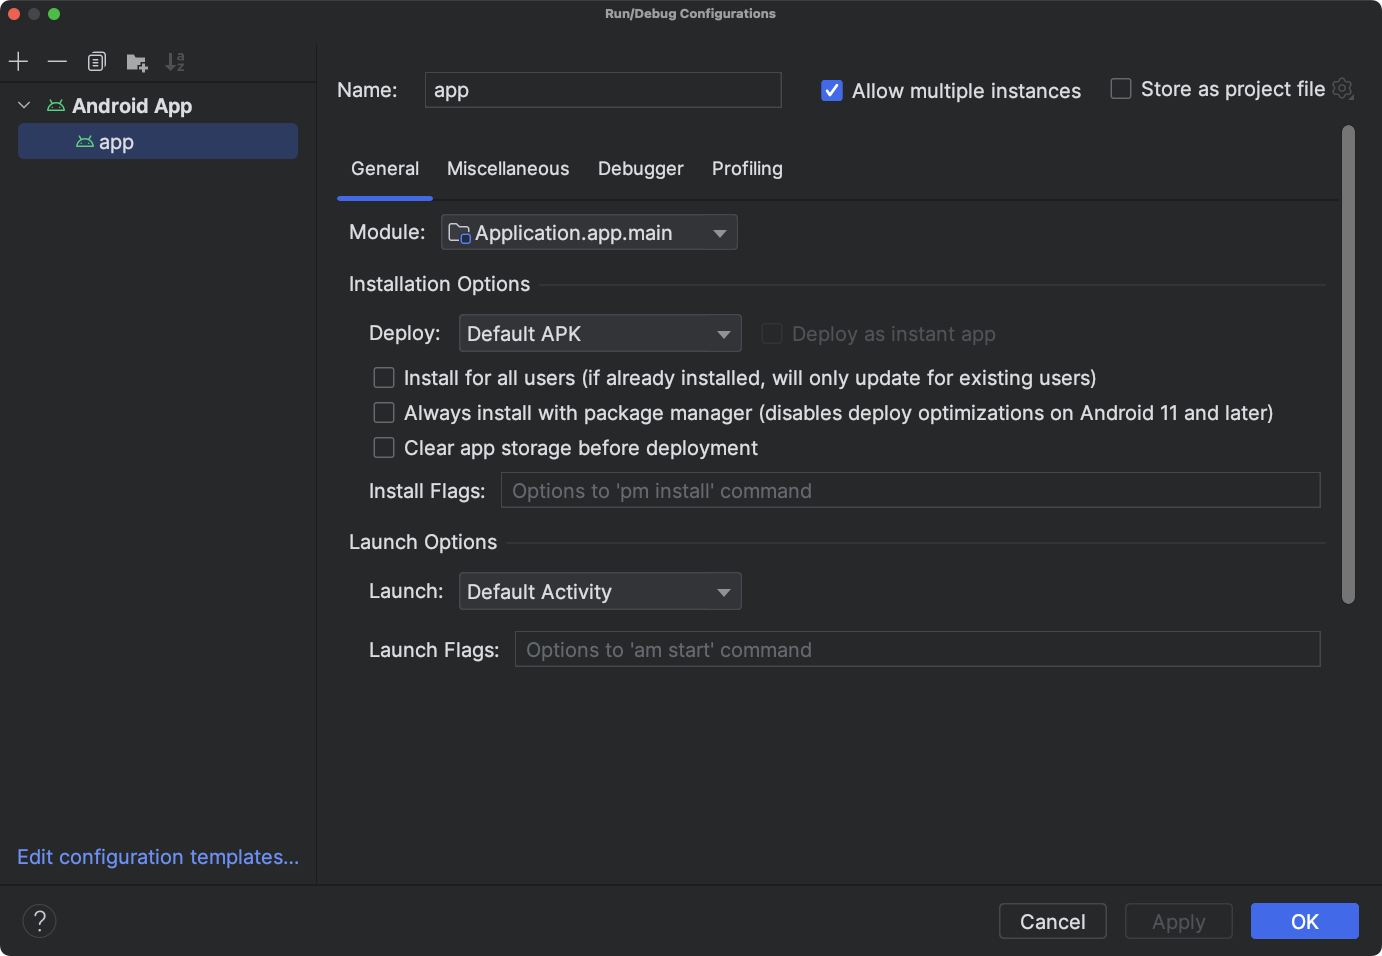
पहली इमेज. रन/डीबग कॉन्फ़िगरेशन डायलॉग
डायलॉग के बाईं ओर मौजूद पैनल में, आपके तय किए गए कॉन्फ़िगरेशन को टेंप्लेट टाइप के हिसाब से ग्रुप किया जाता है. साथ ही, सबसे नीचे कॉन्फ़िगरेशन टेंप्लेट में बदलाव करने का विकल्प मिलता है. चुने गए कॉन्फ़िगरेशन में, दाईं ओर मौजूद पैनल में जाकर बदलाव किया जा सकता है. छुपे हुए आइटम देखने के लिए, डायलॉग का साइज़ बदलें.
इस डायलॉग बॉक्स में, ये काम किए जा सकते हैं:
- नए रन/डीबग कॉन्फ़िगरेशन बनाएं.
- रन/डीबग कॉन्फ़िगरेशन में बदलाव करें.
- कॉन्फ़िगरेशन टेंप्लेट में बदलाव करें.
- कॉन्फ़िगरेशन को क्रम से लगाएं और ग्रुप करें.
नया रन/डीबग कॉन्फ़िगरेशन बनाना
रन/डीबग कॉन्फ़िगरेशन डायलॉग, प्रोजेक्ट विंडो या कोड एडिटर से नए रन/डीबग कॉन्फ़िगरेशन तय किए जा सकते हैं. नया कॉन्फ़िगरेशन, कॉन्फ़िगरेशन टेंप्लेट पर आधारित होना चाहिए.
'रन/डीबग कॉन्फ़िगरेशन' डायलॉग में, आपके रन/डीबग कॉन्फ़िगरेशन और उपलब्ध कॉन्फ़िगरेशन टेंप्लेट दिखते हैं. किसी टेंप्लेट से या किसी दूसरे कॉन्फ़िगरेशन की कॉपी से, नया कॉन्फ़िगरेशन शुरू किया जा सकता है. इसके बाद, फ़ील्ड की वैल्यू में अपनी ज़रूरत के हिसाब से बदलाव किया जा सकता है.
इसके अलावा, प्रोजेक्ट विंडो में किसी आइटम पर राइट क्लिक करके, उस आइटम के लिए अपने-आप कॉन्फ़िगरेशन बनाया जा सकता है. उदाहरण के लिए, अगर आपको कोई गतिविधि चलानी है, तो गतिविधि की Java फ़ाइल पर राइट क्लिक करें और चलाएं को चुनें. आइटम के हिसाब से, Android Studio कॉन्फ़िगरेशन बनाने के लिए, Android ऐप्लिकेशन, Android इंस्ट्रूमेंटेड टेस्ट या JUnit कॉन्फ़िगरेशन टेंप्लेट का इस्तेमाल करता है.
कोड एडिटर में, किसी क्लास या तरीके के लिए टेस्ट और रन/डीबग कॉन्फ़िगरेशन आसानी से बनाया जा सकता है. इसके बाद, इसे लागू किया जा सकता है.
Run/Debug Configurations डायलॉग के बाहर कॉन्फ़िगरेशन बनाने पर, वह कॉन्फ़िगरेशन अस्थायी होता है. हालांकि, इसे सेव किया जा सकता है. डिफ़ॉल्ट रूप से, Android Studio के प्रोजेक्ट में ज़्यादा से ज़्यादा पांच टेंपररी कॉन्फ़िगरेशन हो सकते हैं. इसके बाद, Android Studio उन्हें हटाना शुरू कर देता है. इस डिफ़ॉल्ट सेटिंग को बदलने के लिए, Android Studio की सेटिंग खोलें. इसके बाद, ऐडवांस सेटिंग > रन/डीबग > टेंपररी कॉन्फ़िगरेशन की सीमा को बदलें. कुछ समय के लिए कॉन्फ़िगरेशन के बारे में ज़्यादा जानकारी के लिए, कुछ समय के लिए रन/डीबग कॉन्फ़िगरेशन बनाना और सेव करना लेख पढ़ें.
टेंप्लेट के आधार पर कॉन्फ़िगरेशन शुरू करना
किसी टेंप्लेट के आधार पर रन/डीबग कॉन्फ़िगरेशन तय करने के लिए, यह तरीका अपनाएं:
- रन/डीबग कॉन्फ़िगरेशन डायलॉग बॉक्स खोलें.
- Add New Configuration
 पर क्लिक करें.
- कोई कॉन्फ़िगरेशन टेंप्लेट चुनें.
- नाम फ़ील्ड में कोई नाम डालें.
- ज़रूरत के मुताबिक कॉन्फ़िगरेशन में बदलाव करें.
- लागू करें या ठीक है पर क्लिक करें.
डायलॉग बॉक्स में सबसे नीचे दिख रही सभी गड़बड़ियों को ठीक करें.
कॉपी किए गए कॉन्फ़िगरेशन से नया कॉन्फ़िगरेशन शुरू करना
किसी अन्य कॉन्फ़िगरेशन की कॉपी से शुरू होने वाले रन/डीबग कॉन्फ़िगरेशन को तय करने के लिए, यह तरीका अपनाएं:
- रन/डीबग कॉन्फ़िगरेशन डायलॉग बॉक्स खोलें.
- बाएं पैनल में, मौजूदा रन/डीबग कॉन्फ़िगरेशन चुनें.
- कॉन्फ़िगरेशन कॉपी करें
 पर क्लिक करें.
- नाम फ़ील्ड में कोई नाम डालें.
- ज़रूरत के मुताबिक कॉन्फ़िगरेशन में बदलाव करें.
- लागू करें या ठीक है पर क्लिक करें.
डायलॉग बॉक्स में सबसे नीचे दिख रही गड़बड़ियों को ठीक करना न भूलें.
प्रोजेक्ट में मौजूद किसी आइटम के लिए कॉन्फ़िगरेशन तय करना
Android Studio, प्रोजेक्ट विंडो में दिखाए गए कुछ आइटम के लिए, रन/डीबग कॉन्फ़िगरेशन बना सकता है. कॉन्फ़िगरेशन, कॉन्फ़िगरेशन टेंप्लेट पर आधारित होता है. यह इस तरह से काम करता है:
- गतिविधि की Java फ़ाइल: Android ऐप्लिकेशन टेंप्लेट.
- पैकेज: Android इंस्ट्रूमेंटेड टेस्ट या Android JUnit टेंप्लेट. यह आपके सोर्स सेट पर निर्भर करता है. इंस्ट्रुमेंटेड टेस्ट चुनने पर, Android इंस्ट्रुमेंटेड टेस्ट टेंप्लेट का इस्तेमाल किया जाता है. लोकल यूनिट टेस्ट चुनने पर, Android JUnit टेंप्लेट का इस्तेमाल किया जाता है. लोकल यूनिट टेस्ट के लिए, कोड कवरेज के साथ टेस्ट चलाया जा सकता है. हालांकि, ऐसा करना ज़रूरी नहीं है. ज़्यादा जानकारी के लिए, कोड कवरेज देखें.
अपने प्रोजेक्ट में किसी आइटम के लिए, रन/डीबग कॉन्फ़िगरेशन बनाने के लिए, यह तरीका अपनाएं:
- Android या प्रोजेक्ट व्यू में कोई प्रोजेक्ट खोलें.
- प्रोजेक्ट विंडो में, जांच किए जा सकने वाले किसी आइटम पर राइट क्लिक करें. इसके बाद, चलाएं filename या डीबग करें filename में से कोई एक विकल्प चुनें. Android Studio, कुछ समय के लिए रन/डीबग कॉन्फ़िगरेशन बनाता है और आपका ऐप्लिकेशन लॉन्च करता है.
- टूलबार में, रन/डीबग कॉन्फ़िगरेशन चुनें ड्रॉप-डाउन सूची खोलें.
- जिस कॉन्फ़िगरेशन को सेव करना है उसके बगल में मौजूद विकल्पों में से, कॉन्फ़िगरेशन सेव करें को चुनें.
दूसरी इमेज. कॉन्फ़िगरेशन सेव करना
ध्यान दें: अगर आपने किसी आइटम (लेकिन किसी गतिविधि को नहीं) पर राइट क्लिक करके उसे चलाया या डीबग किया, तो Android Studio एक नया कॉन्फ़िगरेशन बनाएगा.
किसी क्लास या तरीके के लिए टेस्ट कॉन्फ़िगरेशन तय करना
Android Studio की मदद से, किसी क्लास या तरीके के लिए टेस्ट रन कॉन्फ़िगरेशन तय किया जा सकता है. इसके बाद, उसे लागू किया जा सकता है. उदाहरण के लिए, अगर आपने कोई नई क्लास बनाई है, तो उसके लिए टेस्ट बनाया और चलाया जा सकता है. अगर टेस्ट पास हो जाता है, तो प्रोजेक्ट के बाकी हिस्से के लिए टेस्ट चलाएं. इससे यह पक्का किया जा सकेगा कि आपके नए कोड से, प्रोजेक्ट के किसी दूसरे हिस्से में कोई गड़बड़ी नहीं हुई है.
Android Studio, आपके सोर्स सेट के आधार पर, Android इंस्ट्रूमेंटेड टेस्ट या Android JUnit टेंप्लेट का इस्तेमाल करता है. लोकल यूनिट टेस्ट के लिए, कोड कवरेज का इस्तेमाल किया जा सकता है. हालांकि, यह ज़रूरी नहीं है.
अपने Java कोड में किसी क्लास या तरीके के लिए, रन/डीबग कॉन्फ़िगरेशन बनाने के लिए, यह तरीका अपनाएं:
- Android या प्रोजेक्ट व्यू में कोई प्रोजेक्ट खोलें.
- कोड एडिटर में कोई Java फ़ाइल खोलें.
- कोड में कोई क्लास या तरीका चुनें. इसके बाद, Control+Shift+T (Command+Shift+T) दबाएं.
- इसके बाद, दिख रहे मेन्यू में जाकर, नया टेस्ट बनाएं को चुनें.
- टेस्ट बनाएं डायलॉग में, वैल्यू बदलें या सेट करें. इसके बाद, ठीक है पर क्लिक करें.
- डेस्टिनेशन डायरेक्ट्री चुनें डायलॉग बॉक्स में, चुनें कि आपको Android Studio में टेस्ट को प्रोजेक्ट में कहां रखना है. डायरेक्ट्री स्ट्रक्चर या आस-पास की क्लास चुनकर, जगह की जानकारी दी जा सकती है.
- ठीक है पर क्लिक करें.
नया टेस्ट, संबंधित टेस्ट source set की प्रोजेक्ट विंडो में दिखता है.
- जांच करने के लिए, इनमें से कोई एक काम करें:
- प्रोजेक्ट विंडो में, टेस्ट पर राइट क्लिक करें और चलाएं या डीबग करें को चुनें.
- कोड एडिटर में, टेस्ट फ़ाइल में मौजूद क्लास की परिभाषा या तरीके के नाम पर राइट क्लिक करें. इसके बाद, क्लास में मौजूद सभी तरीकों को टेस्ट करने के लिए, चलाएं या डीबग करें को चुनें.
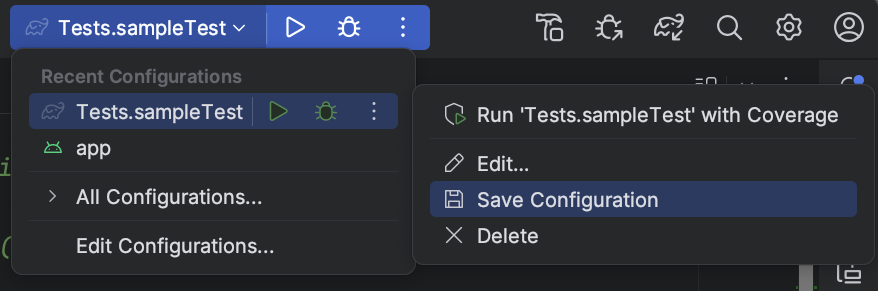
- टूलबार में, रन/डीबग कॉन्फ़िगरेशन चुनें ड्रॉप-डाउन सूची खोलें.
- जिस कॉन्फ़िगरेशन को सेव करना है उसके बगल में मौजूद विकल्पों में से, कॉन्फ़िगरेशन सेव करें को चुनें.
तीसरी इमेज. कॉन्फ़िगरेशन सेव करना
सेव किए गए कॉन्फ़िगरेशन का इस्तेमाल करके, किसी ऐप्लिकेशन को चलाना या उसे डीबग करना
अगर आपने रन/डीबग कॉन्फ़िगरेशन सेव किया है, तो ऐप्लिकेशन को रन या डीबग करने से पहले उसे चुना जा सकता है.
सेव किए गए रन/डीबग कॉन्फ़िगरेशन का इस्तेमाल करने के लिए, यह तरीका अपनाएं:
- टूलबार में मौजूद, रन/डीबग कॉन्फ़िगरेशन चुनें ड्रॉप-डाउन सूची से रन/डीबग कॉन्फ़िगरेशन चुनें.
- चलाएं > चलाएं या चलाएं > डीबग करें को चुनें.
ड्रॉप-डाउन सूची, चलाएं
 और डीबग करें
 के बाईं ओर होती है. उदाहरण के लिए,
  .
.
इसके अलावा, चलाएं या डीबग करें
पर क्लिक करें.
रन/डीबग कॉन्फ़िगरेशन में बदलाव करना
रन/डीबग कॉन्फ़िगरेशन में बदलाव करने के लिए, यह तरीका अपनाएं:
- रन/डीबग कॉन्फ़िगरेशन डायलॉग बॉक्स खोलें.
- बाएं पैनल में कोई कॉन्फ़िगरेशन चुनें.
- ज़रूरत के मुताबिक कॉन्फ़िगरेशन में बदलाव करें.
- लागू करें या ठीक है पर क्लिक करें.
डायलॉग बॉक्स में सबसे नीचे दिख रही गड़बड़ियों को ठीक करना न भूलें.
रन/डीबग कॉन्फ़िगरेशन टेंप्लेट में बदलाव करना
Android Studio की ओर से उपलब्ध कराए गए कॉन्फ़िगरेशन टेंप्लेट में बदलाव किया जा सकता है, ताकि वे आपकी डेवलपमेंट प्रोसेस के हिसाब से काम करें. टेंप्लेट में बदलाव करने पर, इससे उन मौजूदा कॉन्फ़िगरेशन पर कोई असर नहीं पड़ता जिनमें टेंप्लेट का इस्तेमाल किया जाता है. उदाहरण के लिए, अगर आपको किसी खास तरह के कई कॉन्फ़िगरेशन बनाने हैं, तो टेंप्लेट में बदलाव किया जा सकता है. इसके बाद, काम पूरा होने पर उसे वापस पहले जैसा किया जा सकता है.
हालांकि, नए टेंप्लेट नहीं बनाए जा सकते. हालांकि, टेंप्लेट की तरह इस्तेमाल करने के लिए कॉन्फ़िगरेशन बनाए जा सकते हैं. नए कॉन्फ़िगरेशन बनाने के लिए, किसी कॉन्फ़िगरेशन को कॉपी करें और कॉपी किए गए कॉन्फ़िगरेशन में बदलाव करें.
किसी टेंप्लेट में बदलाव करने के लिए, यह तरीका अपनाएं:
- रन/डीबग कॉन्फ़िगरेशन डायलॉग बॉक्स खोलें.
- कॉन्फ़िगरेशन टेंप्लेट में बदलाव करें... पर क्लिक करें.
- कॉन्फ़िगरेशन टेंप्लेट चुनें.
- ज़रूरत के मुताबिक कॉन्फ़िगरेशन में बदलाव करें.
- लागू करें या ठीक है पर क्लिक करें.
डायलॉग बॉक्स में सबसे नीचे दिख रही गड़बड़ियों को ठीक करना न भूलें.
क्रम से लगाने और ग्रुप बनाने की कॉन्फ़िगरेशन
Run/Debug Configurations डायलॉग में, कॉन्फ़िगरेशन को क्रम से लगाया जा सकता है, ताकि उन्हें आसानी से ढूंढा जा सके. फ़ोल्डर में मौजूद आइटम को वर्णमाला के क्रम में लगाया जा सकता है. साथ ही, कॉन्फ़िगरेशन को ग्रुप करने के लिए नए फ़ोल्डर बनाए जा सकते हैं.
कॉन्फ़िगरेशन को वर्णमाला के क्रम में लगाने के लिए, यह तरीका अपनाएं:
- रन/डीबग कॉन्फ़िगरेशन डायलॉग बॉक्स खोलें.
- वह फ़ोल्डर चुनें जिसमें कॉन्फ़िगरेशन शामिल हैं.
- कॉन्फ़िगरेशन क्रम से लगाएं
 पर क्लिक करें.
- डायलॉग बॉक्स बंद करने के लिए, ठीक है पर क्लिक करें.
कॉन्फ़िगरेशन को फ़ोल्डर में ग्रुप करने के लिए, यह तरीका अपनाएं:
- रन/डीबग कॉन्फ़िगरेशन डायलॉग बॉक्स खोलें.
- वह फ़ोल्डर चुनें जिसमें कॉन्फ़िगरेशन शामिल हैं.
- नया फ़ोल्डर बनाएं
 पर क्लिक करें.
- फ़ोल्डर का नाम फ़ील्ड में कोई नाम डालें.
- नाम सेव करने के लिए, लागू करें पर क्लिक करें.
लॉन्च से पहले की जाने वाली कार्रवाइयों के बारे में जानकारी देना
रन/डीबग कॉन्फ़िगरेशन लागू करने से पहले, टास्क तय किए जा सकते हैं. टास्क उसी क्रम में पूरे किए जाते हैं जिस क्रम में वे सूची में दिखते हैं.
ध्यान दें: लॉन्च से पहले के टास्क तय करना, ऐडवांस सुविधा है. इस सुविधा का इस्तेमाल करने के बजाय, हमारा सुझाव है कि आप तैयारी से जुड़े किसी भी लॉजिक को अपनी build.gradle फ़ाइल में टास्क के तौर पर डालें, ताकि कमांड लाइन से बिल्ड करते समय उन्हें लागू किया जा सके.
काम की सूची बनाने के लिए, यह तरीका अपनाएं:
- लॉन्च से पहले में जाकर, Run/Debug Configurations डायलॉग बॉक्स में सबसे नीचे (आपको नीचे की ओर स्क्रोल करना पड़ सकता है), Add पर क्लिक करें और टास्क का टाइप चुनें. अगर कोई डायलॉग बॉक्स खुलता है, तो फ़ील्ड में जानकारी भरें और ठीक है पर क्लिक करें.
- ज़रूरत के मुताबिक और टास्क जोड़ें.
- टास्क का क्रम बदलने के लिए, उन्हें खींचें और छोड़ें या कोई टास्क चुनें और सूची में उसे ऊपर या नीचे ले जाने के लिए, ऊपर
 और नीचे
 पर क्लिक करें.
 - अगर आपको रन/डीबग कॉन्फ़िगरेशन सेटिंग लागू करने से पहले उन्हें दिखाना है, तो यह पेज दिखाएं को चुनें.
यह विकल्प डिफ़ॉल्ट रूप से अनचेक होता है.
- अगर आपको ऐप्लिकेशन को चलाने या डीबग करने पर, Run या Debug टूल विंडो को चालू करना है, तो Active tool window को चुनें.
यह विकल्प डिफ़ॉल्ट रूप से चुना हुआ होता है.
सूची से किसी टास्क को हटाने के लिए, यह तरीका अपनाएं:
- कोई टास्क चुनें.
- हटाएं
 पर क्लिक करें.
किसी टास्क में बदलाव करने के लिए, यह तरीका अपनाएं:
- कोई टास्क चुनें.
- बदलाव करें
 पर क्लिक करें.
- खुले हुए डायलॉग बॉक्स में, टास्क की सेटिंग में बदलाव करें. इसके बाद, ठीक है पर क्लिक करें.
यहां दी गई टेबल में, जोड़े जा सकने वाले टास्क की सूची दी गई है.
| टास्क | ब्यौरा |
|---|---|
| बाहरी टूल चलाना | Android Studio से बाहर का कोई ऐप्लिकेशन चलाएं. बाहरी टूल डायलॉग में, एक या उससे ज़्यादा ऐसे ऐप्लिकेशन चुनें जिन्हें आपको चलाना है. इसके बाद, ठीक है पर क्लिक करें. अगर ऐप्लिकेशन को अब तक Android Studio में तय नहीं किया गया है, तो बनाने के टूल डायलॉग में जाकर, ऐप्लिकेशन की डेफ़िनिशन जोड़ें. ज़्यादा जानकारी के लिए, तीसरे पक्ष के टूल कॉन्फ़िगर करना और बाहरी टूल लेख पढ़ें. |
| कोई दूसरा कॉन्फ़िगरेशन चलाना | मौजूदा रन/डीबग कॉन्फ़िगरेशन में से किसी एक को लागू करें. लागू करने के लिए कॉन्फ़िगरेशन चुनें डायलॉग में, लागू करने के लिए कोई कॉन्फ़िगरेशन चुनें. इसके बाद, ठीक है पर क्लिक करें. |
| ब्रैंड | प्रोजेक्ट या मॉड्यूल को कंपाइल करें. अगर रन/डीबग कॉन्फ़िगरेशन में कोई खास मॉड्यूल तय किया गया है, तो Android Studio, Make Module command को एक्ज़ीक्यूट करता है. अगर कोई मॉड्यूल तय नहीं किया गया है, तो यह Make Project command को एक्ज़ीक्यूट करता है. |
| प्रोजेक्ट बनाएं | प्रोजेक्ट को कंपाइल करें. Android Studio, मेक प्रोजेक्ट कमांड को लागू करता है. |
| बनाओ, गड़बड़ी की जांच नहीं करनी है | यह विकल्प, बनाएं विकल्प जैसा ही है. हालांकि, Android Studio, कंपाइल करने के नतीजे के बावजूद रन/डीबग कॉन्फ़िगरेशन को लागू करता है. |
| आर्टफ़ैक्ट बनाना | Android Studio में काम नहीं करता. |
| Gradle टास्क रन करना | Gradle टास्क चलाएं. खुलने वाले डायलॉग बॉक्स में, जानकारी डालें. इसके बाद, ठीक है पर क्लिक करें. ज़्यादा जानकारी के लिए, Gradle देखें. |
| Gradle-aware Make | प्रोजेक्ट को कंपाइल करें और Gradle चलाएं. |
| App Engine Gradle बिल्डर | App Engine Gradle बिल्डर टास्क, प्रोजेक्ट को सिंक करता है. इसके बाद, मॉड्यूल बनाता है. |
कॉन्फ़िगरेशन टेंप्लेट
Android Studio में कॉन्फ़िगरेशन टेंप्लेट उपलब्ध होते हैं. इनकी मदद से, कॉन्फ़िगरेशन को तुरंत सेट अप किया जा सकता है. यहां दिए गए सेक्शन में, उन टेंप्लेट के बारे में बताया गया है जो Android Studio के साथ Android डेवलपमेंट पर लागू होते हैं:
ध्यान दें: Android Studio 2.1.x और इससे पहले के वर्शन में, नेटिव ऐप्लिकेशन टेंप्लेट होता था. हालांकि, नए वर्शन में यह टेंप्लेट नहीं होता. अगर आपके प्रोजेक्ट में कोई नेटिव ऐप्लिकेशन टेंप्लेट है, तो प्रोजेक्ट लोड करने पर Android Studio उसे Android ऐप्लिकेशन में बदल देता है. प्रोजेक्ट बदलें डायलॉग बॉक्स में, आपको इस प्रोसेस के बारे में बताया जाता है.
काम न करने वाले टेंप्लेट
यहां दिए गए टेंप्लेट, IntelliJ IDEA से लिए गए हैं. इनका इस्तेमाल Android Studio में Android ऐप्लिकेशन बनाने के लिए नहीं किया जा सकता. इन टेंप्लेट का इस्तेमाल करने के बारे में जानकारी पाने के लिए, IntelliJ IDEA के दस्तावेज़ के लिंक पर जाएं.
- ऐप्लिकेशन
- कंपाउंड
- Gradle
- Groovy
- JAR Application
- Java Scratch
- JUnit
- Kotlin
- Kotlin Script
- रिमोट डीबग
- शेल स्क्रिप्ट
- TestNG
कॉन्फ़िगरेशन के सामान्य विकल्प
नाम, पैरलल रन की अनुमति दें, और प्रोजेक्ट फ़ाइल के तौर पर सेव करें विकल्प, कई कॉन्फ़िगरेशन टेंप्लेट में एक जैसे होते हैं. इनके बारे में ज़्यादा जानने के लिए, सामान्य सेटिंग लेख पढ़ें.
Android Studio, शेयर किए गए रन/डीबग कॉन्फ़िगरेशन को अलग-अलग एक्सएमएल फ़ाइलों में सेव करता है. ये फ़ाइलें, project_directory/.idea/runConfigurations/ फ़ोल्डर में होती हैं.
ज़्यादा जानकारी के लिए, IntelliJ प्रोजेक्ट के दस्तावेज़ में डायरेक्ट्री पर आधारित फ़ॉर्मैट देखें.
Android ऐप्लिकेशन
इस टेंप्लेट पर आधारित कॉन्फ़िगरेशन का इस्तेमाल करके, वर्चुअल या हार्डवेयर डिवाइसों पर Android ऐप्लिकेशन और गतिविधियों को चलाया या डीबग किया जा सकता है.
सामान्य टैब
सामान्य टैब में, इंस्टॉल करने, लॉन्च करने, और डिप्लॉय करने के विकल्प तय किए जा सकते हैं. अन्य टैब में, इंस्टॉलेशन के विकल्प भी होते हैं.
| फ़ील्ड | ब्यौरा |
|---|---|
| मॉड्यूल | वह मॉड्यूल चुनें जिस पर यह कॉन्फ़िगरेशन लागू करना है. |
| इंस्टॉल करने के विकल्प: डिप्लॉय करें | कोई विकल्प चुनें:
|
| इंस्टॉल करने के विकल्प: इंस्टैंट ऐप्लिकेशन के तौर पर डिप्लॉय करें | अगर आपका ऐप्लिकेशन इंस्टैंट एक्सपीरियंस की सुविधा के साथ काम करता है, तो नया प्रोजेक्ट बनाते समय इंस्टैंट ऐप्लिकेशन के लिए सहायता जोड़ने का विकल्प चुनें. इसके अलावा, एक या उससे ज़्यादा झटपट खुलने वाले फ़ीचर मॉड्यूल बनाएं. इसके बाद, इंस्टेंट ऐप्लिकेशन के तौर पर डिप्लॉय करें के बगल में मौजूद बॉक्स पर सही का निशान लगाकर, झटपट खुलने वाले मॉड्यूल डिप्लॉय किए जा सकते हैं. |
| इंस्टॉल करने के विकल्प: डिप्लॉय की जाने वाली सुविधाएं |
अगर आपके ऐप्लिकेशन में फ़ीचर मॉड्यूल शामिल हैं, तो ऐप्लिकेशन को डिप्लॉय करते समय, आपको जिस फ़ीचर को शामिल करना है उसके बगल में मौजूद बॉक्स पर सही का निशान लगाएं. आपको यह विकल्प सिर्फ़ तब दिखेगा, जब आपके ऐप्लिकेशन में फ़ीचर मॉड्यूल शामिल हों.
ध्यान दें: अगर आपको मांग पर सुविधा मॉड्यूल डाउनलोड और इंस्टॉल करने की सुविधा की जांच करनी है, तो आपको ऐसा ऐप्लिकेशन बंडल पब्लिश करने के बाद करना होगा. इसके बाद, Play Console के इंटरनल टेस्ट ट्रैक का इस्तेमाल करें. ज़्यादा जानने के लिए, Play Console पर अपना ऐप्लिकेशन बंडल अपलोड करें लेख पढ़ें. |
| इंस्टॉल करने के विकल्प: इंस्टॉल फ़्लैग | adb pm
install के वे विकल्प टाइप करें जिनका आपको इस्तेमाल करना है. विकल्पों को उसी तरह फ़ॉर्मैट करें जिस तरह कमांड लाइन पर किया जाता है. हालांकि, इसमें पाथ शामिल नहीं होना चाहिए. यहां कुछ उदाहरण दिए गए हैं:
और
डिफ़ॉल्ट: कोई विकल्प नहीं. |
| लॉन्च करने के विकल्प: लॉन्च करें | कोई विकल्प चुनें:
|
| लॉन्च करने के विकल्प: लॉन्च फ़्लैग | adb am
start के वे विकल्प टाइप करें जिनका आपको इस्तेमाल करना है. विकल्पों को उसी तरह से फ़ॉर्मैट करें जिस तरह से कमांड लाइन पर किया जाता है. हालांकि, इसमें इंटेंट शामिल नहीं होना चाहिए. उदाहरण के लिए:
अगर आपने लॉन्च करें के लिए कुछ नहीं वैल्यू चुनी है, तो यह विकल्प नहीं दिखेगा. डिफ़ॉल्ट: कोई विकल्प नहीं. |
| डिप्लॉयमेंट टारगेट के विकल्प: टारगेट | कोई विकल्प चुनें:
|
डिप्लॉयमेंट टारगेट के विकल्प: आने वाले समय में लॉन्च होने वाले ऐप्लिकेशन के लिए, उसी डिवाइस का इस्तेमाल करें |
डिफ़ॉल्ट रूप से, यह विकल्प चुना नहीं जाता है, ताकि हर बार ऐप्लिकेशन चलाने पर, आपको डिप्लॉयमेंट चुनें डायलॉग दिखे और आप कोई डिवाइस चुन सकें. इस विकल्प को चुनने के बाद, जब कोई ऐप्लिकेशन चलाया जाता है, तब आपको डिप्लॉयमेंट चुनें डायलॉग दिखता है. इससे आपको कोई डिवाइस चुनने का विकल्प मिलता है. इसके बाद, जब भी ऐप्लिकेशन चलाया जाएगा, तो वह चुने गए डिवाइस पर लॉन्च होगा. साथ ही, आपको डिप्लॉयमेंट चुनें डायलॉग नहीं दिखेगा. किसी दूसरे डिवाइस पर ऐप्लिकेशन चलाने के लिए, अगली बार लॉन्च करने के लिए, इसी डिवाइस का इस्तेमाल करें सेलेक्ट करने का विकल्प हटाएं या चलाएं > रोकें app या रोकें  की मदद से ऐप्लिकेशन को रोकें. इसके बाद, इसे फिर से शुरू करें. आपको डिप्लॉयमेंट चुनें डायलॉग दिखेगा, ताकि कोई डिवाइस चुना जा सके. की मदद से ऐप्लिकेशन को रोकें. इसके बाद, इसे फिर से शुरू करें. आपको डिप्लॉयमेंट चुनें डायलॉग दिखेगा, ताकि कोई डिवाइस चुना जा सके.
|
| लॉन्च से पहले | लॉन्च से पहले की कार्रवाइयां तय करना लेख पढ़ें. |
अन्य टैब
अन्य टैब में, logcat, इंस्टॉलेशन, लॉन्च, और डिप्लॉयमेंट के विकल्प तय किए जा सकते हैं. सामान्य टैब में भी, इंस्टॉल करने के विकल्प मौजूद होते हैं.
| फ़ील्ड | ब्यौरा |
|---|---|
| Logcat: Show logcat automatically | इस विकल्प को चुनने पर, इस कॉन्फ़िगरेशन का इस्तेमाल करके किसी ऐप्लिकेशन को डिप्लॉय और लॉन्च करने पर, हर बार Logcat विंडो खुलती है. डिफ़ॉल्ट रूप से: चुना गया. |
| Logcat: Clear log before launch | अगर आपको Android Studio से, ऐप्लिकेशन शुरू करने से पहले लॉग फ़ाइल में मौजूद पिछले सेशन का डेटा हटाना है, तो इस विकल्प को चुनें. डिफ़ॉल्ट रूप से: यह विकल्प चुना नहीं जाता. |
| इंस्टॉल करने के विकल्प: अगर APK में कोई बदलाव नहीं हुआ है, तो इंस्टॉल करने की प्रोसेस छोड़ें. | इस विकल्प को चुनने पर, Android Studio आपके APK को फिर से डिप्लॉय नहीं करता. ऐसा तब होता है, जब उसे पता चलता है कि APK में कोई बदलाव नहीं हुआ है. अगर आपको Android Studio से APK को इंस्टॉल करने के लिए कहना है, भले ही उसमें कोई बदलाव न हुआ हो, तो इस विकल्प से सही का निशान हटाएं. डिफ़ॉल्ट: चुना गया |
| इंस्टॉल करने के विकल्प: ऐक्टिविटी लॉन्च करने से पहले, चल रहे ऐप्लिकेशन को ज़बरदस्ती रोकें | इस विकल्प को चुनने पर, Android Studio को यह पता चलता है कि APK को फिर से इंस्टॉल करने की ज़रूरत नहीं है, क्योंकि इसमें कोई बदलाव नहीं हुआ है. ऐसे में, वह ऐप्लिकेशन को बंद कर देता है, ताकि ऐप्लिकेशन डिफ़ॉल्ट लॉन्चर गतिविधि से शुरू हो सके. अगर इस विकल्प से सही का निशान हटाया जाता है, तो Android Studio ऐप्लिकेशन को बंद नहीं करेगा. यह विकल्प, उस पिछले विकल्प के साथ काम करता है जो यह कंट्रोल करता है कि कोई APK इंस्टॉल किया गया है या नहीं. इंस्टॉलेशन के विकल्प फ़ील्ड के लिए, डिफ़ॉल्ट वैल्यू का इस्तेमाल करें. ऐसा तब तक करें, जब तक आपको हर बार इंस्टॉलेशन को फ़ोर्स न करना हो. कुछ मामलों में, आपको इस विकल्प से चुने हुए का निशान हटाना पड़ सकता है. उदाहरण के लिए, अगर आपको इनपुट मेथड एडिटर (आईएमई) लिखना है, तो ऐप्लिकेशन को बंद करने से, वह मौजूदा कीबोर्ड के तौर पर नहीं चुना जाएगा. ऐसा हो सकता है कि आपको ऐसा न करना हो. डिफ़ॉल्ट: चुना गया |
| लॉन्च से पहले | लॉन्च से पहले की कार्रवाइयां तय करना लेख पढ़ें. |
डीबगर टैब
डीबगर टैब में, डीबग करने के विकल्प तय करें.
C और C++ कोड के लिए, Android Studio LLDB डिबगर का इस्तेमाल करता है. Android Studio के सामान्य यूज़र इंटरफ़ेस (यूआई) के अलावा, डीबगर विंडो में एक LLDB टैब होता है. इसकी मदद से, डीबग करने के दौरान LLDB कमांड डाली जा सकती हैं. Android Studio, डीबगर यूज़र इंटरफ़ेस (यूआई) में जानकारी दिखाने के लिए जिन कमांड का इस्तेमाल करता है उन्हें यहां भी डाला जा सकता है. साथ ही, अन्य कार्रवाइयां भी की जा सकती हैं.
C और C++ प्रोजेक्ट के लिए, डिबगर टैब में सिंबल डायरेक्ट्री के साथ-साथ LLDB स्टार्टअप और अटैच करने के बाद की जाने वाली कार्रवाइयों के लिए कमांड जोड़ी जा सकती हैं. इसके लिए, आपको यहां दिए गए बटन जैसे बटन इस्तेमाल करने होंगे:
- जोड़ें
- कोई डायरेक्ट्री या कमांड जोड़ें.
- हटाएं
- कोई डायरेक्ट्री या निर्देश चुनें. इसके बाद, आइटम हटाने के लिए इस बटन पर क्लिक करें.
- ऊपर ले जाएं
- किसी डायरेक्ट्री या कमांड को चुनें. इसके बाद, सूची में आइटम को ऊपर ले जाने के लिए इस बटन पर क्लिक करें.
- नीचे ले जाएं
- कोई डायरेक्ट्री या कमांड चुनें. इसके बाद, इस बटन पर क्लिक करके आइटम को सूची में नीचे ले जाएं.
Android Studio में डीबग करने के बारे में ज़्यादा जानने के लिए, अपने ऐप्लिकेशन को डीबग करना लेख पढ़ें.
| फ़ील्ड | ब्यौरा |
|---|---|
| डीबग टाइप | निम्न विकल्पों में से कोई एक चुनें:
हमारा सुझाव है कि आप अपने-आप पता लगाएं विकल्प चुनें. ऐसा इसलिए, क्योंकि यह आपके प्रोजेक्ट के लिए सही डीबग टाइप चुनता है. |
| सिंबल डायरेक्ट्री | अगर आपको डीबगर को C या C++ की ऐसी जानकारी देनी है जो Android Studio के बाहर जनरेट हुई है, तो सिंबल फ़ाइलें जोड़ी जा सकती हैं. इसके लिए, यहां एक या उससे ज़्यादा डायरेक्ट्री जोड़ी जा सकती हैं. Android Studio, Android Plugin for Gradle से जनरेट की गई फ़ाइलों के बजाय, इन डायरेक्ट्री में मौजूद फ़ाइलों का इस्तेमाल करता है. डीबगर, डायरेक्ट्री में ऊपर से नीचे तक क्रम से खोज करता है. ऐसा तब तक किया जाता है, जब तक उसे ज़रूरी जानकारी नहीं मिल जाती. यह डायरेक्ट्री में मौजूद फ़ाइलों को बार-बार खोजता है. सूची को ऑप्टिमाइज़ करने और समय बचाने के लिए, सबसे ज़्यादा इस्तेमाल की जाने वाली डायरेक्ट्री को सूची में सबसे ऊपर रखें. अगर ट्री में सबसे ऊपर मौजूद किसी डायरेक्ट्री को खोजा जाता है, तो सभी सबडायरेक्ट्री को खोजने में ज़्यादा समय लग सकता है. अगर कोई खास डायरेक्ट्री जोड़ी जाती है, तो उसे खोजने में कम समय लगता है. आपको डीबग करने के लिए ज़रूरी फ़ाइलों को ढूंढने और उन्हें तेज़ी से ऐक्सेस करने के बीच सही संतुलन बनाना होगा. उदाहरण के लिए, अगर आपके पास ऐसी डायरेक्ट्री है जिसमें अलग-अलग Android बाइनरी इंटरफ़ेस (एबीआई) के लिए सबडायरेक्ट्री हैं, तो आपके पास किसी खास एबीआई या सभी एबीआई के लिए डायरेक्ट्री जोड़ने का विकल्प होता है. हालांकि, ऊपरी लेवल की डायरेक्ट्री में खोज करने में ज़्यादा समय लग सकता है. अगर आपको किसी दूसरे डिवाइस पर डीबग करना है, तो यह तरीका ज़्यादा भरोसेमंद है. ध्यान दें कि आपको Gradle सिंबल फ़ाइलें रखने वाली डायरेक्ट्री जोड़ने की ज़रूरत नहीं है, क्योंकि डीबगर इनका इस्तेमाल अपने-आप करता है. |
| LLDB स्टार्टअप कमांड | LLDB की उन कमांड को जोड़ें जिन्हें आपको डीबगर के प्रोसेस से अटैच होने से पहले चलाना है. उदाहरण के लिए, एनवायरमेंट के लिए सेटिंग तय की जा सकती हैं. इसके लिए, यहां दिया गया कमांड इस्तेमाल करें:
LLDB, कमांड को ऊपर से नीचे की ओर क्रम से लागू करता है. |
| एलएलडीबी पोस्ट अटैच कमांड | ऐसी LLDB कमांड जोड़ें जिन्हें आपको डीबगर के प्रोसेस से अटैच होने के तुरंत बाद चलाना है. उदाहरण के लिए:
LLDB, कमांड को ऊपर से नीचे की ओर क्रम से लागू करता है. |
| होस्ट की वर्किंग डायरेक्ट्री | LLDB की वर्किंग डायरेक्ट्री के बारे में बताएं. |
| लॉगिंग: टारगेट चैनल | LLDB लॉग के विकल्प तय करें. Android Studio, टीम के अनुभव के आधार पर डिफ़ॉल्ट विकल्प सेट करता है. इसलिए, यह बहुत धीमा नहीं होता, लेकिन इसमें समस्याओं को हल करने के लिए ज़रूरी जानकारी शामिल होती है. Android Studio में गड़बड़ी की रिपोर्ट के लिए, अक्सर इस लॉग का अनुरोध किया जाता है. यह डिफ़ॉल्ट है
ज़्यादा जानकारी इकट्ठा करने के लिए, डिफ़ॉल्ट सेटिंग में बदलाव किया जा सकता है. उदाहरण के लिए, यहां दिए गए लॉग के विकल्प, किसी खास � के बारे में जानकारी इकट्ठा करते हैं: lldb process
platform:gdb-remote packets
लॉग कमांड की पूरी सूची देखने के लिए, Android Studio में LLDB शेल विंडो से
Android Studio, डिवाइस के लॉग को इस जगह पर रखता है. यहां
अगर एक डिवाइस को कई लोग ऐक्सेस करते हैं, तो यह कुकी लॉग को इस जगह पर सेव करती है. यहां
रिमोट तरीके से डीबग करने के लिए LLDB का इस्तेमाल करने के बारे में जानकारी पाने के लिए, रिमोट तरीके से डीबग करना लेख पढ़ें. |
| लॉन्च से पहले | लॉन्च से पहले की कार्रवाइयां तय करना लेख पढ़ें. |
प्रोफ़ाइलिंग टैब
अगर आपका डिवाइस Android 7.1 या इससे पुराने वर्शन पर काम कर रहा है, तो Android Profiler में कुछ सुविधाओं को चालू करने के लिए, ऐडवांस प्रोफ़ाइलिंग चालू करें विकल्प को चुना जाना चाहिए.
Android टेस्ट
आपको जिस टेस्ट टेंप्लेट का इस्तेमाल करना चाहिए वह आपके सोर्स सेट पर निर्भर करता है. Android इंस्ट्रूमेंटेड टेस्ट टेंप्लेट, इंस्ट्रूमेंटेड टेस्ट के लिए होता है. Android JUnit टेंप्लेट, लोकल यूनिट टेस्ट के लिए होता है.
ध्यान दें: अगर अलग-अलग डिवाइसों पर जांच करने के लिए, Firebase टेस्ट लैब का इस्तेमाल किया जा रहा है, तो इंस्ट्रुमेंट की गई जांचों को तय करने के लिए, Android JUnit टेंप्लेट का इस्तेमाल किया जा सकता है. ज़्यादा जानकारी के लिए, Firebase Test Lab की मदद से टेस्ट चलाना लेख पढ़ें.
यहां दी गई जानकारी में, Android इंस्ट्रूमेंटेड टेस्ट टेंप्लेट के टैब और फ़ील्ड के बारे में बताया गया है. Android JUnit टेस्ट टेंप्लेट के टैब और फ़ील्ड के बारे में जानकारी पाने के लिए, IntelliJ Run/Debug Configuration: JUnit पेज देखें.
सामान्य टैब
सामान्य टैब में, टेस्ट की जगह, इंस्ट्रूमेंटेशन रनर, adb शेल, और डिप्लॉयमेंट के विकल्प तय किए जा सकते हैं.
| फ़ील्ड | ब्यौरा |
|---|---|
| मॉड्यूल | वह मॉड्यूल चुनें जिस पर यह कॉन्फ़िगरेशन लागू करना है. |
| टेस्ट | इस सेक्शन में, उन टेस्ट की जगह के बारे में बताएं जिन्हें आपको चलाना है:
|
| खास इंस्ट्रूमेंटेशन रनर (ज़रूरी नहीं) | इंस्ट्रुमेंटेशन रनर की जगह की जानकारी डालें. डायलॉग का इस्तेमाल करने के लिए, ज़्यादा पर क्लिक करें. build.gradle फ़ाइल, इंस्ट्रुमेंटेशन रनर की जगह की जानकारी देती है. यह वैल्यू, इसे बदल देती है. डिफ़ॉल्ट रूप से, यह AndroidX Test से AndroidJUnitRunner क्लास होता है.
|
| ज़्यादा विकल्प | adb डिफ़ॉल्ट: कोई विकल्प नहीं |
| डिप्लॉयमेंट टारगेट के विकल्प: टारगेट | कोई विकल्प चुनें:
|
| डिप्लॉयमेंट टारगेट के विकल्प: आने वाले समय में लॉन्च होने वाले ऐप्लिकेशन के लिए, उसी डिवाइस का इस्तेमाल करें | अगर आपको आने वाले समय में, डिप्लॉयमेंट टारगेट चुनें डायलॉग बॉक्स में चुने गए डिवाइस का अपने-आप इस्तेमाल करना है, तो यह विकल्प चुनें. अगर डिवाइस उपलब्ध नहीं है, तो आपको एक डायलॉग बॉक्स दिखेगा. डिफ़ॉल्ट: चुना नहीं गया |
| लॉन्च से पहले | लॉन्च से पहले की कार्रवाइयां तय करना लेख पढ़ें. |
अन्य टैब
अन्य टैब में, लॉगकैट और इंस्टॉलेशन के विकल्प होते हैं.
| फ़ील्ड | ब्यौरा |
|---|---|
| Logcat: Clear log before launch | अगर आपको ऐप्लिकेशन शुरू करने से पहले, Android Studio को लॉग फ़ाइल से पिछले सेशन का डेटा हटाना है, तो इस विकल्प को चुनें. डिफ़ॉल्ट रूप से: यह विकल्प नहीं चुना जाता. |
| इंस्टॉल करने के विकल्प: अगर APK में कोई बदलाव नहीं हुआ है, तो इंस्टॉल करने की प्रोसेस छोड़ें | इस विकल्प को चुनने पर, Android Studio आपके APK को फिर से डिप्लॉय नहीं करता. ऐसा तब होता है, जब उसे पता चलता है कि APK में कोई बदलाव नहीं हुआ है. अगर आपको Android Studio से APK को इंस्टॉल करने के लिए मजबूर करना है, भले ही उसमें कोई बदलाव न हुआ हो, तो इस विकल्प से सही का निशान हटाएं. डिफ़ॉल्ट: चुना गया |
| इंस्टॉल करने के विकल्प: ऐक्टिविटी लॉन्च करने से पहले, चल रहे ऐप्लिकेशन को ज़बरदस्ती रोकें | इस विकल्प को चुनने पर, Android Studio को यह पता चलता है कि APK को फिर से इंस्टॉल करने की ज़रूरत नहीं है, क्योंकि इसमें कोई बदलाव नहीं हुआ है. ऐसे में, वह ऐप्लिकेशन को बंद कर देता है, ताकि ऐप्लिकेशन डिफ़ॉल्ट लॉन्चर गतिविधि से शुरू हो सके. अगर इस विकल्प से सही का निशान हटाया जाता है, तो Android Studio ऐप्लिकेशन को बंद नहीं करेगा. यह विकल्प, पिछले विकल्प के साथ मिलकर काम करता है. पिछले विकल्प से यह कंट्रोल किया जाता है कि कोई APK इंस्टॉल किया जाए या नहीं. इंस्टॉलेशन के विकल्प फ़ील्ड के लिए, डिफ़ॉल्ट वैल्यू का इस्तेमाल करें. ऐसा तब तक करें, जब तक आपको हर बार इंस्टॉलेशन को फ़ोर्स न करना हो. कुछ मामलों में, आपको इस विकल्प से चुने हुए का निशान हटाना पड़ सकता है. उदाहरण के लिए, अगर आपको इनपुट मेथड एडिटर (आईएमई) लिखना है, तो ऐप्लिकेशन को बंद करने से, वह मौजूदा कीबोर्ड के तौर पर नहीं चुना जाएगा. ऐसा हो सकता है कि आपको ऐसा न करना हो. डिफ़ॉल्ट: चुना गया |
| लॉन्च से पहले | लॉन्च से पहले की कार्रवाइयां तय करना लेख पढ़ें. |
डीबगर टैब
डीबगर टैब में, डीबग करने के विकल्प तय करें.
C और C++ कोड के लिए, Android Studio LLDB डिबगर का इस्तेमाल करता है. Android Studio के सामान्य यूज़र इंटरफ़ेस (यूआई) के अलावा, डीबगर विंडो में एक LLDB टैब होता है. इसकी मदद से, डीबग करने के दौरान LLDB कमांड डाली जा सकती हैं. Android Studio, डीबगर यूज़र इंटरफ़ेस (यूआई) में जानकारी दिखाने के लिए जिन कमांड का इस्तेमाल करता है उन्हें यहां भी डाला जा सकता है. साथ ही, अन्य कार्रवाइयां भी की जा सकती हैं.
C और C++ प्रोजेक्ट के लिए, डिबगर टैब में सिंबल डायरेक्ट्री के साथ-साथ LLDB स्टार्टअप और अटैच करने के बाद की जाने वाली कार्रवाइयों के लिए कमांड जोड़ी जा सकती हैं. इसके लिए, आपको यहां दिए गए बटन जैसे बटन इस्तेमाल करने होंगे:
- जोड़ें
- कोई डायरेक्ट्री या कमांड जोड़ें.
- हटाएं
- कोई डायरेक्ट्री या निर्देश चुनें. इसके बाद, आइटम हटाने के लिए इस बटन पर क्लिक करें.
- ऊपर ले जाएं
- किसी डायरेक्ट्री या कमांड को चुनें. इसके बाद, सूची में आइटम को ऊपर ले जाने के लिए इस बटन पर क्लिक करें.
- नीचे ले जाएं
- कोई डायरेक्ट्री या कमांड चुनें. इसके बाद, इस बटन पर क्लिक करके आइटम को सूची में नीचे ले जाएं.
Android Studio में डीबग करने के बारे में ज़्यादा जानने के लिए, अपने ऐप्लिकेशन को डीबग करना लेख पढ़ें.
| फ़ील्ड | ब्यौरा |
|---|---|
| डीबग टाइप | निम्न विकल्पों में से कोई एक चुनें:
हमारा सुझाव है कि आप अपने-आप पता लगाएं विकल्प चुनें. ऐसा इसलिए, क्योंकि यह आपके प्रोजेक्ट के लिए सही डीबग टाइप चुनता है. |
| सिंबल डायरेक्ट्री | अगर आपको डीबगर को C या C++ की ऐसी जानकारी देनी है जो Android Studio के बाहर जनरेट हुई है, तो सिंबल फ़ाइलें जोड़ी जा सकती हैं. इसके लिए, यहां एक या उससे ज़्यादा डायरेक्ट्री जोड़ी जा सकती हैं. Android Studio, Android Plugin for Gradle से जनरेट की गई फ़ाइलों के बजाय, इन डायरेक्ट्री में मौजूद फ़ाइलों का इस्तेमाल करता है. डीबगर, डायरेक्ट्री में ऊपर से नीचे तक क्रम से खोज करता है. ऐसा तब तक किया जाता है, जब तक उसे ज़रूरी जानकारी नहीं मिल जाती. यह डायरेक्ट्री में मौजूद फ़ाइलों को बार-बार खोजता है. सूची को ऑप्टिमाइज़ करने और समय बचाने के लिए, सबसे ज़्यादा इस्तेमाल की जाने वाली डायरेक्ट्री को सूची में सबसे ऊपर रखें. अगर ट्री में सबसे ऊपर मौजूद किसी डायरेक्ट्री को खोजा जाता है, तो सभी सबडायरेक्ट्री को खोजने में ज़्यादा समय लग सकता है. अगर कोई खास डायरेक्ट्री जोड़ी जाती है, तो उसे खोजने में कम समय लगता है. आपको डीबग करने के लिए ज़रूरी फ़ाइलों को ढूंढने और उन्हें तेज़ी से ऐक्सेस करने के बीच सही संतुलन बनाना होगा. उदाहरण के लिए, अगर आपके पास ऐसी डायरेक्ट्री है जिसमें अलग-अलग Android बाइनरी इंटरफ़ेस (एबीआई) के लिए सबडायरेक्ट्री हैं, तो किसी खास एबीआई या सभी एबीआई के लिए डायरेक्ट्री जोड़ने का विकल्प चुना जा सकता है. हालांकि, ऊपरी लेवल की डायरेक्ट्री में खोज करने में ज़्यादा समय लग सकता है. अगर आपको किसी दूसरे डिवाइस पर डीबग करना है, तो यह तरीका ज़्यादा भरोसेमंद है. ध्यान दें कि आपको Gradle सिंबल फ़ाइलें रखने वाली डायरेक्ट्री जोड़ने की ज़रूरत नहीं है, क्योंकि डीबगर इनका इस्तेमाल अपने-आप करता है. |
| LLDB स्टार्टअप कमांड | LLDB की उन कमांड को जोड़ें जिन्हें आपको डीबगर के प्रोसेस से अटैच होने से पहले चलाना है. उदाहरण के लिए, एनवायरमेंट के लिए सेटिंग तय की जा सकती हैं. इसके लिए, यहां दिया गया कमांड इस्तेमाल करें:
LLDB, कमांड को ऊपर से नीचे की ओर क्रम से लागू करता है. |
| एलएलडीबी पोस्ट अटैच कमांड | ऐसी LLDB कमांड जोड़ें जिन्हें आपको डीबगर के प्रोसेस से अटैच होने के तुरंत बाद चलाना है. उदाहरण के लिए:
LLDB, कमांड को ऊपर से नीचे की ओर क्रम से लागू करता है. |
| होस्ट की वर्किंग डायरेक्ट्री | LLDB की वर्किंग डायरेक्ट्री के बारे में बताएं. |
| लॉगिंग: टारगेट चैनल | LLDB लॉग के विकल्प तय करें. Android Studio, टीम के अनुभव के आधार पर डिफ़ॉल्ट विकल्प सेट करता है. इसलिए, यह बहुत धीमा नहीं होता, लेकिन इसमें समस्याओं को हल करने के लिए ज़रूरी जानकारी शामिल होती है. Android Studio में गड़बड़ी की रिपोर्ट के लिए, अक्सर इस लॉग का अनुरोध किया जाता है. यह डिफ़ॉल्ट है
ज़्यादा जानकारी इकट्ठा करने के लिए, डिफ़ॉल्ट सेटिंग में बदलाव किया जा सकता है. उदाहरण के लिए, यहां दिए गए लॉग के विकल्प, किसी खास � के बारे में जानकारी इकट्ठा करते हैं: lldb process
platform:gdb-remote packets
लॉग कमांड की पूरी सूची देखने के लिए, Android Studio में LLDB शेल विंडो से
Android Studio, डिवाइस के लॉग को इस जगह पर रखता है. यहां
अगर एक डिवाइस को कई लोग ऐक्सेस करते हैं, तो यह कुकी लॉग को इस जगह पर सेव करती है. यहां
रिमोट तरीके से डीबग करने के लिए LLDB का इस्तेमाल करने के बारे में जानकारी पाने के लिए, रिमोट तरीके से डीबग करना लेख पढ़ें. |
| लॉन्च से पहले | लॉन्च से पहले की कार्रवाइयां तय करना लेख पढ़ें. |
App Engine DevAppServer
यह रन/डीबग कॉन्फ़िगरेशन, Google Cloud Platform पर लागू होता है. यह तरीका अपनाने और अपने प्रोजेक्ट को build.gradle फ़ाइल के साथ सिंक करने पर, Android Studio आपके लिए App Engine DevAppServer कॉन्फ़िगरेशन बनाता है.
ध्यान दें कि IntelliJ IDEA में मौजूद App Engine Server टेंप्लेट, एक अलग टेंप्लेट है. यह Android Studio में उपलब्ध नहीं है.
| फ़ील्ड | ब्यौरा |
|---|---|
| सिर्फ़ एक इंस्टेंस | अगर आपको यह पक्का करना है कि फ़िलहाल, सिर्फ़ एक रन/डीबग कॉन्फ़िगरेशन लागू किया गया है, तो इस विकल्प को चुनें. यह एक ही कॉन्फ़िगरेशन को एक साथ कई बार चलाने की अनुमति नहीं देता. डिफ़ॉल्ट: चुना गया |
| मॉड्यूल | वह मॉड्यूल चुनें जिस पर यह कॉन्फ़िगरेशन लागू करना है. |
| build.gradle कॉन्फ़िगरेशन के साथ सिंक करना | App Engine मॉड्यूल जोड़ने और उसे build.gradle फ़ाइल के साथ सिंक करने पर, App Engine DevAppServer के कॉन्फ़िगरेशन फ़ील्ड अपने-आप भर जाते हैं. हमारा सुझाव है कि आप ऐसा करें.
फ़ाइल > Gradle फ़ाइलों के साथ प्रोजेक्ट सिंक करें को चुनने पर भी प्रोजेक्ट सिंक हो जाता है. डिफ़ॉल्ट: चुना गया
|
| App Engine SDK | कंप्यूटर पर, Java के लिए Google App Engine SDK का पाथ टाइप करें. डायलॉग बॉक्स से इसे चुनने के लिए, ... पर क्लिक करें. |
| वॉर पाथ | उस ऐप्लिकेशन की वेब ऐप्लिकेशन संग्रह (WAR) डायरेक्ट्री का पाथ टाइप करें जिसे आपको लोकल डेवलपमेंट सर्वर पर डिप्लॉय करना है. डायलॉग बॉक्स से इसे चुनने के लिए, ... पर क्लिक करें. |
| वीएम आर्ग्युमेंट | DevAppServer लॉन्च करने के लिए, वर्चुअल मशीन को पास किए जाने वाले कमांड-लाइन विकल्प तय करें. विकल्पों की जानकारी देते समय:
वीएम के विकल्पों के बारे में ज़्यादा जानने के लिए, अपने J2SE वर्शन का दस्तावेज़ देखें. जैसे, डिफ़ॉल्ट: कोई विकल्प नहीं |
| सर्वर का पता | सर्वर के लिए इस्तेमाल किया जाने वाला होस्ट पता डालें. आपको पता देना पड़ सकता है, ताकि आपके नेटवर्क पर मौजूद किसी दूसरे कंप्यूटर से डेवलपमेंट सर्वर को ऐक्सेस किया जा सके. 0.0.0.0 पते से, लोकल होस्ट और होस्टनेम, दोनों को ऐक्सेस करने की अनुमति मिलती है. डिफ़ॉल्ट: localhost |
| सर्वर पोर्ट | सर्वर के लिए इस्तेमाल किया जाने वाला पोर्ट नंबर टाइप करें. डिफ़ॉल्ट: 8080 |
| 'App Engine SDK के अपडेट देखें' सुविधा बंद करना | अगर यह विकल्प चुना जाता है, तो डेवलपमेंट सर्वर, एसडीके के नई रिलीज़ की उपलब्धता की जांच करने के लिए App Engine से संपर्क नहीं करेगा. डिफ़ॉल्ट रूप से, सर्वर शुरू होने पर नए वर्शन की जांच करता है. अगर कोई नया वर्शन उपलब्ध होता है, तो वह एक मैसेज प्रिंट करता है. |
| लॉन्च से पहले | लॉन्च से पहले की कार्रवाइयां तय करना लेख पढ़ें. |
Wear OS के लिए रन/डीबग कॉन्फ़िगरेशन
Wear OS के कॉम्प्लिकेशन, टाइल, और वॉच फ़ेस के टेंप्लेट की मदद से, Wear OS ऐप्लिकेशन को वर्चुअल या हार्डवेयर डिवाइसों पर चलाया या डीबग किया जा सकता है. ज़्यादातर टेंप्लेट कॉन्फ़िगरेशन विकल्प, Android ऐप्लिकेशन के विकल्पों जैसे ही होते हैं. यहां ऐसे विकल्प दिए गए हैं जो Wear OS के रन/डीबग कॉन्फ़िगरेशन के लिए ज़्यादा खास हैं:
- Wear के सभी रन/डीबग कॉन्फ़िगरेशन के लिए, आपको कॉन्फ़िगरेशन लागू करने के लिए, कोई खास कॉम्प्लिकेशन डेटा सोर्स, टाइल या वॉच फ़ेस (टेंप्लेट के हिसाब से) चुनना होगा. आम तौर पर, इनमें से हर इकाई आपके कोड में मौजूद किसी क्लास से जुड़ी होती है.
- Wear OS Complication के रन/डीबग कॉन्फ़िगरेशन के लिए, आपको वह स्लॉट चुनना होगा जहां आपको Complication के डेटा सोर्स से मिले डेटा को रखना है. इसे स्मार्टवॉच की होम स्क्रीन पर सबसे ऊपर, दाईं ओर, सबसे नीचे, बाईं ओर या बैकग्राउंड में सेट किया जा सकता है.
- Wear OS Complication के रन/डीबग कॉन्फ़िगरेशन के लिए, आपको Complication के डेटा सोर्स से मिले Complication डेटा का टाइप भी चुनना होगा. आपके पास सिर्फ़ वे टाइप चुनने का विकल्प होता है जो चुने गए कॉम्प्लिकेशन डेटा सोर्स से मिले हैं और चुने गए स्लॉट के साथ काम करते हैं. कॉम्प्लिकेशन के डेटा टाइप की सूची देखने के लिए, टाइप और फ़ील्ड देखें.
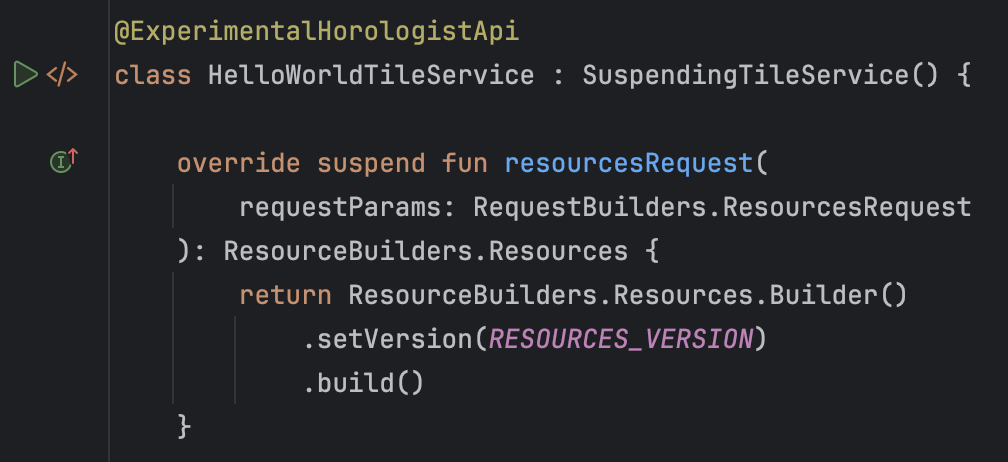
इसके अलावा, इन सुविधाओं को गटर आइकॉन से भी चलाया जा सकता है. यह आइकॉन, सुविधा के एलान के बगल में मौजूद होता है. इसे यहां दी गई इमेज में दिखाया गया है. अगर कोई गड़बड़ी होती है, जैसे कि "टाइल सेट करते समय गड़बड़ी हुई", तो पक्का करें कि आपने सर्फ़ेस को सही तरीके से कॉन्फ़िगर किया हो. इसमें अपने मेनिफ़ेस्ट में सर्फ़ेस का एलान करना भी शामिल है.