The Memory Profiler is a component in the Android Profiler that helps you identify memory leaks and memory churn that can lead to stutter, freezes, and even app crashes. It shows a realtime graph of your app's memory use and lets you capture a heap dump, force garbage collections, and track memory allocations.
To open the Memory Profiler, follow these steps:
- Click View > Tool Windows > Profiler (you can also click Profile in the toolbar).
- Select the device and app process you want to profile from the Android Profiler toolbar. If you've connected a device over USB but don't see it listed, ensure that you have enabled USB debugging.
- Click anywhere in the MEMORY timeline to open the Memory Profiler.
Alternatively, you can inspect your app memory from the command line with dumpsys, and also see GC events in logcat.
Why you should profile your app memory
Android provides a managed memory environment—when it determines that your app is no longer using some objects, the garbage collector releases the unused memory back to the heap. How Android goes about finding unused memory is constantly being improved, but at some point on all Android versions, the system must briefly pause your code. Most of the time, the pauses are imperceivable. However, if your app allocates memory faster than the system can collect it, your app might be delayed while the collector frees enough memory to satisfy your allocations. The delay could cause your app to skip frames and cause visible slowness.
Even if your app doesn't exhibit slowness, if it leaks memory, it can retain that memory even while it's in the background. This behavior can slow the rest of the system's memory performance by forcing unnecessary garbage collection events. Eventually, the system is forced to kill your app process to reclaim the memory. Then when the user returns to your app, it must restart completely.
To help prevent these problems, you should use the Memory Profiler to do the following:
- Look for undesirable memory allocation patterns in the timeline that might be causing performance problems.
- Dump the Java heap to see which objects are using up memory at any given time. Several heap dumps over an extended period of time can help identify memory leaks.
- Record memory allocations during normal and extreme user interaction to identify exactly where your code is either allocating too many objects in a short time or allocating objects that become leaked.
For information about programming practices that can reduce your app's memory use, read Manage your app's memory.
Memory Profiler overview
When you first open the Memory Profiler, you'll see a detailed timeline of your app's memory use and access tools to force garbage collection, capture a heap dump, and record memory allocations.
As indicated in figure 1, the default view for the Memory Profiler includes the following:
- A button to force a garbage collection event.
-
A button to capture a heap dump.
Note: A button to record memory allocations appears to the right of the heap dump button only when connected to a device running Android 7.1 (API level 25) or lower.
- A dropdown menu to specify how frequently the profiler captures memory allocations. Selecting the appropriate option may help you improve app performance while profiling.
- Buttons to zoom in/out of the timeline.
- A button to jump forward to the live memory data.
- The event timeline, which shows the activity states, user input events, and screen rotation events.
- The memory use timeline, which includes the following:
- A stacked graph of how much memory is being used by each memory category, as indicated by the y-axis on the left and the color key at the top.
- A dashed line indicates the number of allocated objects, as indicated by the y-axis on the right.
- An icon for each garbage collection event.
However, if you're using a device running Android 7.1 or lower, not all profiling data is visible by default. If you see a message that says, "Advanced profiling is unavailable for the selected process," you need to enable advanced profiling to see the following:
- Event timeline
- Number of allocated objects
- Garbage collection events
On Android 8.0 and higher, advanced profiling is always enabled for debuggable apps.
How memory is counted
The numbers you see at the top of the Memory Profiler (figure 2) are based on all the private memory pages that your app has committed, according to the Android system. This count does not include pages shared with the system or other apps.
The categories in the memory count are as follows:
- Java: Memory from objects allocated from Java or Kotlin code.
Native: Memory from objects allocated from C or C++ code.
Even if you're not using C++ in your app, you might see some native memory used here because the Android framework uses native memory to handle various tasks on your behalf, such as when handling image assets and other graphics—even though the code you've written is in Java or Kotlin.
Graphics: Memory used for graphics buffer queues to display pixels to the screen, including GL surfaces, GL textures, and so on. (Note that this is memory shared with the CPU, not dedicated GPU memory.)
Stack: Memory used by both native and Java stacks in your app. This usually relates to how many threads your app is running.
Code: Memory that your app uses for code and resources, such as dex bytecode, optimized or compiled dex code, .so libraries, and fonts.
Others: Memory used by your app that the system isn't sure how to categorize.
Allocated: The number of Java/Kotlin objects allocated by your app. This does not count objects allocated in C or C++.
When connected to a device running Android 7.1 and lower, this allocation count starts only at the time the Memory Profiler connected to your running app. So any objects allocated before you start profiling are not accounted for. However, Android 8.0 and higher includes an on-device profiling tool that keeps track of all allocations, so this number always represents the total number of Java objects outstanding in your app on Android 8.0 and higher.
When compared to memory counts from the previous Android Monitor tool, the new Memory Profiler records your memory differently, so it might seem like your memory use is now higher. The Memory Profiler monitors some extra categories that increase the total, but if you only care about the Java heap memory, then the "Java" number should be similar to the value from the previous tool. Although the Java number probably doesn't exactly match what you saw in Android Monitor, the new number accounts for all physical memory pages that have been allocated to your app's Java heap since it was forked from Zygote. So this provides an accurate representation of how much physical memory your app is actually using.
View memory allocations
Memory allocations show you how each Java object and JNI reference in your memory was allocated. Specifically, the Memory Profiler can show you the following about object allocations:
- What types of objects were allocated and how much space they use.
- The stack trace of each allocation, including in which thread.
- When the objects were deallocated (only when using a device with Android 8.0 or higher).
To record Java and Kotlin allocations, select Record Java / Kotlin allocations, then select Record. If the device is running Android 8 or higher, the Memory Profiler UI transitions to a separate screen displaying the ongoing recording. You can interact with the mini timeline above the recording (for example, to change the selection range). To complete the recording, select Stop .
On Android 7.1 and lower, the memory profiler uses legacy allocation recording, which displays the recording on the timeline until you click Stop.
After you select a region of the timeline (or when you finish a recording session with a device running Android 7.1 or lower), the list of allocated objects appears, grouped by class name and sorted by their heap count.
To inspect the allocation record, follow these steps:
- Browse the list to find objects that have unusually large heap counts and
that might be leaked. To help find known classes, click the Class Name
column header to sort alphabetically. Then click a class name. The
Instance View pane appears on the right, showing each instance of that
class, as shown in figure 3.
- Alternatively, you can locate objects quickly by clicking Filter , or by pressing Control+F (Command+F on Mac), and entering a class or package name in the search field. You can also search by method name if you select Arrange by callstack from the dropdown menu. If you want to use regular expressions, check the box next to Regex. Check the box next to Match case if your search query is case-sensitive.
- In the Instance View pane, click an instance. The Call Stack tab appears below, showing where that instance was allocated and in which thread.
- In the Call Stack tab, right-click any line and choose Jump to Source to open that code in the editor.
You can use the two menus above the list of allocated objects to choose which heap to inspect and how to organize the data.
From the menu on the left, choose which heap to inspect:
- default heap: When no heap is specified by the system.
- image heap: The system boot image, containing classes that are preloaded during boot time. Allocations here are guaranteed to never move or go away.
- zygote heap: The copy-on-write heap where an app process is forked from in the Android system.
- app heap: The primary heap on which your app allocates memory.
- JNI heap: The heap that shows where Java Native Interface (JNI) references are allocated and released.
From the menu on the right, choose how to arrange the allocations:
- Arrange by class: Groups all allocations based on class name. This is the default.
- Arrange by package: Groups all allocations based on package name.
- Arrange by callstack: Groups all allocations into their corresponding call stack.
Improve app performance while profiling
To improve app performance while profiling, the memory profiler samples memory allocations periodically by default. When testing on devices running API level 26 or higher, you can change this behavior by using the Allocation Tracking dropdown. The options available are as follows:
- Full: Captures all object allocations in memory. This is the default behavior in Android Studio 3.2 and earlier. If you have an app that allocates a lot of objects, you might observe visible slowdowns with your app while profiling.
- Sampled: Samples object allocations in memory at regular intervals. This is the default option and has less impact on app performance while profiling. Apps that allocate a lot of objects over a short span of time may still exhibit visible slowdowns.
- Off: Stops tracking your app's memory allocation.
View global JNI references
Java Native Interface (JNI) is a framework that allows Java code and native code to call one another.
JNI references are managed manually by the native code, so it is possible for Java objects used by native code to be kept alive for too long. Some objects on the Java heap may become unreachable if a JNI reference is discarded without first being explicitly deleted. Also, it is possible to exhaust the global JNI reference limit.
To troubleshoot such issues, use the JNI heap view in the Memory Profiler to browse all global JNI references and filter them by Java types and native call stacks. With this information, you can find when and where global JNI references are created and deleted.
While your app is running, select a portion of the timeline that you want to inspect and select JNI heap from the drop-down menu above the class list. You can then inspect objects in the heap as you normally would and double-click objects in the Allocation Call Stack tab to see where the JNI references are allocated and released in your code, as shown in figure 4.
To inspect memory allocations for your app’s JNI code, you must deploy your app to a device running Android 8.0 or higher.
For more information on JNI, see JNI tips.
Native Memory Profiler
The Android Studio Memory Profiler includes a Native Memory Profiler for apps deployed to physical and virtual devices running Android 10 and higher.
The Native Memory Profiler tracks allocations/deallocations of objects in native code for a specific time period and provides the following information:
- Allocations: A count of objects allocated via
malloc()
or thenew
operator during the selected time period. - Deallocations: A count of objects deallocated via
free()
or thedelete
operator during the selected time period. - Allocations Size: The aggregated size in bytes of all allocations during the selected time period.
- Deallocations Size: The aggregated size in bytes of all freed memory during the selected time period.
- Total Count: The value in the Allocations column minus the value in the Deallocations column.
- Remaining Size: The value in the Allocations Size column minus the value in the Deallocations Size column.
To record native allocations on devices running Android 10 and higher, select Record native allocations, then select Record. The recording continues until you click Stop , after which the Memory Profiler UI transitions into a separate screen displaying the native recording.
On Android 9 and lower, the Record native allocations option is not available.
By default, the Native Memory Profiler uses a sample size of 32 bytes: Every time 32 bytes of memory are allocated, a snapshot of memory is taken. A smaller sample size results in more frequent snapshots, yielding more accurate data about memory usage. A larger sample size yields less accurate data, but it will consume fewer resources on your system and improve performance while recording.
To change the sample size of the Native Memory Profiler:
- Select Run > Edit Configurations.
- Select your app module in the left pane.
- Click the Profiling tab, and enter the sample size in the field labeled Native memory sampling interval (bytes).
- Build and run your app again.
Capture a heap dump
A heap dump shows which objects in your app are using memory at the time you capture the heap dump. Especially after an extended user session, a heap dump can help identify memory leaks by showing objects still in memory that you believe should no longer be there.
After you capture a heap dump, you can view the following:
- What types of objects your app has allocated, and how many of each.
- How much memory each object is using.
- Where references to each object are being held in your code.
- The call stack for where an object was allocated. (Call stacks are currently available with a heap dump only with Android 7.1 and lower when you capture the heap dump while recording allocations.)
To capture a heap dump, click Capture heap dump, then select Record. While dumping the heap, the amount of Java memory might increase temporarily. This is normal because the heap dump occurs in the same process as your app and requires some memory to collect the data.
After the profiler finishes capturing the heap dump, the Memory Profiler UI transitions to a separate screen displaying the heap dump.
If you need to be more precise about when the dump is created, you
can create a heap dump at the critical point in your app code by calling
dumpHprofData()
.
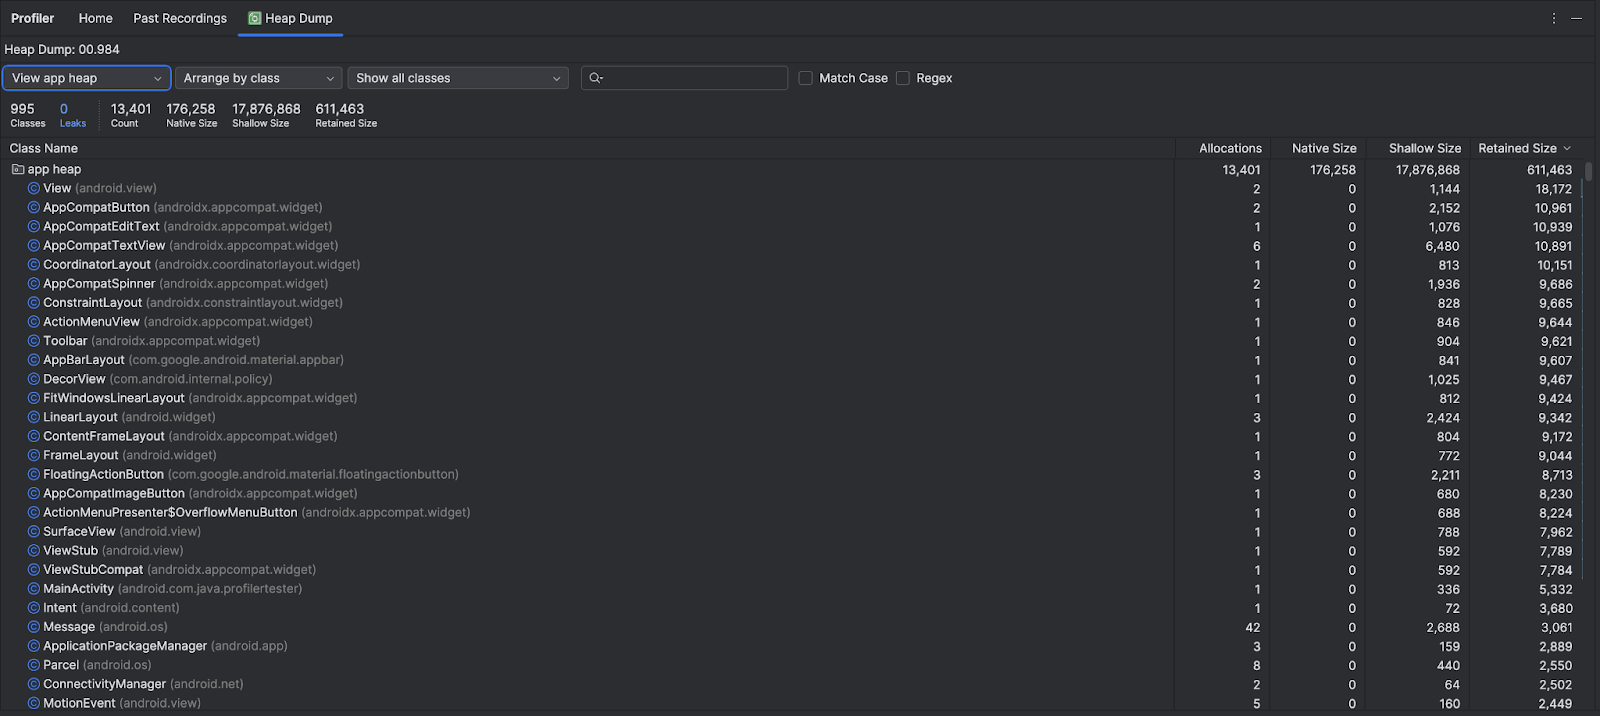
In the list of classes, you can see the following information:
- Allocations: Number of allocations in the heap.
Native Size: Total amount of native memory used by this object type (in bytes). This column is visible only for Android 7.0 and higher.
You will see memory here for some objects allocated in Java because Android uses native memory for some framework classes, such as
Bitmap
.Shallow Size: Total amount of Java memory used by this object type (in bytes).
Retained Size: Total size of memory being retained due to all instances of this class (in bytes).
You can use the two menus above the list of allocated objects to choose which heap dumps to inspect and how to organize the data.
From the menu on the left, choose which heap to inspect:
- default heap: When no heap is specified by the system.
- app heap: The primary heap on which your app allocates memory.
- image heap: The system boot image, containing classes that are preloaded during boot time. Allocations here are guaranteed to never move or go away.
- zygote heap: The copy-on-write heap where an app process is forked from in the Android system.
From the menu on the right, choose how to arrange the allocations:
- Arrange by class: Groups all allocations based on class name. This is the default.
- Arrange by package: Groups all allocations based on package name.
- Arrange by callstack: Groups all allocations into their corresponding call stack. This option works only if you capture the heap dump while recording allocations. Even so, there are likely to be objects in the heap that were allocated before you started recording, so those allocations appear first, simply listed by class name.
The list is sorted by the Retained Size column by default. To sort by the values in a different column, click the column's heading.
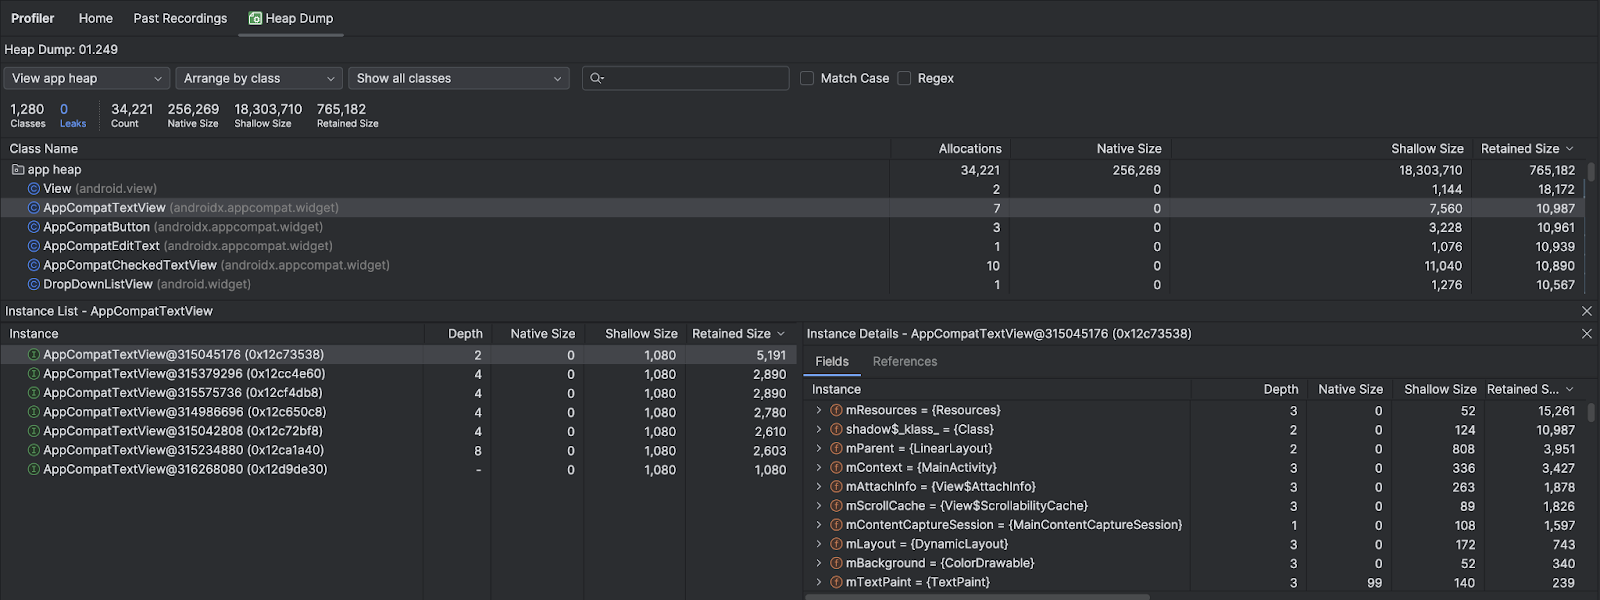
Click a class name to open the Instance View window on the right (shown in figure 6). Each listed instance includes the following:
- Depth: The shortest number of hops from any GC root to the selected instance.
- Native Size: Size of this instance in native memory. This column is visible only for Android 7.0 and higher.
- Shallow Size: Size of this instance in Java memory.
- Retained Size: Size of memory that this instance dominates (as per the dominator tree).
To inspect your heap, follow these steps:
- Browse the list to find objects that have unusually large heap counts and
that might be leaked. To help find known classes, click the Class Name
column header to sort alphabetically. Then click a class name. The
Instance View pane appears on the right, showing each instance of that
class, as shown in figure 6.
- Alternatively, you can locate objects quickly by clicking Filter , or by pressing Control+F (Command+F on Mac), and entering a class or package name in the search field. You can also search by method name if you select Arrange by callstack from the dropdown menu. If you want to use regular expressions, check the box next to Regex. Check the box next to Match case if your search query is case-sensitive.
- In the Instance View pane, click an instance. The References
tab appears below, showing every reference to that object.
Or, click the arrow next to the instance name to view all its fields, and then click a field name to view all its references. If you want to view the instance details for a field, right-click on the field and select Go to Instance.
- In the References tab, if you identify a reference that might be leaking memory, right-click it and select Go to Instance. This selects the corresponding instance from the heap dump, showing you its own instance data.
In your heap dump, look for memory leaks caused by any of the following:
- Long-lived references to
Activity
,Context
,View
,Drawable
, and other objects that might hold a reference to theActivity
orContext
container. - Non-static inner classes, such as a
Runnable
, that can hold anActivity
instance. - Caches that hold objects longer than necessary.
Save a heap dump as an HPROF file
After you capture a heap dump, the data is viewable in the Memory Profiler only
while the profiler is running. When you exit the profiling session, you lose the
heap dump. So, if you want to save it for review later, export the heap dump
to an HPROF file. In Android Studio 3.1 and lower, the Export capture to file
button is on the left side of the toolbar below the timeline; in
Android Studio 3.2 and higher, there is an Export Heap Dump button at the
right of each Heap Dump entry in the Sessions pane. In the Export As
dialog that appears, save the file with the .hprof
file-name extension.
To use a different HPROF analyzer like
jhat,
you need to convert the HPROF file from Android format to the Java SE HPROF format.
You can do so with the hprof-conv
tool provided in the
android_sdk/platform-tools/
directory. Run the hprof-conv
command with two arguments: the original HPROF file and the location to write the converted HPROF
file. For example:
hprof-conv heap-original.hprof heap-converted.hprof
Import a heap dump file
To import an HPROF (.hprof
) file, click Start a new profiling session
in the
Sessions pane, select Load from file, and choose the file from the file
browser.
You can also import an HPROF file by dragging it from the file browser into an editor window.
Leak detection in Memory Profiler
When analyzing a heap dump in the Memory Profiler, you can filter profiling
data that Android Studio thinks might indicate memory leaks for Activity
and
Fragment
instances in your app.
The types of data that the filter shows include the following:
Activity
instances that have been destroyed but are still being referenced.Fragment
instances that do not have a validFragmentManager
but are still being referenced.
In certain situations, such as the following, the filter might yield false positives:
- A
Fragment
is created but has not yet been used. - A
Fragment
is being cached but not as part of aFragmentTransaction
.
To use this feature, first capture a heap dump or import a heap dump file into Android Studio. To display the fragments and activities that may be leaking memory, select the Activity/Fragment Leaks checkbox in the heap dump pane of the Memory Profiler, as shown in figure 7.
Techniques for profiling your memory
While using the Memory Profiler, you should stress your app code and try forcing memory leaks. One way to provoke memory leaks in your app is to let it run for a while before inspecting the heap. Leaks might trickle up to the top of the allocations in the heap. However, the smaller the leak, the longer you need to run the app in order to see it.
You can also trigger a memory leak in one of the following ways:
- Rotate the device from portrait to landscape and back again multiple times while in different
activity states. Rotating the device can often cause an app to leak an
Activity
,Context
, orView
object because the system recreates theActivity
and if your app holds a reference to one of those objects somewhere else, the system can't garbage collect it. - Switch between your app and another app while in different activity states (navigate to the Home screen, then return to your app).
Tip: You can also perform the above steps by using the monkeyrunner test framework.