با مجموعهها، منظم بمانید
ذخیره و طبقهبندی محتوا براساس اولویتهای شما.
پشتههای تماس برای شناسایی نقاط داغ پردازنده یا بخشهایی از کد که اجرای آنها زمان زیادی میبرد مفید هستند. Callstacks به شما کمک می کند بفهمید کدام قسمت از کد اجرا شده است و چرا فراخوانی شده است.
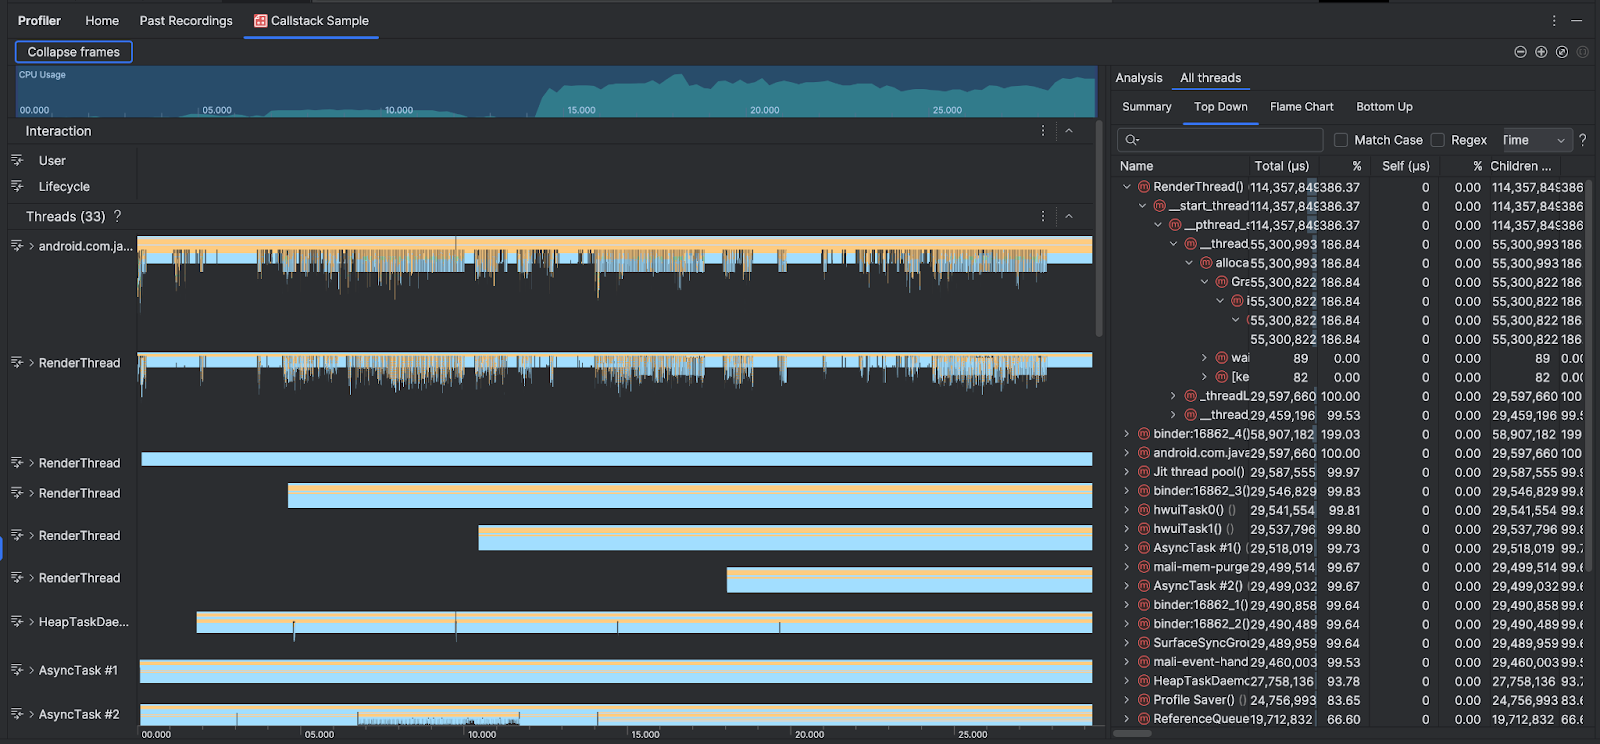
برای تکمیل جدولهای زمانی استفاده و تعاملات CPU ، بخش Threads فریمهایی را برای هر تماسی که برنامه و سیستم شما برقرار میکند نشان میدهد. در اینجا چند نکته برای پیمایش نمونه callstack وجود دارد:
رشته مورد علاقه را گسترش دهید و از میانبرهای صفحه کلید برای پیمایش فریم های پشته استفاده کنید. روی یک قاب پشته کلیک کنید تا جزئیات مربوط به رویداد و تماسهای مرتبط را در قسمت تجزیه و تحلیل دریافت کنید.
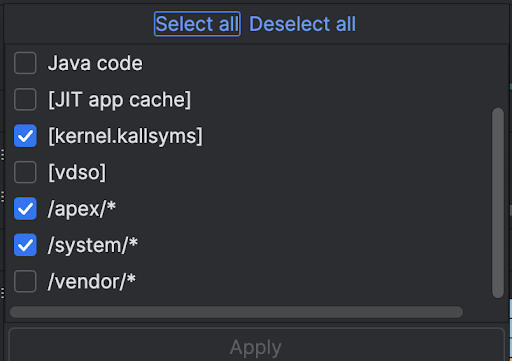
برای فیلتر کردن انواع خاصی از قابهای پشتهای، روی جمع کردن فریمها کلیک کنید و انواع قابهایی را که میخواهید پنهان کنید بررسی کنید. فرو ریختن فریم ها آنها را از هر دو بخش Threads و Analysis حذف می کند. بسته به تحقیق شما، ممکن است بخواهید فریمهای ماشین مجازی جاوا (به عنوان مثال android::AndroidRuntime::start و art::{...} ) و هسته سیستم (به عنوان مثال [kernel.kallsyms]+{offset} جمع کنید. [kernel.kallsyms]+{offset} ). معمولاً این مربوط به فریم های در حال جمع شدن مربوط به [kernel.kallsyms] ، /apex/ و /system/* است.
از آنجایی که یک برنامه جاوا/کاتلین معمولاً از طریق یک ماشین مجازی جاوا اجرا میشود، زمانی که Android Studio پشته تماس را برای یک برنامه جاوا/کاتلین جمعآوری میکند، معمولاً callstack نه تنها کد جاوا/کاتلین، بلکه کد بومی مورد نیاز برای اجرای خود برنامه را نیز شامل میشود. برای اینکه برنامه با سیستم و سخت افزار صحبت کند.
برای رفتن به کد منبع مرتبط با یک قاب پشته، روی قاب کلیک راست کرده و روی «پرش به منبع» کلیک کنید.
برای برجسته کردن قاب پشته مرتبط با یک رویداد در جدول رویداد، روی رویداد کلیک کنید.
در داخل، Android Studio از simpleperf برای ردیابی کد اصلی برنامه شما استفاده می کند. اگر میخواهید گزینههای اضافی را برای Simpleperf مشخص کنید، مانند نمونهبرداری از CPUهای دستگاه خاص یا تعیین مدت زمان نمونهبرداری با دقت بالا، میتوانید از simpleperf از خط فرمان استفاده کنید .
محتوا و نمونه کدها در این صفحه مشمول پروانههای توصیفشده در پروانه محتوا هستند. جاوا و OpenJDK علامتهای تجاری یا علامتهای تجاری ثبتشده Oracle و/یا وابستههای آن هستند.
تاریخ آخرین بهروزرسانی 2025-07-29 بهوقت ساعت هماهنگ جهانی.
[[["درک آسان","easyToUnderstand","thumb-up"],["مشکلم را برطرف کرد","solvedMyProblem","thumb-up"],["غیره","otherUp","thumb-up"]],[["اطلاعاتی که نیاز دارم وجود ندارد","missingTheInformationINeed","thumb-down"],["بیشازحد پیچیده/ مراحل بسیار زیاد","tooComplicatedTooManySteps","thumb-down"],["قدیمی","outOfDate","thumb-down"],["مشکل ترجمه","translationIssue","thumb-down"],["مشکل کد / نمونهها","samplesCodeIssue","thumb-down"],["غیره","otherDown","thumb-down"]],["تاریخ آخرین بهروزرسانی 2025-07-29 بهوقت ساعت هماهنگ جهانی."],[],[],null,["# Sample the callstack\n\nCallstacks are useful for identifying *CPU hot spots*, or sections of code that\ntake a long time to execute. Callstacks help you understand which part of the\ncode has been executed, and why it was invoked.\n| **Note:** To sample the callstack, you must deploy your app to a device running Android 8.0 (API level 26) or higher.\n\nCallstack sample overview\n-------------------------\n\nTo sample the callstack,\n[select the **Find CPU Hotspots (Callstack Sample)** task](/studio/profile#start-profiling)\nfrom the Android Studio Profiler **Home** tab. After the recording is parsed you\nsee the following visuals:\n\nTo supplement the\n[**CPU Usage** and **Interactions** timelines](/studio/profile/cpu-profiler),\nthe **Threads** section shows frames for every call that your app and the system\nmakes. Here are some tips for navigating the callstack sample:\n\n- Expand the thread of interest and use [keyboard shortcuts](/studio/profile/cpu-profiler#ui-shortcuts) to navigate the stack frames. Click a stack frame to get details about the event and related calls in the **Analysis** pane.\n- To filter to certain types of stack frames, click **Collapse frames** and check the frame types you want to hide. Collapsing frames removes them from both the **Threads** and **Analysis** sections. Depending on your investigation, you might want to collapse frames from the Java virtual machine (for example `android::AndroidRuntime::start` and `art::{...}`), and the system kernel (for example `[kernel.kallsyms]+{offset}`). Usually this corresponds to collapsing frames related to `[kernel.kallsyms]`, `/apex/`, and `/system/*`.\n\nBecause a Java/Kotlin program typically executes through a Java virtual machine,\nwhen Android Studio collects the callstack for a Java/Kotlin program, the\ncallstack usually includes not just the Java/Kotlin code but also the native\ncode required to run the program itself and for the program to talk with the\nsystem and hardware.\n\n- To jump to the source code associated with a stack frame, right-click the frame and click **Jump to source**.\n- To highlight the stack frame associated with an event in the event table, click the event.\n\nFor information about the other visuals, see\n[Record a system trace](/studio/profile/cpu-profiler) and the\n[chart glossary](/studio/profile/chart-glossary/flame-chart).\n\nSample native code using the command line\n-----------------------------------------\n\nInternally, Android Studio uses [simpleperf](/ndk/guides/simpleperf) to trace\nyour app's native code. If you want to specify additional options for\nSimpleperf, such as sampling specific device CPUs or specifying sampling\ndurations at a high accuracy, you can\n[use simpleperf from the command line](https://android.googlesource.com/platform/system/extras/+/master/simpleperf/doc/README.md)."]]