네이티브 할당 기록
컬렉션을 사용해 정리하기
내 환경설정을 기준으로 콘텐츠를 저장하고 분류하세요.
네이티브 코드를 작성 중이며 메모리 사용량이 우려되는 경우 앱의 네이티브 할당을 프로파일링하여 최적화할 기회가 있는지 확인하는 것이 좋습니다.
앱 메모리를 프로파일링해야 하는 이유
Android는 관리되는 메모리 환경을 제공합니다. 즉, 앱에서 일부 객체를 더 이상 사용하지 않는다고 판단되면 가비지 컬렉터가 사용되지 않는 메모리를 힙에 돌려보냅니다. Android에서 사용되지 않는 메모리를 찾는 방법은 끊임없이 개선되고 있지만, 모든 Android 버전의 특정 시점에서 시스템이 코드를 일시중지해야 합니다. 대부분의 경우, 이러한 일시 중지는 감지할 수 없는 수준입니다.
하지만, 시스템에서 메모리를 수집할 수 있는 것보다 빠르게 앱에서 메모리를 할당하는 경우 컬렉터가 할당하기에 충분한 메모리를 확보하는 동안 앱이 지연될 수 있습니다. 이로 인해 앱이 프레임을 건너뛰고 눈에 띄게 느려질 수 있습니다.
앱의 메모리 사용을 줄일 수 있는 프로그래밍 방법에 관한 정보는 앱 메모리 관리를 참고하세요.
네이티브 할당 개요
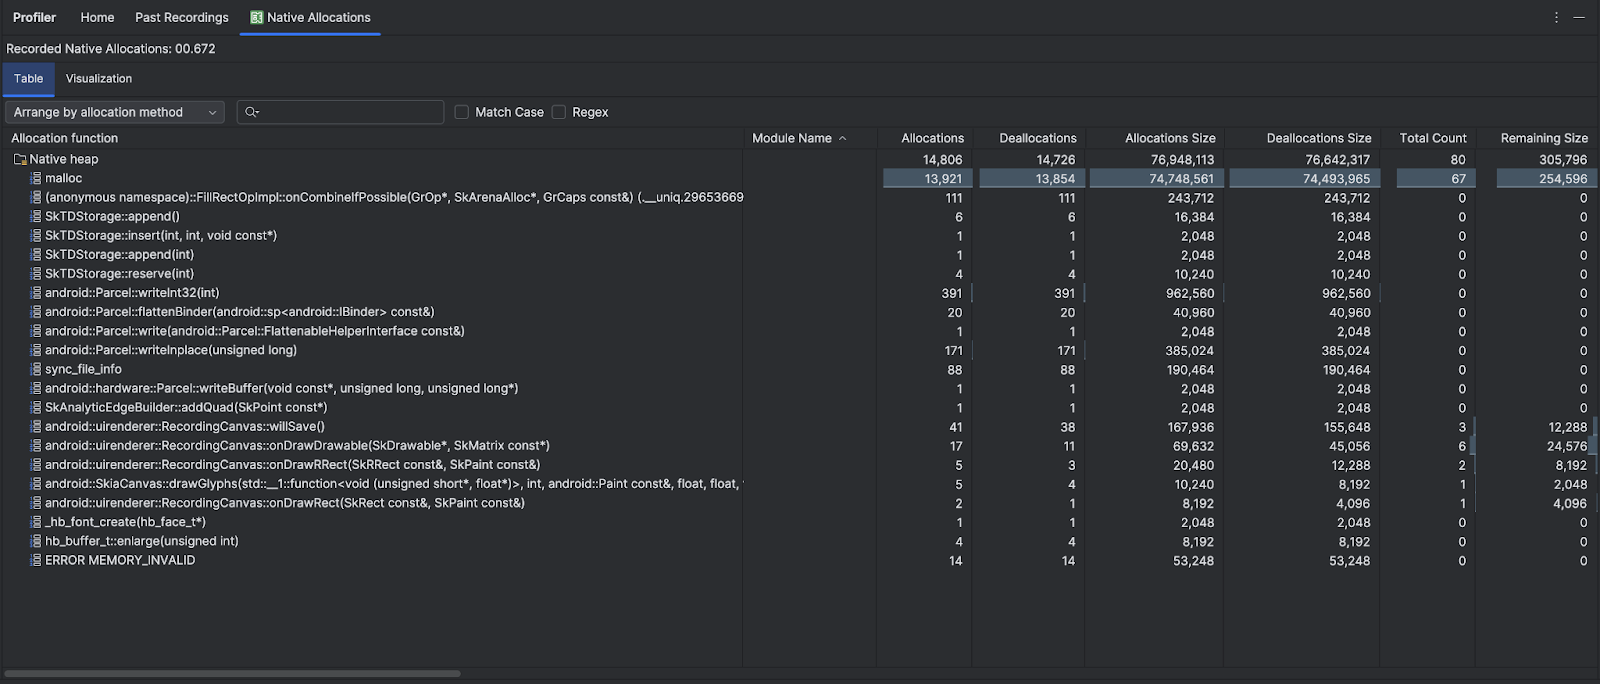
메모리 사용량 추적 (네이티브 할당) 작업을 실행하면 Android 스튜디오 프로파일러가 지정된 기간 동안 네이티브 코드에서 객체의 할당 및 할당 해제를 추적하고 다음 정보를 제공합니다.
- Allocations: 선택한 기간 동안
malloc()
또는 new
연산자를 사용하여 할당된 객체의 수입니다.
- Deallocations: 선택한 기간 동안
free()
또는 delete
연산자를 사용하여 할당 해제된 객체의 수입니다.
- Allocations Size: 선택한 기간 동안 모든 할당의 집계 크기(단위: 바이트)입니다.
- Deallocations Size: 선택한 기간 동안 확보되는 모든 메모리의 집계 크기(단위: 바이트)입니다.
- Total Count: Allocations 열의 값에서 Deallocations 열의 값을 뺀 값입니다.
- Remaining Size: Allocations Size 열의 값에서 Deallocations Size 열의 값을 뺀 값입니다.

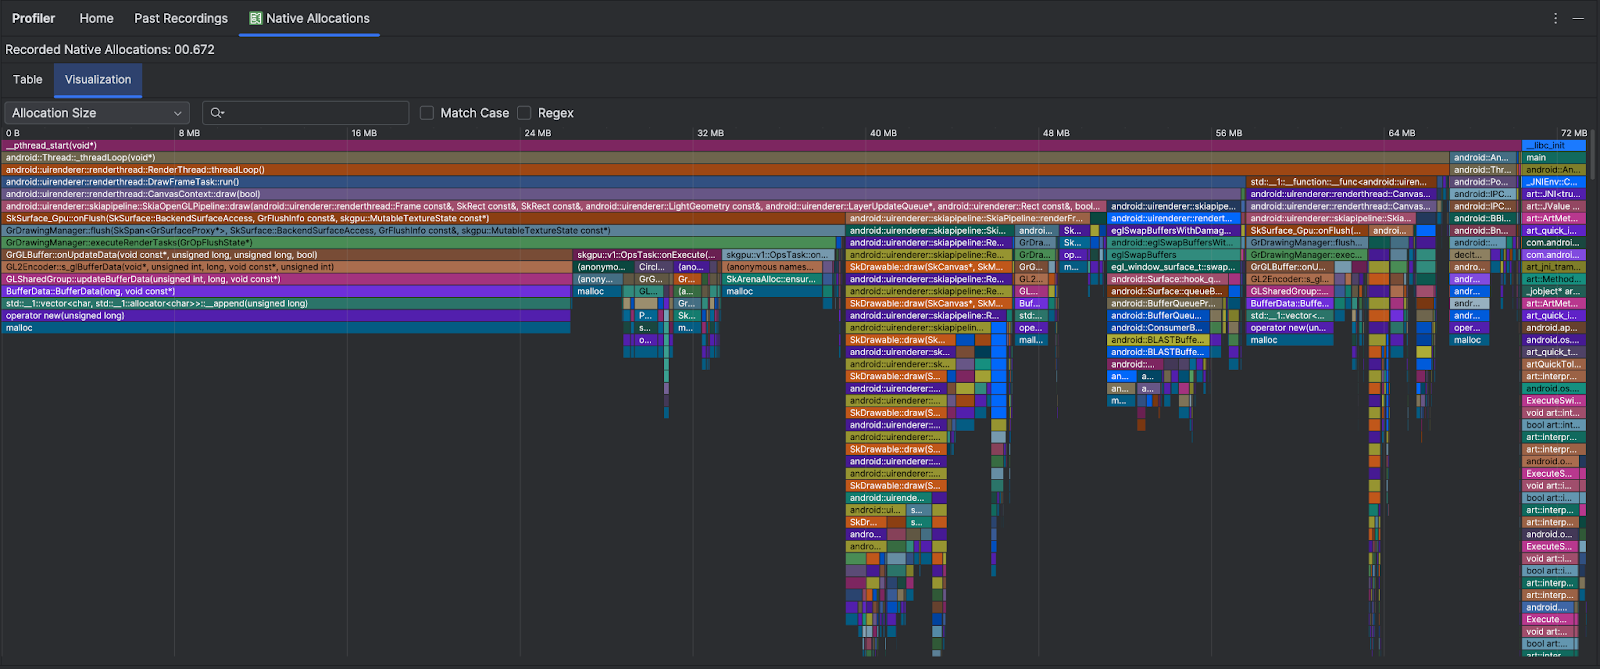
시각화 탭에는 선택한 기간 동안 호출 스택의 네이티브 코드와 관련된 모든 객체의 집계된 보기가 표시됩니다. 기본적으로 표시된 인스턴스가 있는 콜 스택이 차지하는 총 메모리 양을 보여줍니다.
첫 번째 행에는 스레드 이름이 표시됩니다. 기본적으로 객체는 할당 크기를 기준으로 왼쪽에서 오른쪽으로 쌓입니다. 드롭다운을 사용하여 순서를 변경하세요.

기본적으로 프로파일러는 2048바이트 크기의 샘플을 사용합니다. 메모리 2048바이트가 할당될 때마다 메모리의 스냅샷이 만들어집니다. 샘플 크기가 작을수록 스냅샷 생성 빈도가 높아지고 메모리 사용량에 관한 보다 정확한 데이터가 생성됩니다. 샘플 크기가 클수록 데이터의 정확도가 떨어지지만 기록하는 동안 시스템 리소스가 더 적게 소비되고 성능이 향상됩니다. 샘플 크기를 변경하려면 녹음 구성 수정을 참고하세요.
이 페이지에 나와 있는 콘텐츠와 코드 샘플에는 콘텐츠 라이선스에서 설명하는 라이선스가 적용됩니다. 자바 및 OpenJDK는 Oracle 및 Oracle 계열사의 상표 또는 등록 상표입니다.
최종 업데이트: 2025-07-27(UTC)
[[["이해하기 쉬움","easyToUnderstand","thumb-up"],["문제가 해결됨","solvedMyProblem","thumb-up"],["기타","otherUp","thumb-up"]],[["필요한 정보가 없음","missingTheInformationINeed","thumb-down"],["너무 복잡함/단계 수가 너무 많음","tooComplicatedTooManySteps","thumb-down"],["오래됨","outOfDate","thumb-down"],["번역 문제","translationIssue","thumb-down"],["샘플/코드 문제","samplesCodeIssue","thumb-down"],["기타","otherDown","thumb-down"]],["최종 업데이트: 2025-07-27(UTC)"],[],[],null,["# Record native allocations\n\nIf you're writing native code and concerned about its memory usage, it's helpful\nto profile your app's native allocations to discover if there's opportunity to\noptimize.\n\nWhy you should profile your app memory\n--------------------------------------\n\nAndroid provides a [managed memory\nenvironment](/topic/performance/memory-overview)---when Android determines that\nyour app is no longer using some objects, the garbage collector releases the\nunused memory back to the heap. How Android goes about finding unused memory is\nconstantly being improved, but at some point on all Android versions, the system\nmust briefly pause your code. Most of the time, the pauses are imperceivable.\nHowever, if your app allocates memory faster than the system can collect it,\nyour app might be delayed while the collector frees enough memory to satisfy\nyour allocations. The delay could cause your app to skip frames and cause\nvisible slowness.\n\nFor information about programming practices that can reduce your app's memory\nuse, read [Manage your app's memory](/topic/performance/memory).\n\nNative allocations overview\n---------------------------\n\nWhen you run the [**Track Memory Consumption (Native Allocations)**](/studio/profile#start-profiling) task,\nthe Android Studio Profiler tracks allocations and deallocations of objects in\nnative code for the time period that you specify and provides the following\ninformation:\n\n- **Allocations** : A count of objects allocated using `malloc()` or the `new` operator during the selected time period.\n- **Deallocations** : A count of objects deallocated using `free()` or the `delete` operator during the selected time period.\n- **Allocations Size**: The aggregated size in bytes of all allocations during the selected time period.\n- **Deallocations Size**: The aggregated size in bytes of all freed memory during the selected time period.\n- **Total Count** : The value in the **Allocations** column minus the value in the **Deallocations** column.\n- **Remaining Size** : The value in the **Allocations Size** column minus the value in the **Deallocations Size** column.\n\nThe **Visualization** tab shows an aggregated view of all the objects related to\nnative code in the call stack during the time range selected. It essentially\nshows you how much total memory the callstack with the instances shown takes.\nThe first row shows the thread name. By default, the objects are stacked left to\nright based on allocation size; use the drop-down to change the ordering.\n\nBy default, the profiler uses a sample size of 2048 bytes: Every time 2048 bytes\nof memory are allocated, a snapshot of memory is taken. A smaller sample size\nresults in more frequent snapshots, yielding more accurate data about memory\nusage. A larger sample size yields less accurate data, but it consumes fewer\nsystem resources and improves performance while recording. To change the sample\nsize, see [Edit the recording configuration](/studio/profile#edit-recording)."]]