نمودارهای بالا به پایین و پایین به بالا
با مجموعهها، منظم بمانید
ذخیره و طبقهبندی محتوا براساس اولویتهای شما.
برگه Top Down فهرستی از تماسها را نشان میدهد که در آن گسترش یک روش یا گره تابع، فراخوانهای آن را نشان میدهد. شکل 2 یک نمودار از بالا به پایین برای نمودار تماس زیر را نشان می دهد. هر فلش در نمودار از تماس گیرنده به تماس گیرنده اشاره می کند.
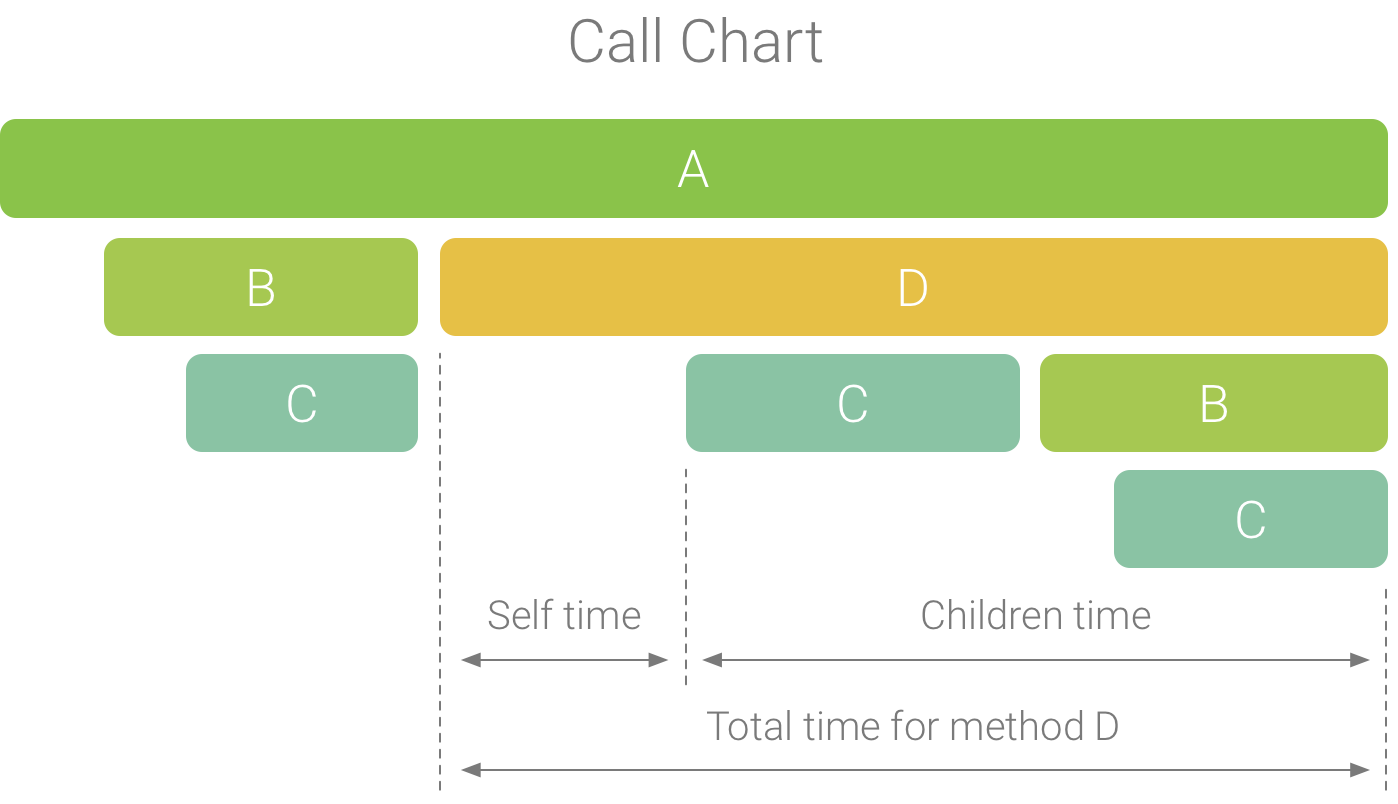
شکل 1. نمودار فراخوانی مثالی که خود، فرزندان و زمان کل را برای روش D نشان می دهد.
همانطور که در شکل 2 نشان داده شده است، گسترش گره برای روش A در تب بالا به پایین، فراخوان های آن، روش های B و D را نشان می دهد. پس از آن، گسترش گره برای روش D، فراخوان های آن، مانند روش های B و C را نشان می دهد. شبیه به Flame. برگه نمودار ، درخت از بالا به پایین اطلاعات ردیابی را برای روشهای یکسانی که پشته تماس یکسانی را به اشتراک میگذارند جمعآوری میکند. یعنی تب Flame chart یک نمایش گرافیکی از تب Top Down را ارائه می دهد.
برگه Top Down اطلاعات زیر را برای کمک به توصیف زمان صرف شده در CPU در هر تماس ارائه می دهد (زمان ها نیز به صورت درصدی از زمان کل رشته در محدوده انتخاب شده نشان داده می شوند):
- Self: زمانی که فراخوانی متد یا تابع صرف اجرای کد خود می شود و نه فراخوانی آن، همانطور که در شکل 1 برای روش D نشان داده شده است.
- فرزندان: زمانی که متد یا فراخوانی تابع صرف اجرای فراخوانهای خود و نه کد خود میشود، همانطور که در شکل 1 برای روش D نشان داده شده است.
- مجموع: مجموع زمان خود و فرزندان روش. این نشان دهنده کل زمانی است که برنامه برای اجرای یک تماس صرف کرده است، همانطور که در شکل 1 برای روش D نشان داده شده است.
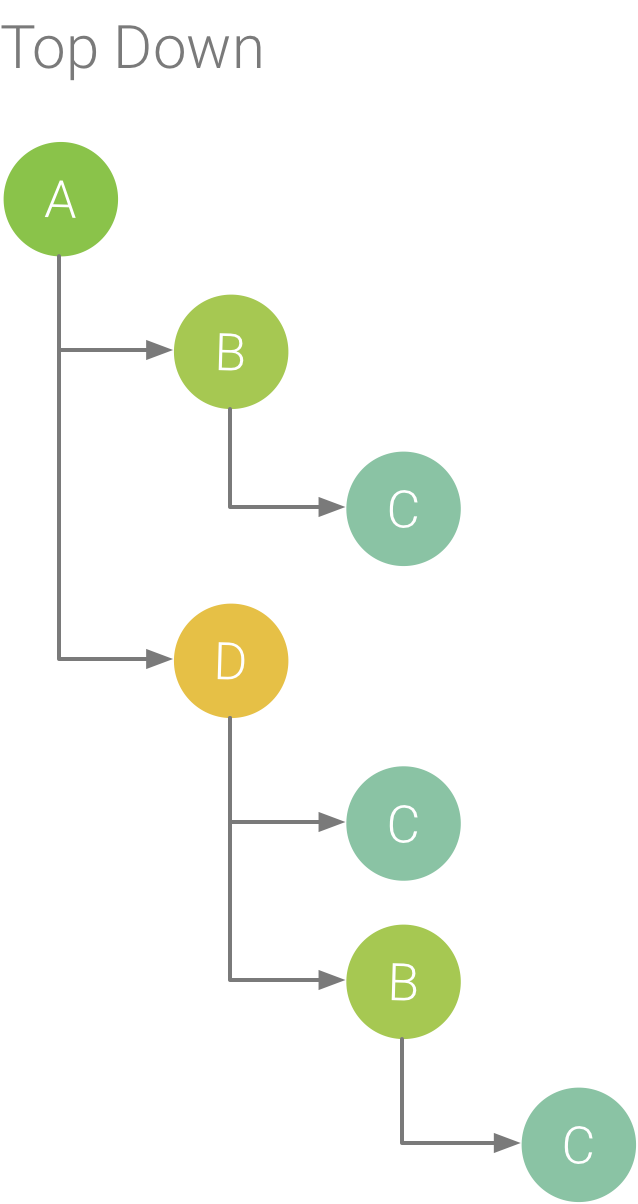
شکل 2. درخت از بالا به پایین.
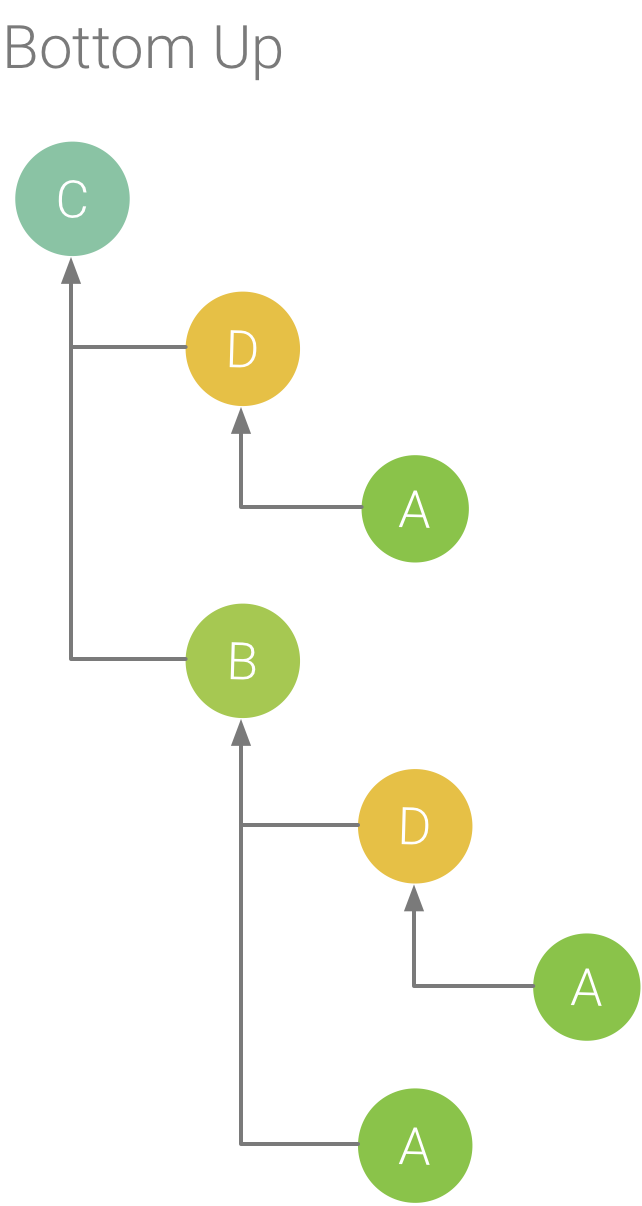
شکل 3. درخت پایین به بالا برای روش C از شکل 5.
تب Bottom Up فهرستی از تماسها را نشان میدهد که در آن با گسترش یک تابع یا گره روش، تماسگیرندگان آن نمایش داده میشود. با استفاده از ردیابی مثال نشان داده شده در شکل 2، شکل 3 یک درخت از پایین به بالا برای روش C ارائه می کند. باز کردن گره برای روش C در درخت پایین به بالا، هر یک از فراخواننده های منحصر به فرد آن، روش های B و D را نمایش می دهد. توجه داشته باشید که، اگرچه B C را فراخوانی می کند. دو بار، B فقط یک بار هنگام گسترش گره برای روش C در درخت پایین به بالا ظاهر می شود. پس از آن، گسترش گره برای B، فراخوان دهنده آن، روش های A و D را نمایش می دهد.
تب Bottom Up برای مرتبسازی روشها یا توابع بر اساس مواردی که بیشترین (یا کمترین) زمان CPU را مصرف میکنند مفید است. میتوانید هر گره را بررسی کنید تا مشخص کنید کدام تماسگیرندگان بیشترین زمان CPU را برای فراخوانی آن روشها یا توابع صرف میکنند. در مقایسه با درخت از بالا به پایین، اطلاعات زمان بندی برای هر روش یا تابع در درخت پایین به بالا به متد بالای هر درخت (گره بالا) اشاره دارد. زمان CPU نیز به عنوان درصدی از زمان کل رشته در طول آن ضبط نشان داده می شود. جدول زیر به توضیح چگونگی تفسیر اطلاعات زمان بندی برای گره بالا و فراخوان دهنده های آن (گره های فرعی) کمک می کند.
| خود | بچه ها | مجموع |
---|
روش یا تابع در بالای درخت پایین به بالا (گره بالا) | کل زمانی را که متد یا تابع صرف اجرای کد خود کرده است و نه فراخواننده هایش را نشان می دهد. در مقایسه با درخت از بالا به پایین، این اطلاعات زمان بندی مجموعه ای از تماس های این روش یا تابع در طول مدت ضبط را نشان می دهد. | کل زمانی را که متد یا تابع صرف اجرای فراخوان های خود کرده است و نه کد خود را نشان می دهد. در مقایسه با درخت بالا به پایین، این اطلاعات زمانبندی مجموع تماسهای این روش یا فراخوانهای تابع را در طول مدت ضبط نشان میدهد. | مجموع زمان خود و زمان فرزندان. |
---|
تماس گیرندگان (گره های فرعی) | مجموع زمان خود تماس گیرنده را هنگام فراخوانی توسط تماس گیرنده نشان می دهد. با استفاده از درخت پایین به بالا در شکل 6 به عنوان مثال، زمان خود برای روش B برابر است با مجموع زمان های خود برای هر اجرای روش C هنگامی که توسط B فراخوانی می شود. | مجموع زمان فرزندان تماس گیرنده را هنگام فراخوانی توسط تماس گیرنده نشان می دهد. با استفاده از درخت پایین به بالا در شکل 6 به عنوان مثال، زمان فرزندان برای روش B برابر است با مجموع دفعات فرزندان برای هر اجرای روش C هنگامی که توسط B فراخوانی می شود. | مجموع زمان خود و زمان فرزندان. |
---|
توجه: برای یک ضبط مشخص، زمانی که نمایهساز به حد مجاز اندازه فایل برسد، Android Studio جمعآوری دادههای جدید را متوقف میکند (اما این کار ضبط را متوقف نمیکند). این معمولاً هنگام اجرای ردیابیهای ابزاردار خیلی سریعتر اتفاق میافتد، زیرا این نوع ردیابی در مقایسه با ردیابی نمونهبرداری شده، دادههای بیشتری را در زمان کوتاهتری جمعآوری میکند. اگر زمان بازرسی را به دورهای از ضبط که پس از رسیدن به حد مجاز رخ داده است افزایش دهید، دادههای زمانبندی در صفحه ردیابی تغییر نمیکند (زیرا داده جدیدی در دسترس نیست). علاوه بر این، زمانی که فقط بخشی از ضبط را انتخاب می کنید که داده ای در دسترس ندارد، پنجره ردیابی NaN را برای اطلاعات زمان نمایش می دهد.
محتوا و نمونه کدها در این صفحه مشمول پروانههای توصیفشده در پروانه محتوا هستند. جاوا و OpenJDK علامتهای تجاری یا علامتهای تجاری ثبتشده Oracle و/یا وابستههای آن هستند.
تاریخ آخرین بهروزرسانی 2025-07-29 بهوقت ساعت هماهنگ جهانی.
[[["درک آسان","easyToUnderstand","thumb-up"],["مشکلم را برطرف کرد","solvedMyProblem","thumb-up"],["غیره","otherUp","thumb-up"]],[["اطلاعاتی که نیاز دارم وجود ندارد","missingTheInformationINeed","thumb-down"],["بیشازحد پیچیده/ مراحل بسیار زیاد","tooComplicatedTooManySteps","thumb-down"],["قدیمی","outOfDate","thumb-down"],["مشکل ترجمه","translationIssue","thumb-down"],["مشکل کد / نمونهها","samplesCodeIssue","thumb-down"],["غیره","otherDown","thumb-down"]],["تاریخ آخرین بهروزرسانی 2025-07-29 بهوقت ساعت هماهنگ جهانی."],[],[],null,["# Top down and bottom up charts\n\nThe **Top Down** tab displays a list of calls in which expanding a method or\nfunction node displays its callees. Figure 2 shows a top down graph for the\nfollowing call chart. Each arrow in the graph points from a caller to a callee.\n\n\n**Figure 1.** An example call chart that illustrates\nself, children, and total time for method D.\n\n\u003cbr /\u003e\n\nAs shown in Figure 2, expanding the node for method A in the **Top Down** tab\ndisplays its callees, methods B and D. After that, expanding the node for method\nD exposes its callees, such as methods B and C. Similar to the\n[**Flame chart**](/studio/profile/chart-glossary/flame-chart) tab, the top down\ntree aggregates trace information for identical methods that share the same call\nstack. That is, the **Flame chart** tab provides a graphical representation of\nthe **Top Down** tab.\n\nThe **Top Down** tab provides the following information to help describe CPU\ntime spent on each call (times are also represented as a percentage of the\nthread's total time over the selected range):\n\n- **Self:** the time the method or function call spent executing its own code and not that of its callees, as illustrated in Figure 1 for method D.\n- **Children:** the time the method or function call spent executing its callees and not its own code, as illustrated in Figure 1 for method D.\n- **Total:** the sum of the method's **Self** and **Children** time. This represents the total time the app spent executing a call, as illustrated in Figure 1 for method D.\n\n**Figure 2.** A Top Down tree.\n\n\u003cbr /\u003e\n\n**Figure 3.** A Bottom Up tree for method C from\nFigure 5.\n\n\u003cbr /\u003e\n\nThe **Bottom Up** tab displays a list of calls in which expanding a function or\nmethod's node displays its callers. Using the example trace shown in Figure 2,\nfigure 3 provides a bottom up tree for method C. Opening the node for method C\nin the bottom up tree displays each of its unique callers, methods B and D. Note\nthat, although B calls C twice, B appears only once when expanding the node for\nmethod C in the bottom up tree. After that, expanding the node for B displays\nits caller, methods A and D.\n\nThe **Bottom Up** tab is useful for sorting methods or functions by those that\nconsume the most (or least) CPU time. You can inspect each node to determine\nwhich callers spend the most CPU time invoking those methods or functions.\nCompared to the top down tree, timing info for each method or function in a\nbottom up tree is in reference to the method at the top of each tree (top node).\nCPU time is also represented as a percentage of the thread's total time during\nthat recording. The following table helps explain how to interpret timing\ninformation for the top node and its callers (sub-nodes).\n\n| | Self | Children | Total |\n| Method or function at the top of the bottom up tree (top node) | Represents the total time the method or function spent executing its own code and not that of its callees. Compared to the top down tree, this timing information represents a sum of all calls to this method or function over the duration of the recording. | Represents the total time the method or function spent executing its callees and not its own code. Compared to the top down tree, this timing information represents the sum of all calls to this method or function's callees over the duration of the recording. | The sum of the self time and children time. |\n| Callers (sub-nodes) | Represents the total self time of the callee when being called by the caller. Using the bottom up tree in Figure 6 as an example, the self time for method B would equal the sum of the self times for each execution of method C when called by B. | Represents the total children time of the callee when being invoked by the caller. Using the bottom up tree in Figure 6 as an example, the children time for method B would equal the sum of the children times for each execution of method C when called by B. | The sum of the self time and children time. |\n|----------------------------------------------------------------|----------------------------------------------------------------------------------------------------------------------------------------------------------------------------------------------------------------------------------------------------------------|--------------------------------------------------------------------------------------------------------------------------------------------------------------------------------------------------------------------------------------------------------------------|---------------------------------------------|\n\n\n**Note:** For a given recording, Android Studio stops collecting new data\nwhen the profiler reaches the file size limit (however, this does not stop the\nrecording). This typically happens much more quickly when performing\ninstrumented traces because this type of tracing collects more data in a shorter\ntime, compared to a sampled trace. If you extend the inspection time into a\nperiod of the recording that occurred after reaching the limit, timing data in\nthe trace pane does not change (because no new data is available). Additionally,\nthe trace pane displays **NaN** for timing information when you select only\nthe portion of a recording that has no data available."]]