
The Network Inspector displays real-time network activity on a timeline, showing data sent and received. The Network Inspector lets you examine how and when your app transfers data and optimize the underlying code appropriately.
To open the Network Inspector, follow these steps:
- From the Android Studio navigation bar, select View > Tool Windows >
App Inspection. After the app inspection window automatically connects
to an app process, select Network Inspector from the tabs.
- If the app inspection window doesn't connect to an app process automatically, you may need to select an app process manually.
- Select the device and app process you want to inspect from the App Inspection window.
Network Inspector overview
At the top of the Network Inspector window, you can see the event timeline. Click and drag to select a portion of the timeline and inspect the traffic.
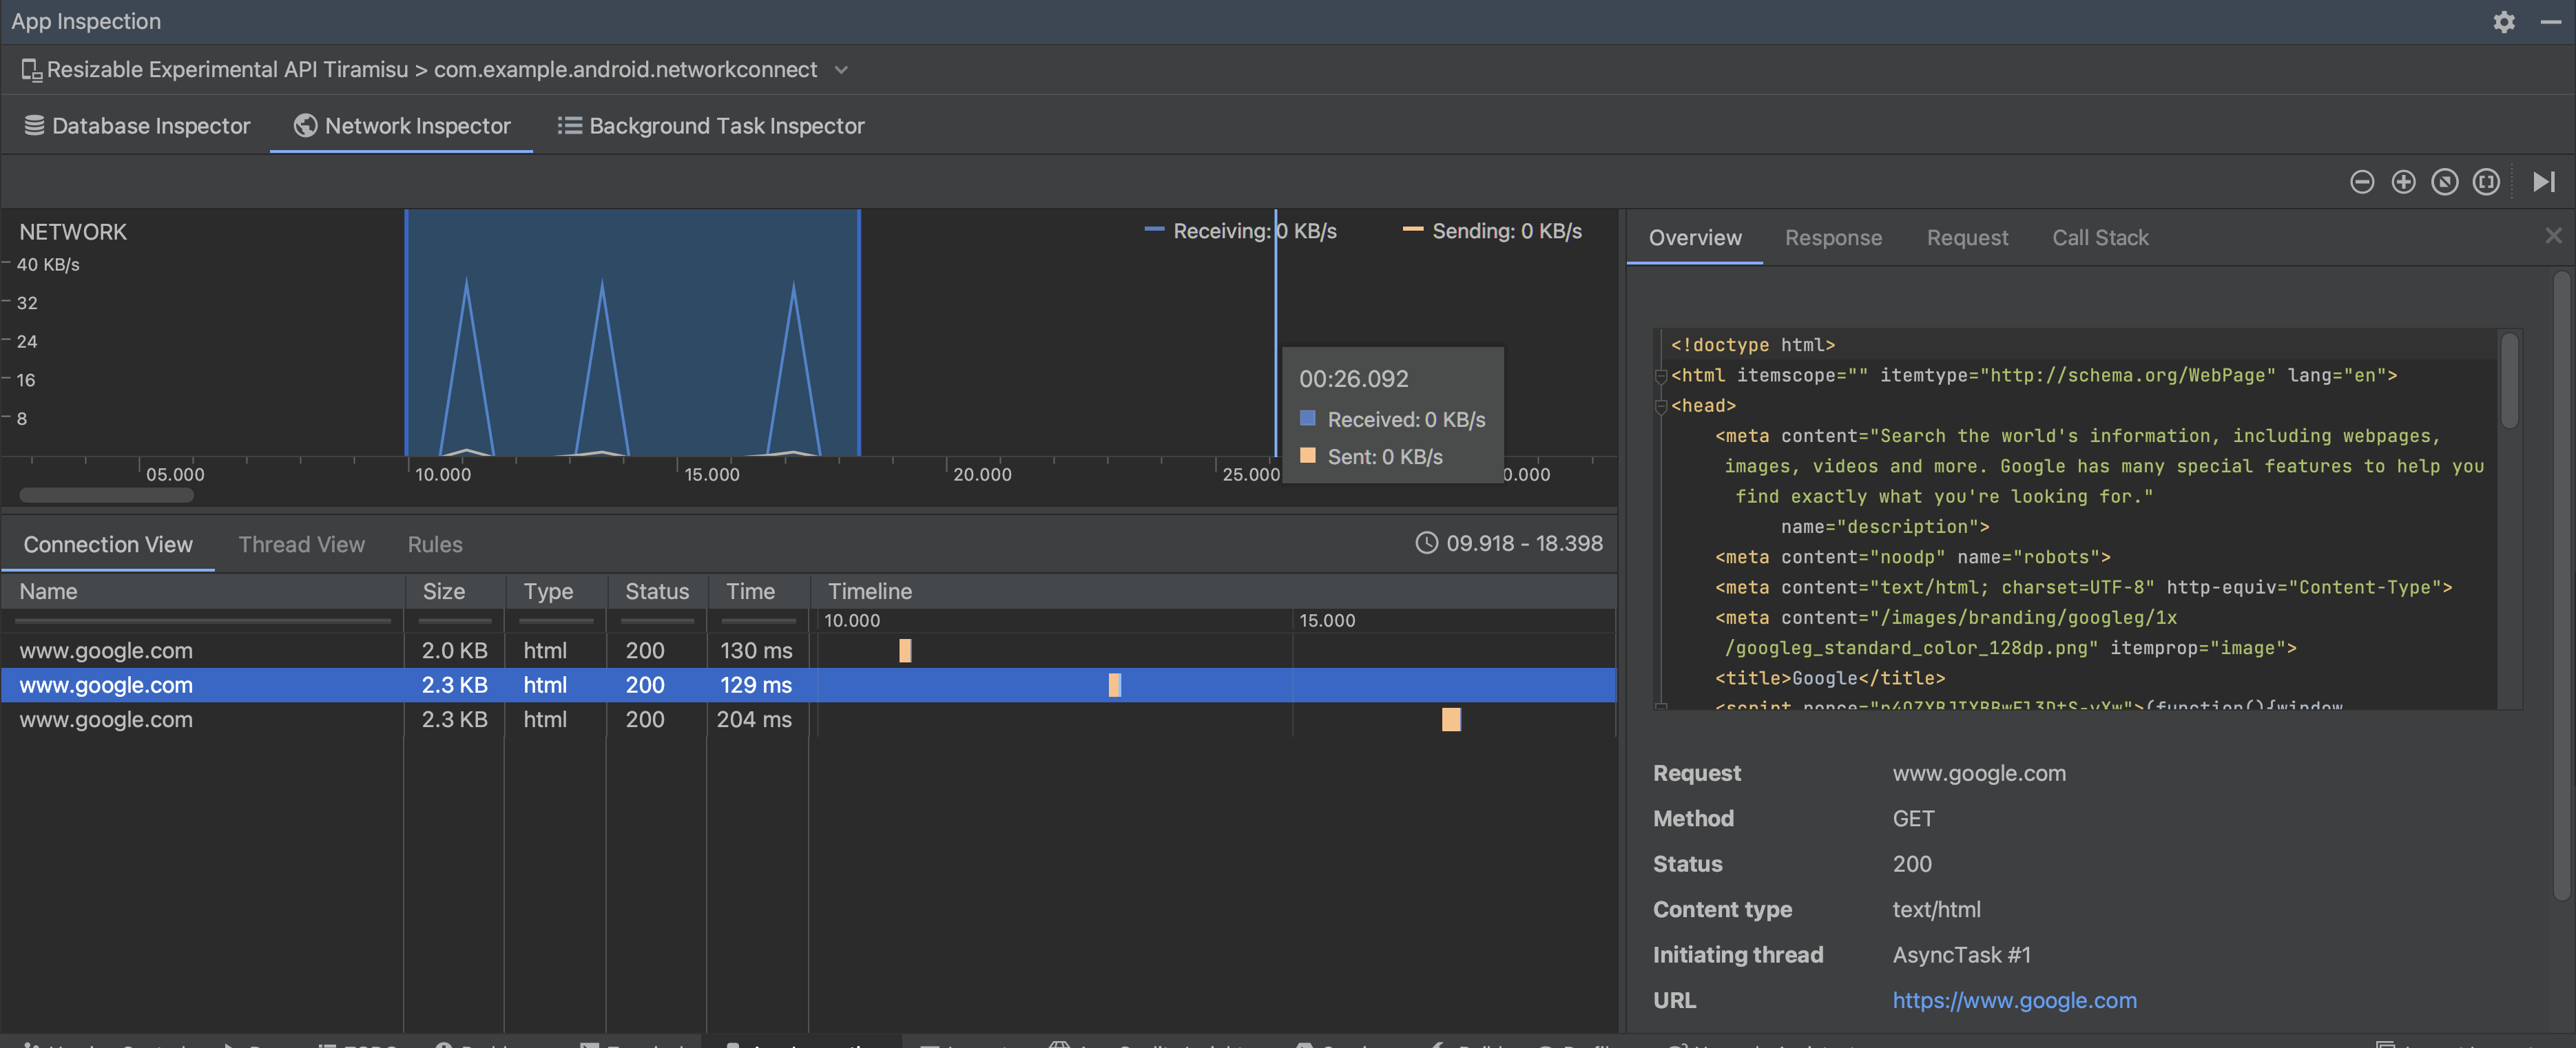
In the details pane, the timing graph can help you identify where performance issues could be occurring. The start of the yellow section corresponds to the first byte of the request being sent. The start of the blue section corresponds to the first byte of the response being received. The end of the blue section corresponds to the final byte of the response being received.
In the pane below the timeline, select one of the following tabs for more detail about the network activity during the selected portion of the timeline:
- Connection View: Lists files that were sent or received during the selected portion of the timeline across all of your app's CPU threads. For each request, you can inspect the size, type, status, and transmission duration. To sort this list, click any of the column headers. You can also see a detailed breakdown of the selected portion of the timeline, showing when each file was sent or received.
Thread View: Displays the network activity on each of your app's CPU threads. As shown in figure 2, this view lets you inspect which threads are responsible for each network request.
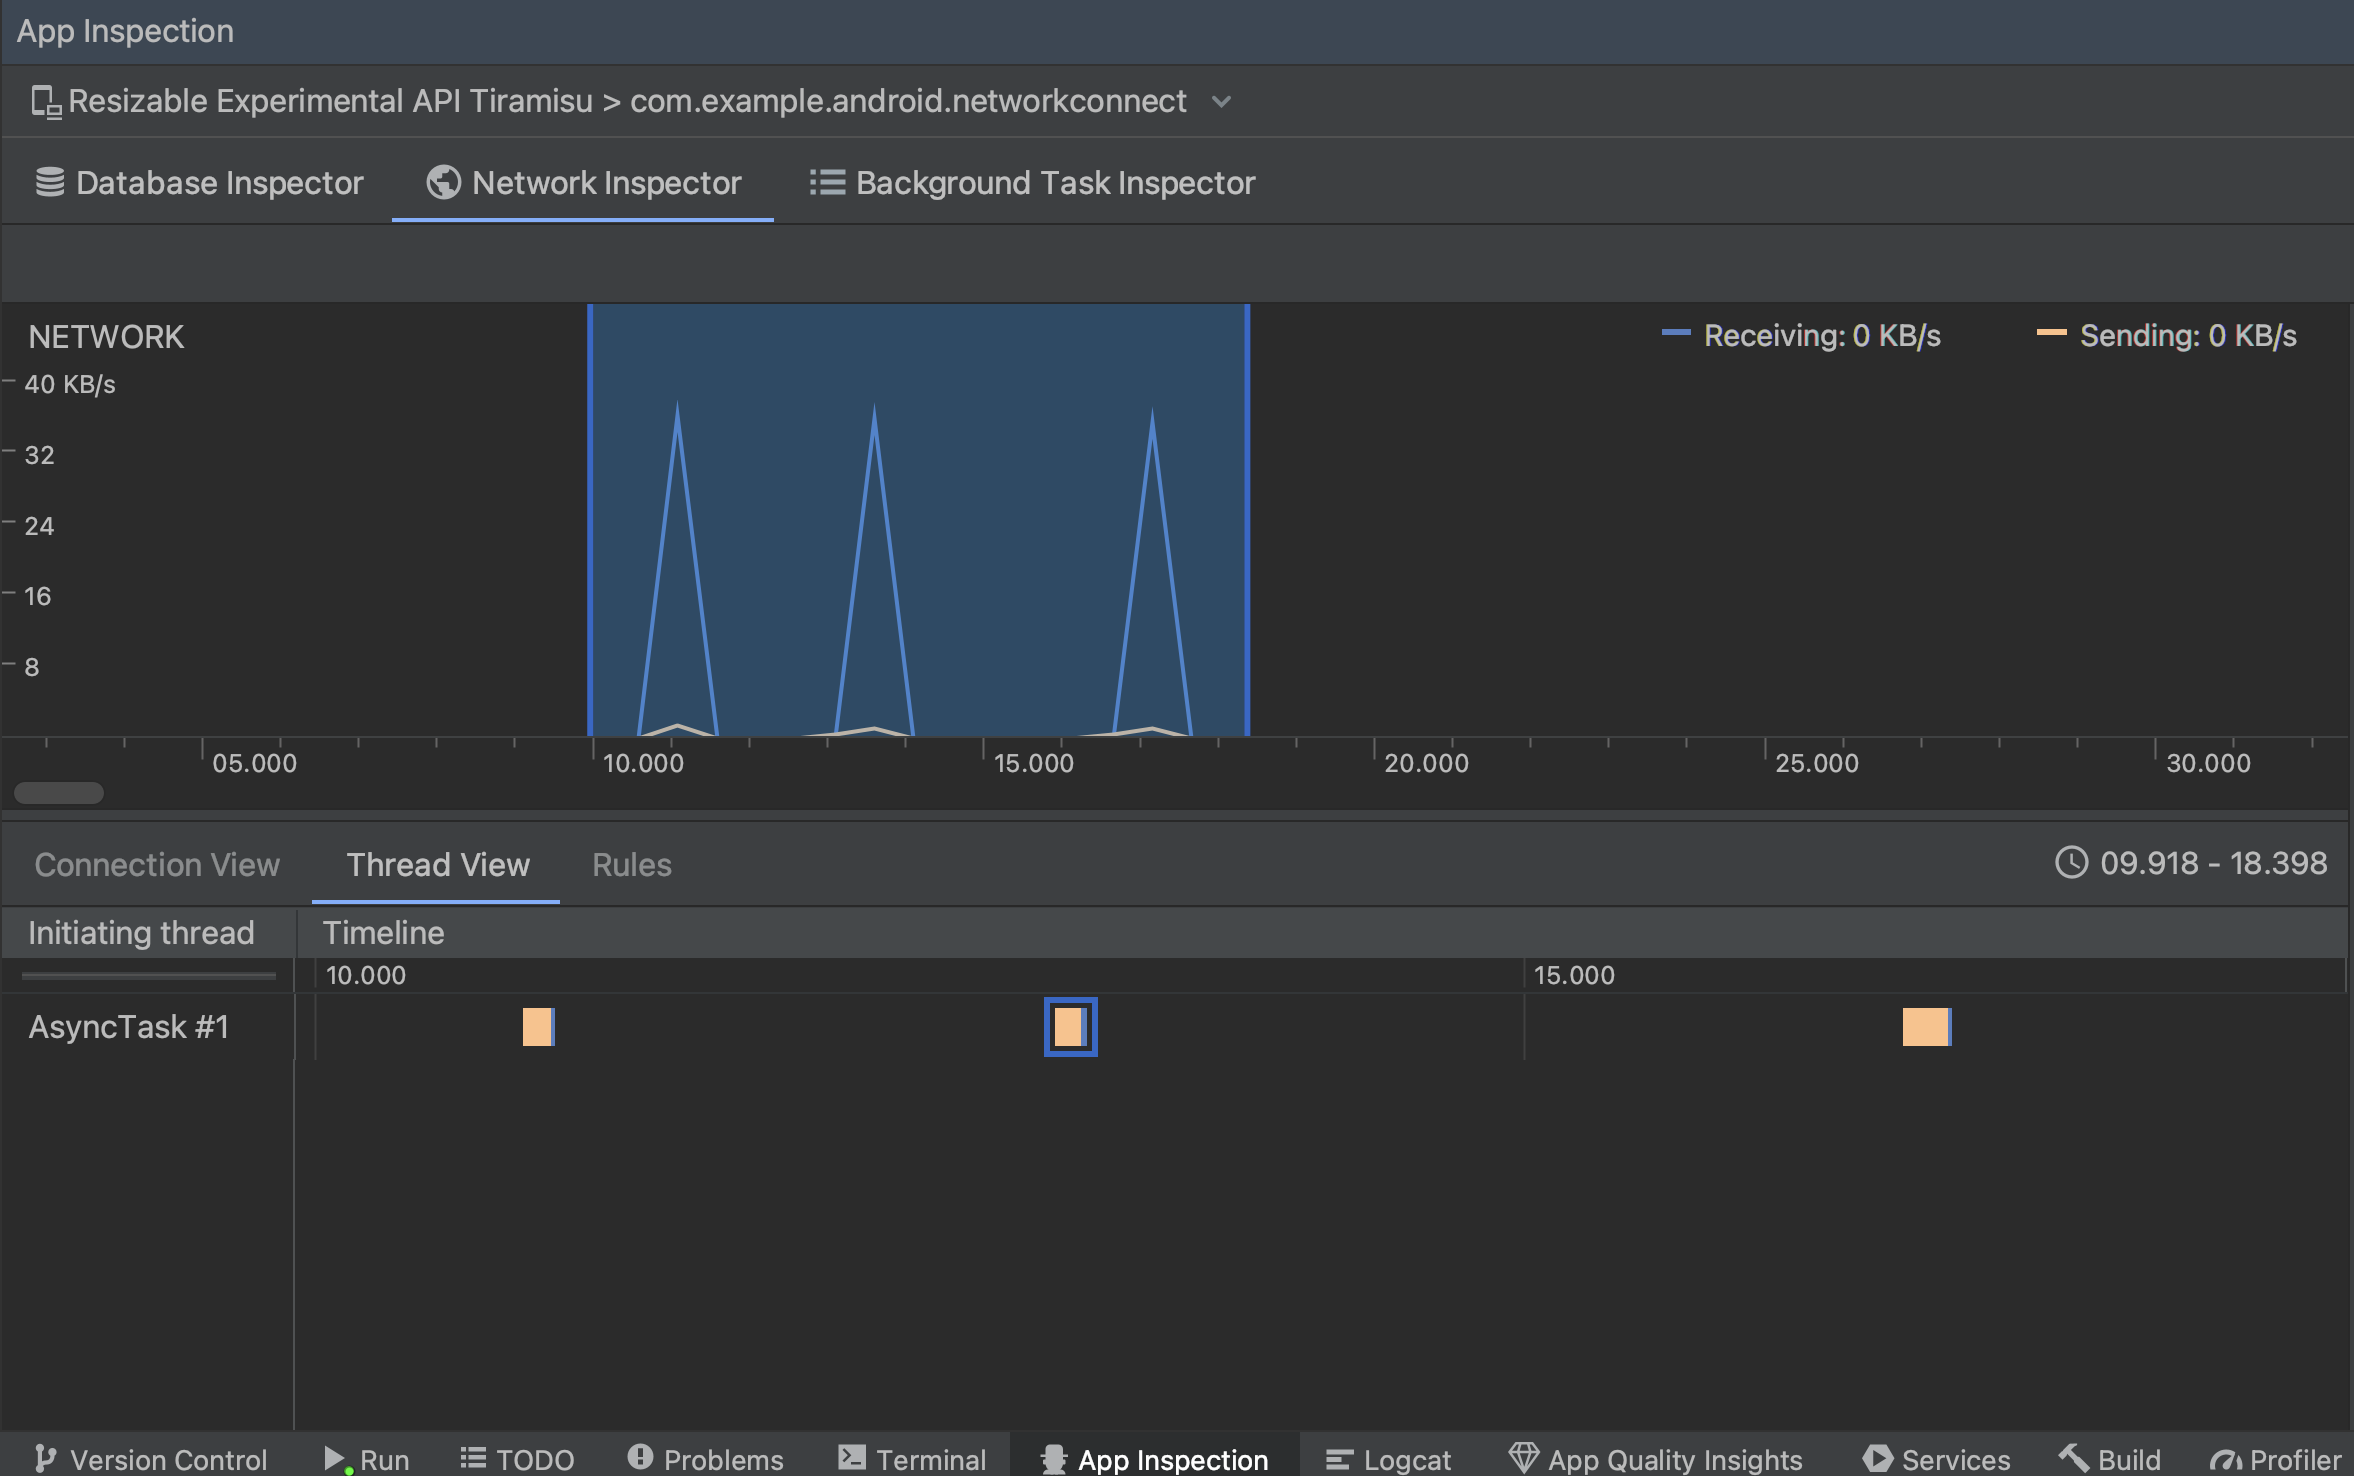
Figure 2. Inspect network requests by app thread in the Thread View. Rules View: Rules help test how your app behaves when encountering responses with different status codes, headers, and bodies. When you create a new rule, name your new rule and include information about the origin of the response you want to intercept under the Origin subsection. In the Response subsection, you can specify where and how to modify the response. For example, you can set the rule to execute on responses with a specific status code as well as modify that status code. In the Header rules and Body rules subsections, create sub-rules that add or modify response headers or bodies. Rules are applied in the order that they're listed. Choose which rule to enable or disable by checking the Active box next to the rule.
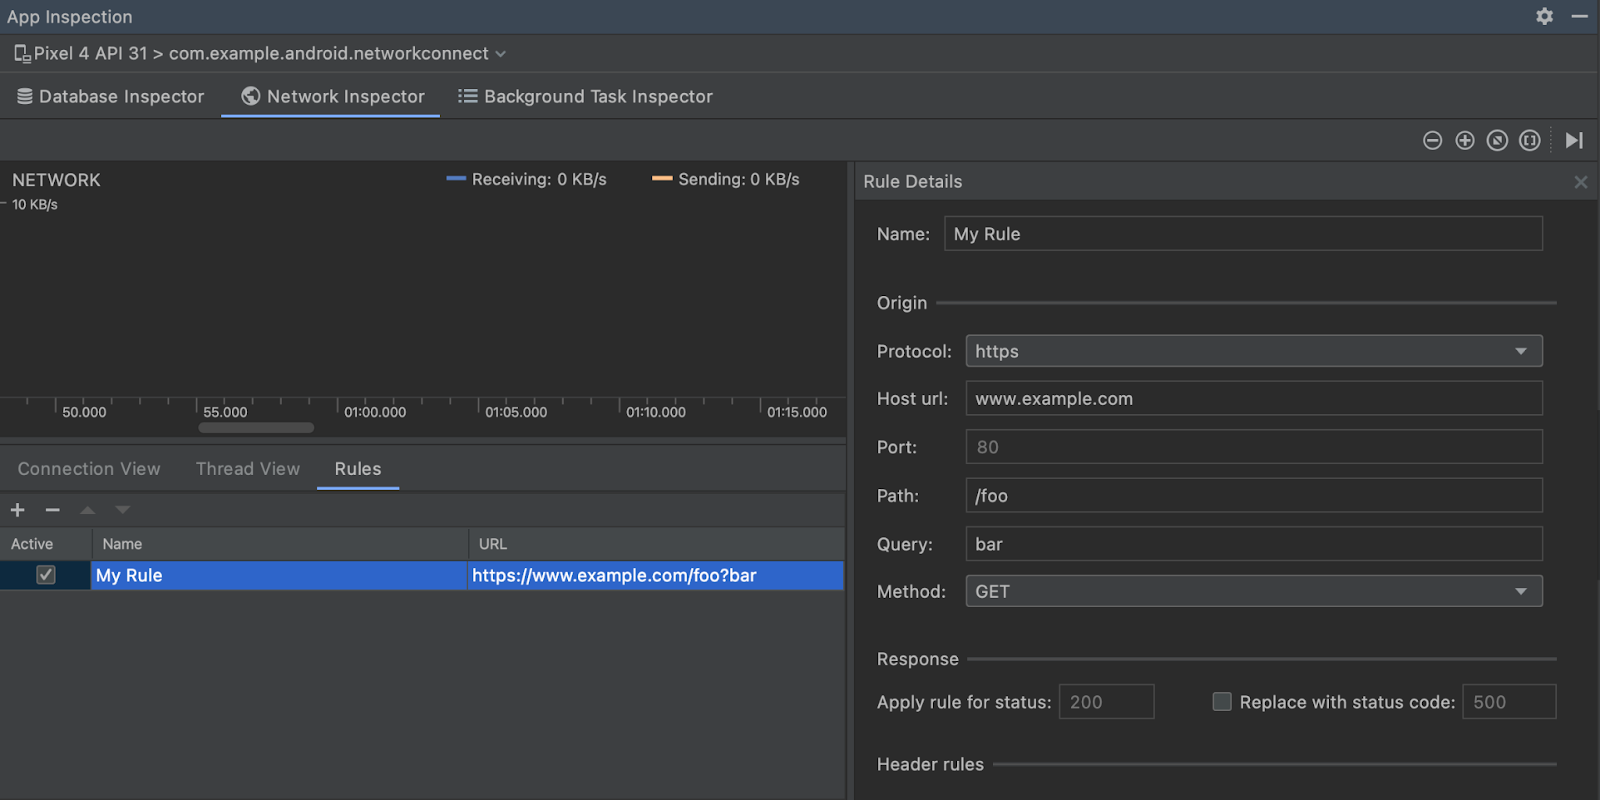
Figure 3. Network Inspector Rules and Rule Details panes.
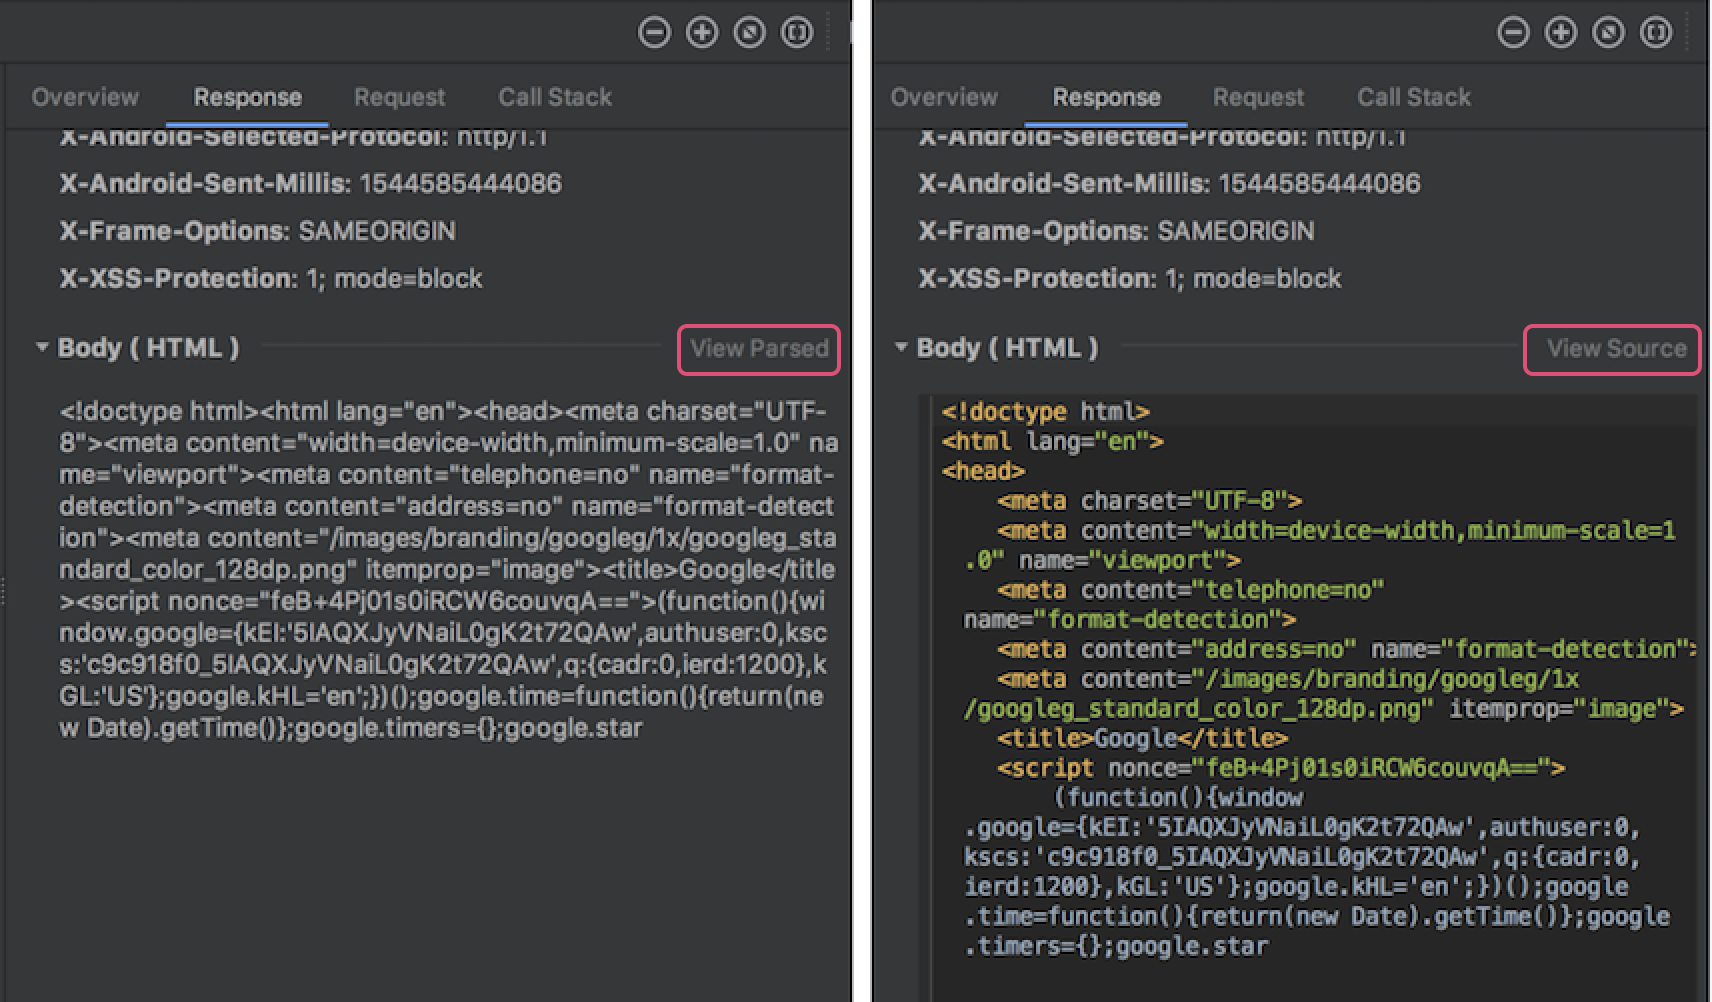
From either the Connection View or Thread View, click a request name to inspect detailed information about the data sent or received. Click the tabs to view the response header and body, request header and body, or call stack.
On the Response and Request tabs, click the View Parsed link to display formatted text. Click the View Source link to display raw text.
In addition to showing network requests for
HttpsURLConnection, Network
Inspector also supports OkHttp.
Some third-party network libraries, such as
Retrofit, use OkHttp
internally, so Network Inspector lets you inspect their network activity. The
Now In Android sample app
uses OkHttp for its network operations and is a good place to see it in
action.
If you are using the
HttpsURLConnection API,
you only see headers in the Request tab that you include in your code using
the
setRequestProperty
method, as shown in the following sample:
Kotlin
val url = URL(MY_URL_EN)
val urlConnection: HttpsURLConnection = url.openConnection() as HttpsURLConnection
...
// Sets acceptable encodings in the request header.
urlConnection.setRequestProperty("Accept-Encoding", "identity")
Java
URL url = new URL(MY_URL_EN);
HttpsURLConnection urlConnection = (HttpsURLConnection) url.openConnection();
//...
// Sets acceptable encodings in the request header.
urlConnection.setRequestProperty("Accept-Encoding", "identity");
Troubleshoot network connection
If the Network Inspector detects traffic values but can't identify any supported network requests, you receive the following error message:
**Network Inspector Data Unavailable:** There is no information for the
  network traffic you've selected.
Currently, the Network Inspector supports only the
HttpsURLConnection
and OkHttp libraries for network
connections. If your app uses another network connection library, you might not
be able to view your network activity in the Network Inspector. If you have
received this error message but your app does use HttpsURLConnection
or OkHttp, report a bug or
search the issue
tracker
to include your feedback in an existing report related to your issue. You
can also use these resources to request support for additional libraries.