
شما میتوانید دادههای خرابی برنامه را از Firebase Crashlytics و Android Vitals مستقیماً در اندروید استودیو مشاهده و روی آنها اقدام کنید. این ادغام، دادههای ردیابی پشته و آمار خرابی را از Crashlytics و Google Play به پنجره ابزار App Quality Insights در Studio IDE منتقل میکند، بنابراین لازم نیست بین مرورگر خود و IDE مدام در حال رفت و آمد باشید. تیمهای توسعه میتوانند از قابلیتهای کلیدی از جمله موارد زیر بهرهمند شوند:
- خطوطی را در کد خود که دادههای رویداد Crashlytics مرتبط دارند، هایلایت شده ببینید.
- برای یافتن خرابیهای اصلی، رد پشته را ببینید و برای پرش به خطوط مربوطه در کد خود، روی رد پشته کلیک کنید.
- خلاصه آمار مربوط به تصادفات و رویدادهای غیرمرگبار برتر را مشاهده کنید، برای مثال، بر اساس سازنده دستگاه و نسخه اندروید گروهبندی شدهاند.
- رویدادها را بر اساس ویژگیها از جمله شدت، زمان و نسخه برنامه فیلتر کنید.
- یک لینک مرورگر دریافت کنید که صفحه داشبورد Crashlytics را با جزئیات بیشتر در مورد رویداد باز میکند.
- بینشهایی کسب کنید که به شما کمک میکند علل ریشهای برخی از مسائل را راحتتر درک و حل کنید.
گزارشهای Android Vitals برای همه برنامههای منتشر شده در Google Play در دسترس هستند. اگر هنوز از Crashlytics استفاده نمیکنید و میخواهید درباره پیشنهادات آن بیشتر بدانید، به Firebase Crashlytics مراجعه کنید.
شروع کنید
برای مشاهده دادههای Crashlytics در اندروید استودیو، باید Firebase و Crashlytics را در پروژه برنامه خود تنظیم کنید. نحوه انجام این کار به این صورت است: با رفتن به Tools > Firebase ، دستیار Firebase را در اندروید استودیو باز کنید، روی Crashlytics کلیک کنید و سپس آموزش افزودن Firebase و Crashlytics به پروژه خود را دنبال کنید. میتوانید اطلاعات بیشتر در مورد گردش کار دستیار Firebase را در راهنمای شروع به کار Firebase برای اندروید بخوانید.
اگر قبلاً Firebase و Crashlytics را به برنامه خود اضافه کردهاید، با کلیک روی نماد آواتار، وارد حساب توسعهدهنده خود در IDE شوید.![]() پس از ورود به سیستم، روی پنجره ابزار App Quality Insights کلیک کنید.
پس از ورود به سیستم، روی پنجره ابزار App Quality Insights کلیک کنید.![]() شما باید ببینید که پنلها با گزارشهایی از Crashlytics پر شدهاند.
شما باید ببینید که پنلها با گزارشهایی از Crashlytics پر شدهاند.
تجزیه و تحلیل موارد حیاتی اندروید
«اطلاعات کیفیت برنامه» شامل دادههای «نکات حیاتی اندروید» است. این به شما امکان میدهد راحتتر به معیارهای اصلی جمعآوریشده توسط گوگل پلی دسترسی داشته باشید و تجربه کاربری خود را بهبود بخشید. از «نکات حیاتی اندروید» برای رسیدگی به مشکلات مربوط به پایداری برنامه استفاده کنید تا به بهبود کیفیت برنامه خود در گوگل پلی کمک کنید.
شما میتوانید مشکلات مربوط به موارد حیاتی اندروید را مشاهده کنید، آنها را فیلتر کنید و از طریق پنجره ابزار App Quality Insights از stack trace به code all بروید. برای شروع، این مراحل را دنبال کنید:
- با استفاده از آیکون پروفایل، وارد حساب توسعهدهنده خود در اندروید استودیو شوید.
 در انتهای نوار ابزار
 - با کلیک روی پنجره ابزار در اندروید استودیو یا کلیک روی View > Tool Windows > App Quality Insights، App Quality Insights را باز کنید.
- روی برگه «نکات حیاتی اندروید» در بخش «بینش کیفیت برنامه» کلیک کنید.
اختیاری: برای استفاده از یکپارچهسازی کنترل نسخه برای یک نسخه قابل اشکالزدایی، آخرین نسخه Firebase Crashlytics SDK (یا Firebase Android Bill of Materials) را به برنامه خود اضافه کنید. سپس کد زیر را به فایل
build.gradle.ktsیاbuild.gradleدر سطح ماژول اضافه کنید. نسخههای Release (غیر قابل اشکالزدایی) به طور پیشفرض این پرچم را فعال دارند.
کاتلین
android {
  buildTypes {
    getByName("debug") {
      vcsInfo {
        include = true
      }
    }
  }
}
گرووی
android {
  buildTypes {
    debug {
      vcsInfo {
        include true
      }
    }
  }
}
تجزیه و تحلیل دادههای Crashlytics در اندروید استودیو
پنجره ابزار App Quality Insights دادههای غنیای دارد که به شما بینشی در مورد رویدادهایی که کاربرانتان با آنها مواجه میشوند میدهد و پیوندهایی برای کمک به شما در جهتیابی سریع به منابع آن رویدادها ارائه میدهد.
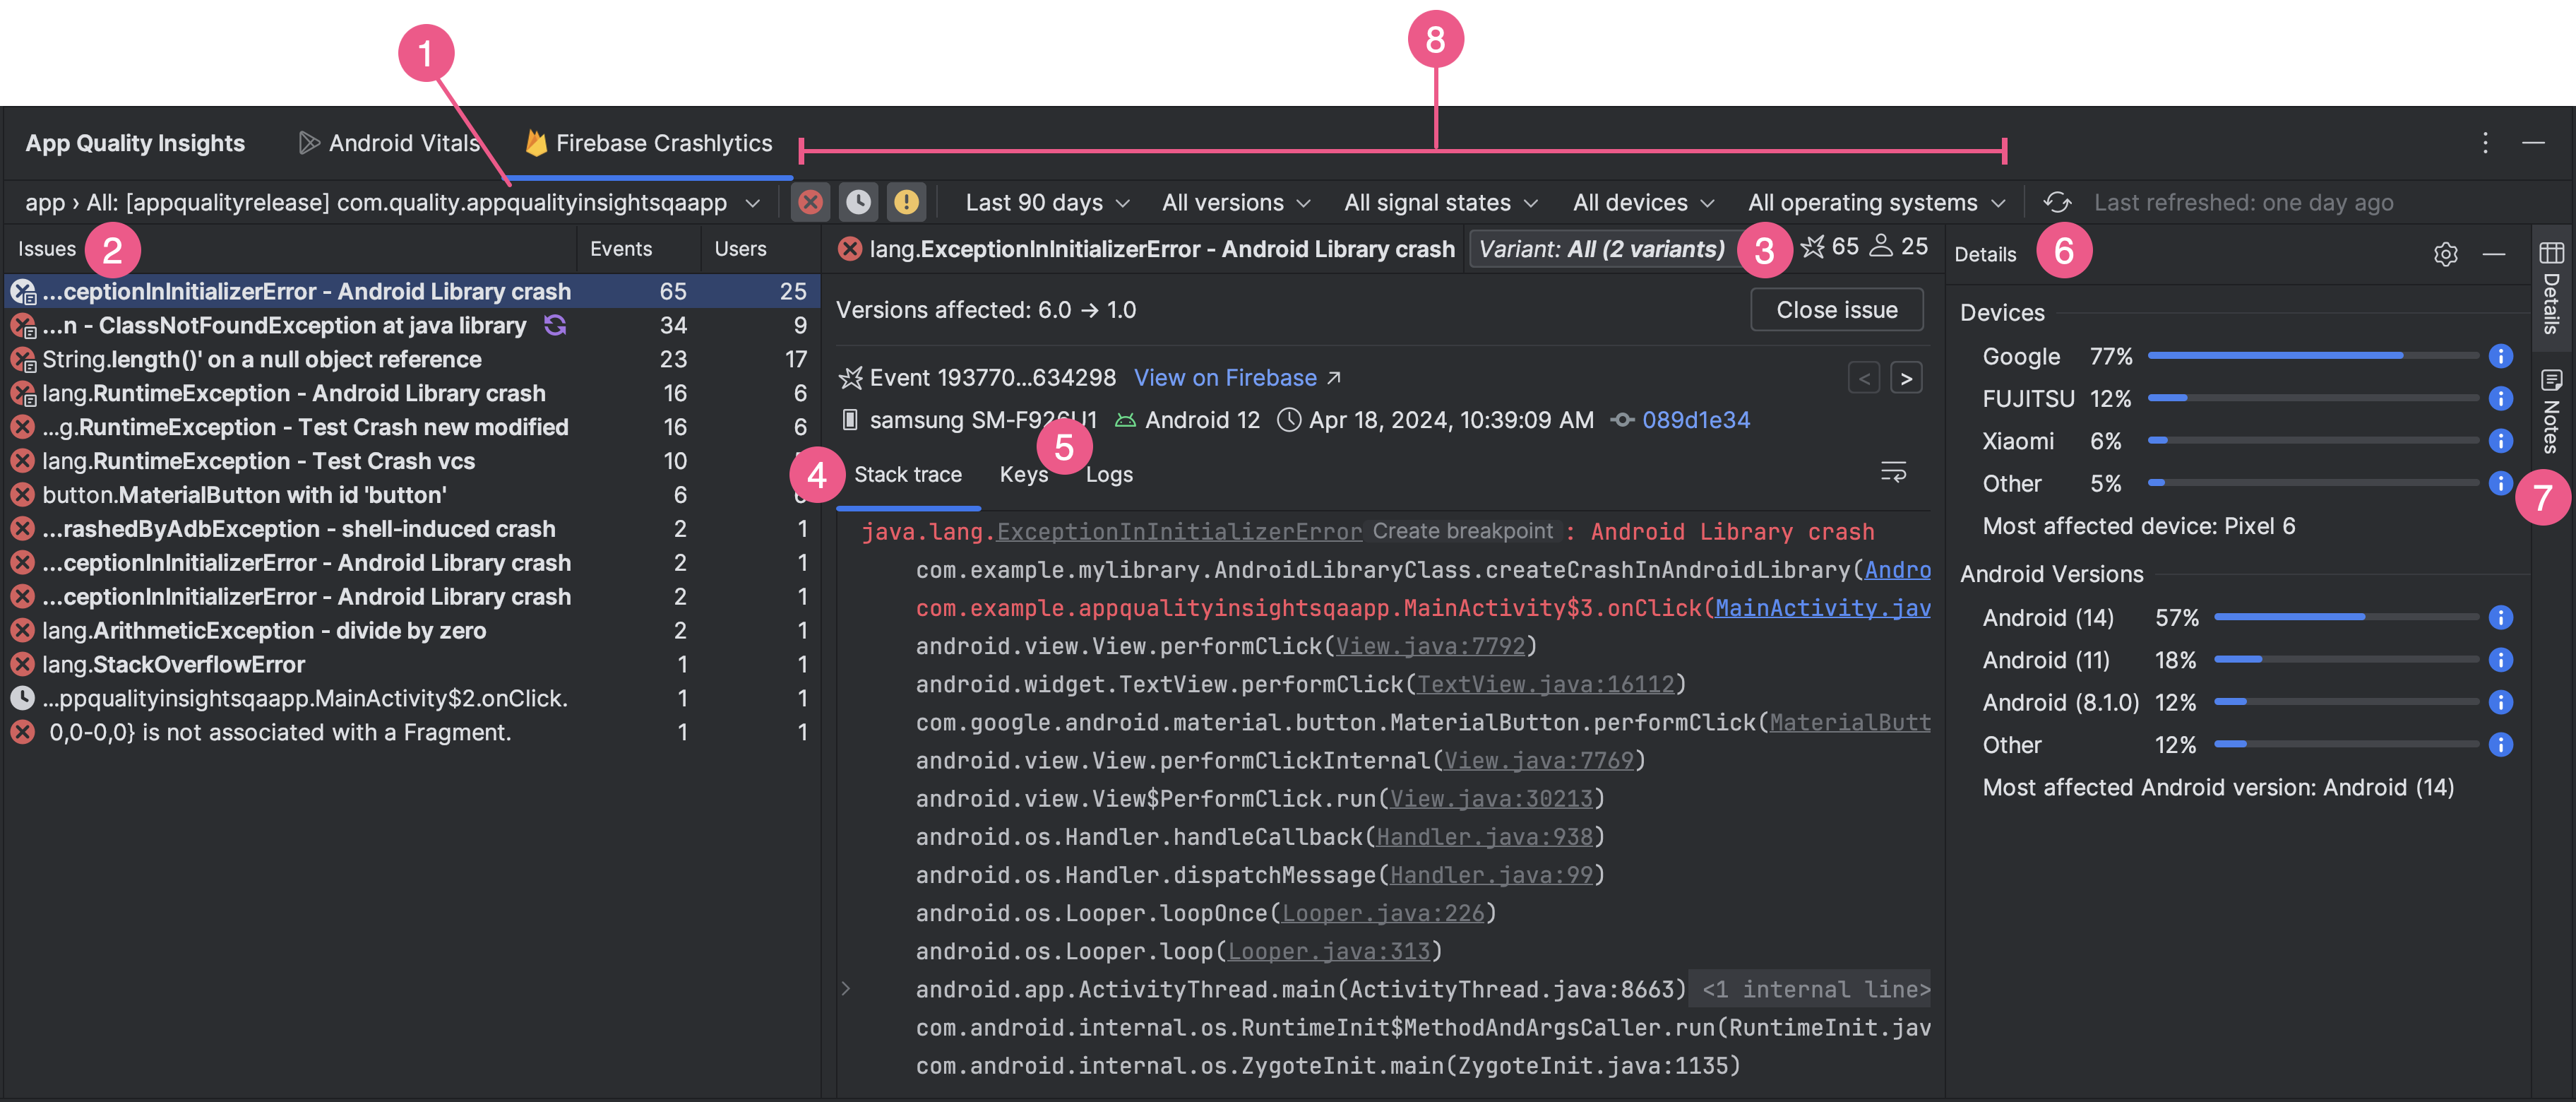
- از منوی کشویی شناسه برنامه برای انتخاب شناسه برنامهای که میخواهید تجزیه و تحلیل کنید، استفاده کنید. برای مثال، در حالی که ممکن است روی نسخه اشکالزدایی برنامه خود در IDE کار کنید، ممکن است بخواهید دادههای رویداد را برای نسخه عملیاتی برنامه خود که کاربران شما نصب میکنند، مشاهده کنید.
- پنل مشکلات ، رویدادهای مهمی را که Crashlytics دادههای مربوط به آنها را دارد، نشان میدهد و بر اساس تأثیرگذارترین مشکلات شما مرتب شده است.
- رویدادها را بر اساس گونهها یا گروههایی از رویدادها که ردپای پشتهای مشابهی دارند، مشاهده کنید. تجزیه و تحلیل رویدادها بر اساس گونه به شما کمک میکند تا علل اصلی خرابی را شناسایی کنید.
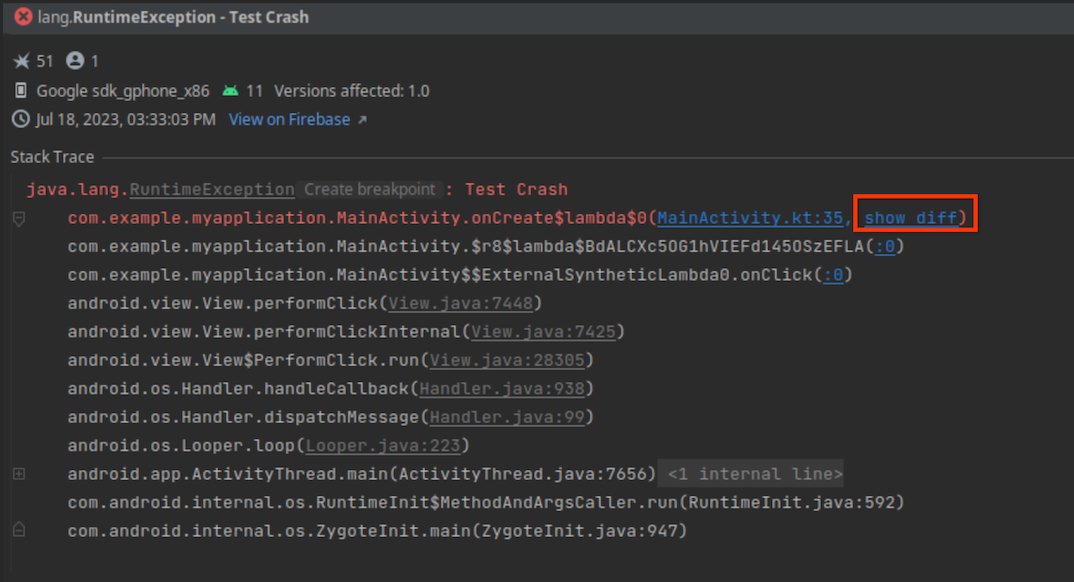
تب Stack trace جزئیات مربوط به آخرین رخداد رویدادی را که در پنل Issues روی آن کلیک میکنید، نشان میدهد. میتوانید stack trace رویداد را مشاهده کنید و روی stack trace کلیک کنید تا به خطوط مربوطه در codebase خود بروید. اگر کد شما از زمان وقوع خرابی تغییر کرده است، روی show diff در کنار خطا در stack trace کلیک کنید تا تفاوت بین کد فعلی خود و نسخه codebase که باعث خرابی شده است را مشاهده کنید.
همچنین اطلاعاتی در مورد نوع دستگاه آسیبدیده، نسخه اندروید آن و زمان وقوع رویداد و همچنین پیوندی به رویداد در داشبورد Firebase Crashlytics وجود دارد. برای مرور اطلاعات مربوط به چندین رویداد در یک گروه، از فلشهای چپ و راست استفاده کنید. برای بستن یک مشکل مستقیماً از پنل، روی بستن مشکل کلیک کنید.
- تبهای Keys و Logs جفتهای کلید-مقدار سفارشی و گزارشهای مربوط به هر گزارش Crashlytics را نشان میدهند.
- پنل جزئیات ، تعداد خرابیها را بر اساس نوع دستگاه و نسخه اندروید تفکیک میکند، بنابراین میتوانید تعیین کنید که کدام گروههای کاربری بیشترین آسیب را دیدهاند. همچنین نشان میدهد که کدام نسخههای برنامه دچار خرابی شدهاند و تعداد کاربران آسیبدیده چقدر است.
- یادداشتها را بخوانید و به مسائل پیوست کنید تا در کنسول Firebase و همتیمیهایتان قابل مشاهده باشند. برای نوشتن یادداشت در مورد یک مسئله، مسئله را انتخاب کنید و پنل یادداشتها را باز کنید. برای نوشتن یادداشت باید مجوز نوشتن در پروژه Crashlytics را داشته باشید. مسائلی که دارای یادداشت هستند با نماد "یادداشتها" ظاهر میشوند.
 در پنل مسائل .
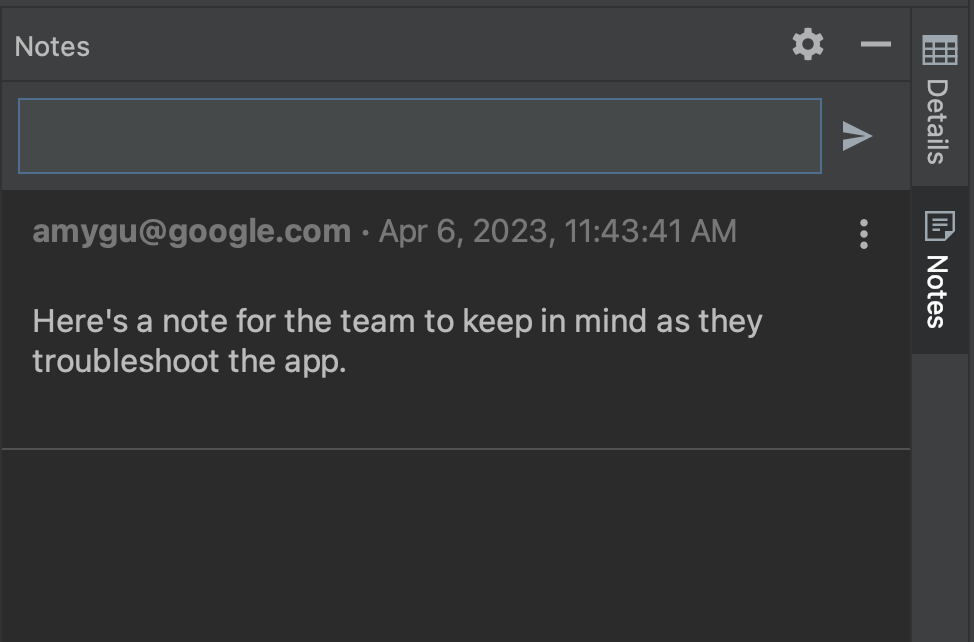
- از فیلترهای متنوع برای تمرکز بیشتر روی زیرمجموعههای خاصی از رویدادها استفاده کنید. میتوانید رویدادهایی را که سرنوشتساز هستند انتخاب یا لغو انتخاب کنید.
 ، غیرکشنده
 و ANR ها
 و همچنین بر اساس زمان، نسخه برنامه، سیگنال Crashlytics ، ساخت و مدل دستگاه و نسخه پلتفرم اندروید فیلتر کنید. توجه داشته باشید که برای حالتهای سیگنال Crashlytics، یک مشکل زمانی برگشتپذیر در نظر گرفته میشود که در گذشته بسته شده باشد و دوباره در نسخه جدید برنامه رخ داده باشد.
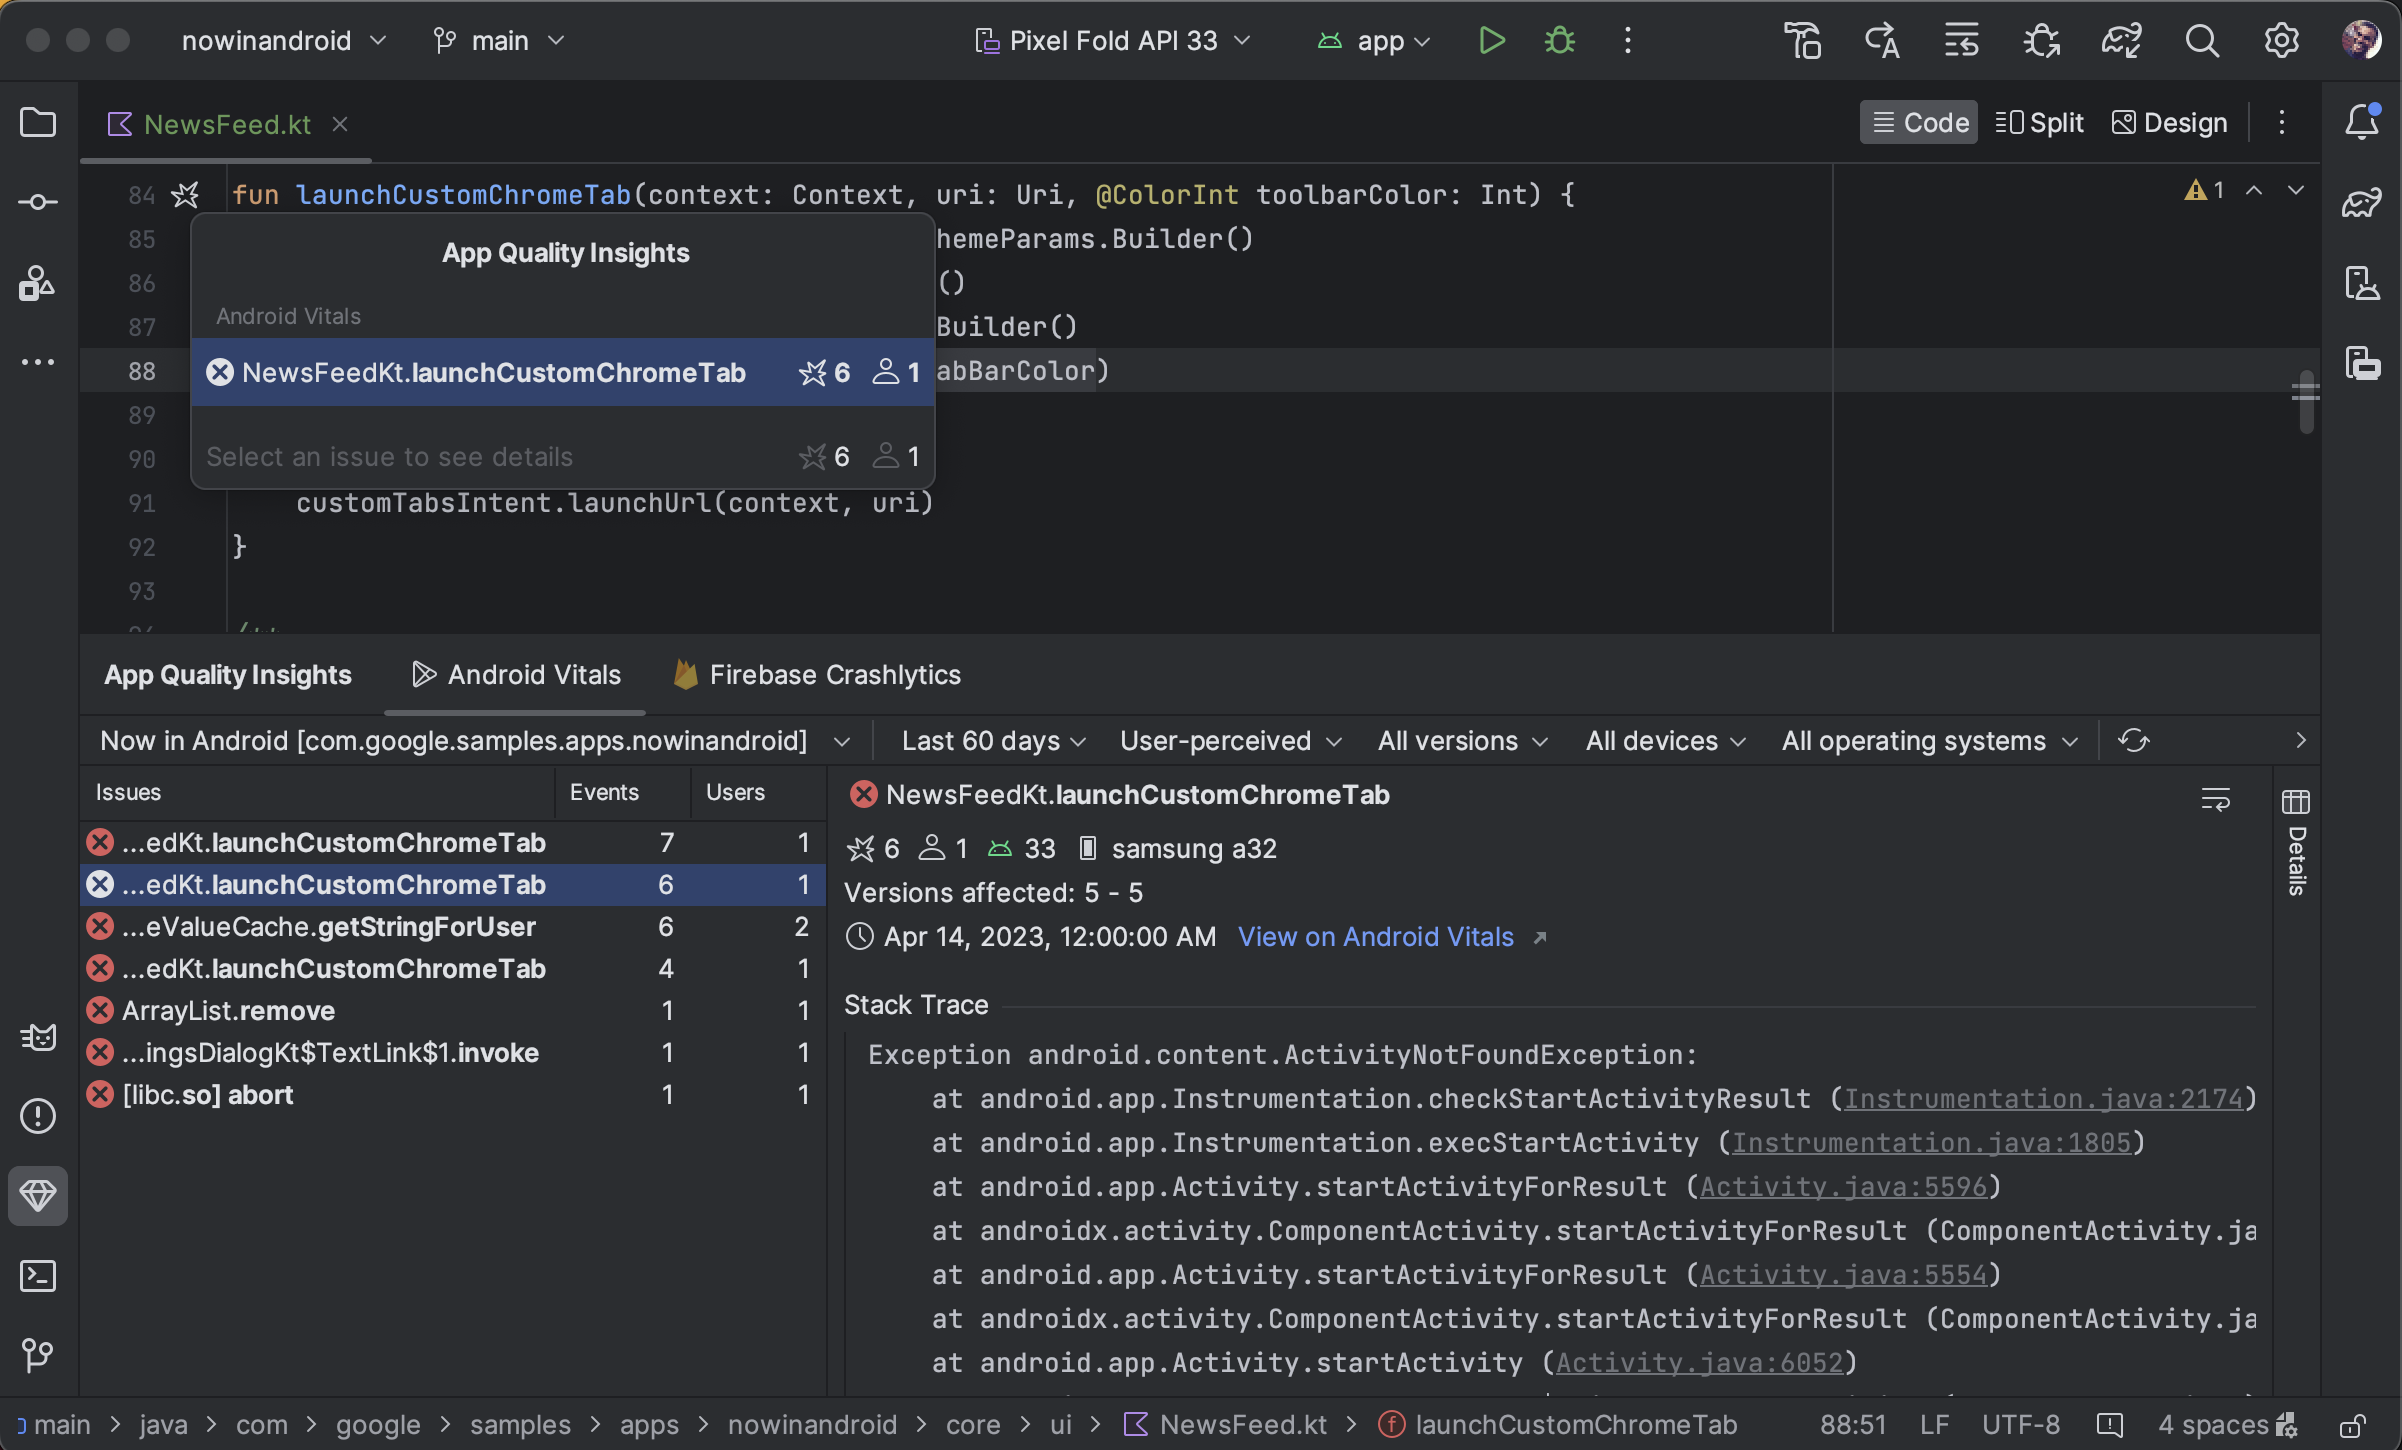
علاوه بر اینکه میتوانید از stack trace به کد دیگر بروید، میتوانید از کدی به stack trace دیگر نیز پرش کنید: اندروید استودیو اکنون خطوط کدی را که مربوط به خرابیها هستند با یک آیکون ناودانی مربوط به خرابی حاشیهنویسی میکند.![]() تا بتوانید به راحتی آنها را تشخیص داده و اشکالزدایی کنید.
تا بتوانید به راحتی آنها را تشخیص داده و اشکالزدایی کنید.
وقتی نشانگر ماوس را روی آیکون کرش نگه میدارید، یک پنجره بازشو ظاهر میشود که تعداد رویدادهایی که آن خط کد را شامل میشوند و فراوانی رویدادها را نشان میدهد.
![]()
برای مشاهده فهرست دقیقتری از رویدادها، از جمله فراوانی و تعداد کاربرانی که تحت تأثیر یک رویداد خاص قرار گرفتهاند، روی نماد خرابی کلیک کنید. برای پرش به جزئیات رویداد در پنجره ابزار App Quality Insights ، روی یک رویداد خاص کلیک کنید.
![]()
اعداد متفاوت بین Android Vitals و Crashlytics
توجه داشته باشید که Android Vitals و Crashlytics ممکن است مقادیر متفاوتی را برای تعداد کاربران و رویدادهای مرتبط با یک خرابی مشابه گزارش دهند. این اختلافات به این دلیل اتفاق میافتد که Play و Crashlytics میتوانند خرابیها را در زمانهای مختلف و برای کاربران مختلف ثبت کنند. در اینجا چند دلیل برای تفاوت تعداد Play و Crashlytics آورده شده است:
- Play کرشهایی که از زمان بوت شروع میشوند را شناسایی میکند، در حالی که Crashlytics کرشهایی را که پس از راهاندازی اولیه Crashlytics SDK رخ میدهند، شناسایی میکند.
- اگر کاربری هنگام خرید گوشی جدید از گزارش خرابی انصراف دهد، آن خرابیها به Play گزارش نمیشوند؛ با این حال، Crashlytics بر اساس سیاست حفظ حریم خصوصی خود برنامه، خرابیها را ثبت میکند.
با قابلیت محدود در حالت آفلاین تحقیق کنید
اگر درخواست جدیدی ایجاد کنید، مثلاً با کلیک روی Refresh ، و اندروید استودیو نتواند با Crashlytics ارتباط برقرار کند، پنجره App Quality Insights به شما امکان میدهد وارد حالت آفلاین شوید.
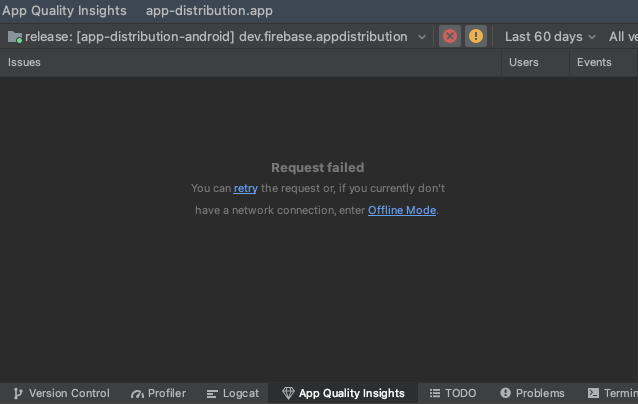
در این حالت، میتوانید به بررسی مشکلات و آخرین رویدادها از دادههای ذخیرهشده ادامه دهید. برخی از قابلیتها، مانند تغییر برخی از گزینههای فیلتر یا بستن مشکلات، در دسترس نیستند. برای امتحان مجدد اتصال خود به Crashlytics و بازگشت به حالت آنلاین، روی اتصال مجدد کلیک کنید.![]() .
.
مجوزها
مجوزهای سرویس را ببینید.