반응이 느리거나 애니메이션이 끊기거나 작동을 멈추거나 전력을 많이 소모하면 앱 성능이 저하된 것으로 간주됩니다. 성능 문제를 해결하려면 앱을 프로파일링하거나 앱이 CPU, 메모리, 그래픽, 기기 배터리와 같은 리소스를 비효율적으로 사용하는 영역을 식별해야 합니다. 이 주제에서는 일반적인 성능 문제를 해결하는 데 사용할 수 있는 Android 스튜디오 도구와 기법을 설명합니다.
전체 Android 스튜디오 IDE를 실행하지 않고 독립형 프로파일러를 실행하는 방법을 알아보려면 독립형 프로파일러 실행을 참고하세요.
요구사항
앱을 프로파일링하려면 다음을 갖추는 것이 좋습니다.
profileable 매니페스트 구성이 사용 설정된 출시 빌드 변형이 있는 앱(프로파일링 가능한 앱이라고도 함). 기본적으로 앱의 이 구성은 true로 설정됩니다. 이 구성을 확인하거나 변경하려면 앱의 매니페스트 또는 AndroidManifest.xml 파일을 열고 <application> 섹션에서 profileable 매니페스트 구성을 찾습니다.
<profileable android:shell="true" />
API 수준 29 이상을 실행하고 Google Play가 설치된 가상 또는 실제 테스트 기기
Android Gradle 플러그인 7.3 이상
프로파일링 가능한 앱과 디버그 가능한 앱
프로파일링 가능한 앱을 사용하면 대부분의 일반적인 프로파일링 작업을 실행할 수 있지만 Java/Kotlin 할당을 기록하거나 힙 덤프를 캡처해야 하는 경우 대신 디버그 가능한 앱을 사용해야 합니다. 디버그 가능한 앱 프로세스와 API 수준 26 이상을 실행하는 기기에서는 이를 제공하는 작업 뷰에서 사용자 상호작용 및 앱 수명 주기 이벤트를 보여주는 상호작용 타임라인도 볼 수 있습니다.
디버그 가능한 앱은 앱의 debug 빌드 변형을 기반으로 하며 디버거와 같은 개발 도구를 사용할 수 있습니다. 그러나 성능 비용이 약간 발생합니다. 프로파일링 가능한 앱은 앱의 release 빌드 변형을 기반으로 하며 디버그 빌드의 성능 오버헤드 없이 일반적인 프로파일링 작업의 하위 집합을 사용 설정합니다.
프로파일링 가능한 앱 빌드 및 실행
Android 스튜디오에서 프로파일링 가능한 앱을 빌드하고 실행하려면 다음 단계를 따르세요.
작업 더보기
> 오버헤드가 낮은 '앱' 프로파일링 또는 완전한 데이터로 '앱' 프로파일링을 클릭합니다. 여기서 '앱'은 실행 구성의 이름이므로 사용자마다 다를 수 있습니다. 두 옵션 중에서 선택하려면 요구사항을 참고하세요.
앱이 테스트 기기에서 열리고 Android 스튜디오에서 프로파일러 창이 열립니다.
프로파일러 창의 홈 탭에 있는 목록에서 프로세스를 선택합니다. 대부분의 경우 앱을 나타내는 최상위 프로세스를 선택하는 것이 좋습니다.
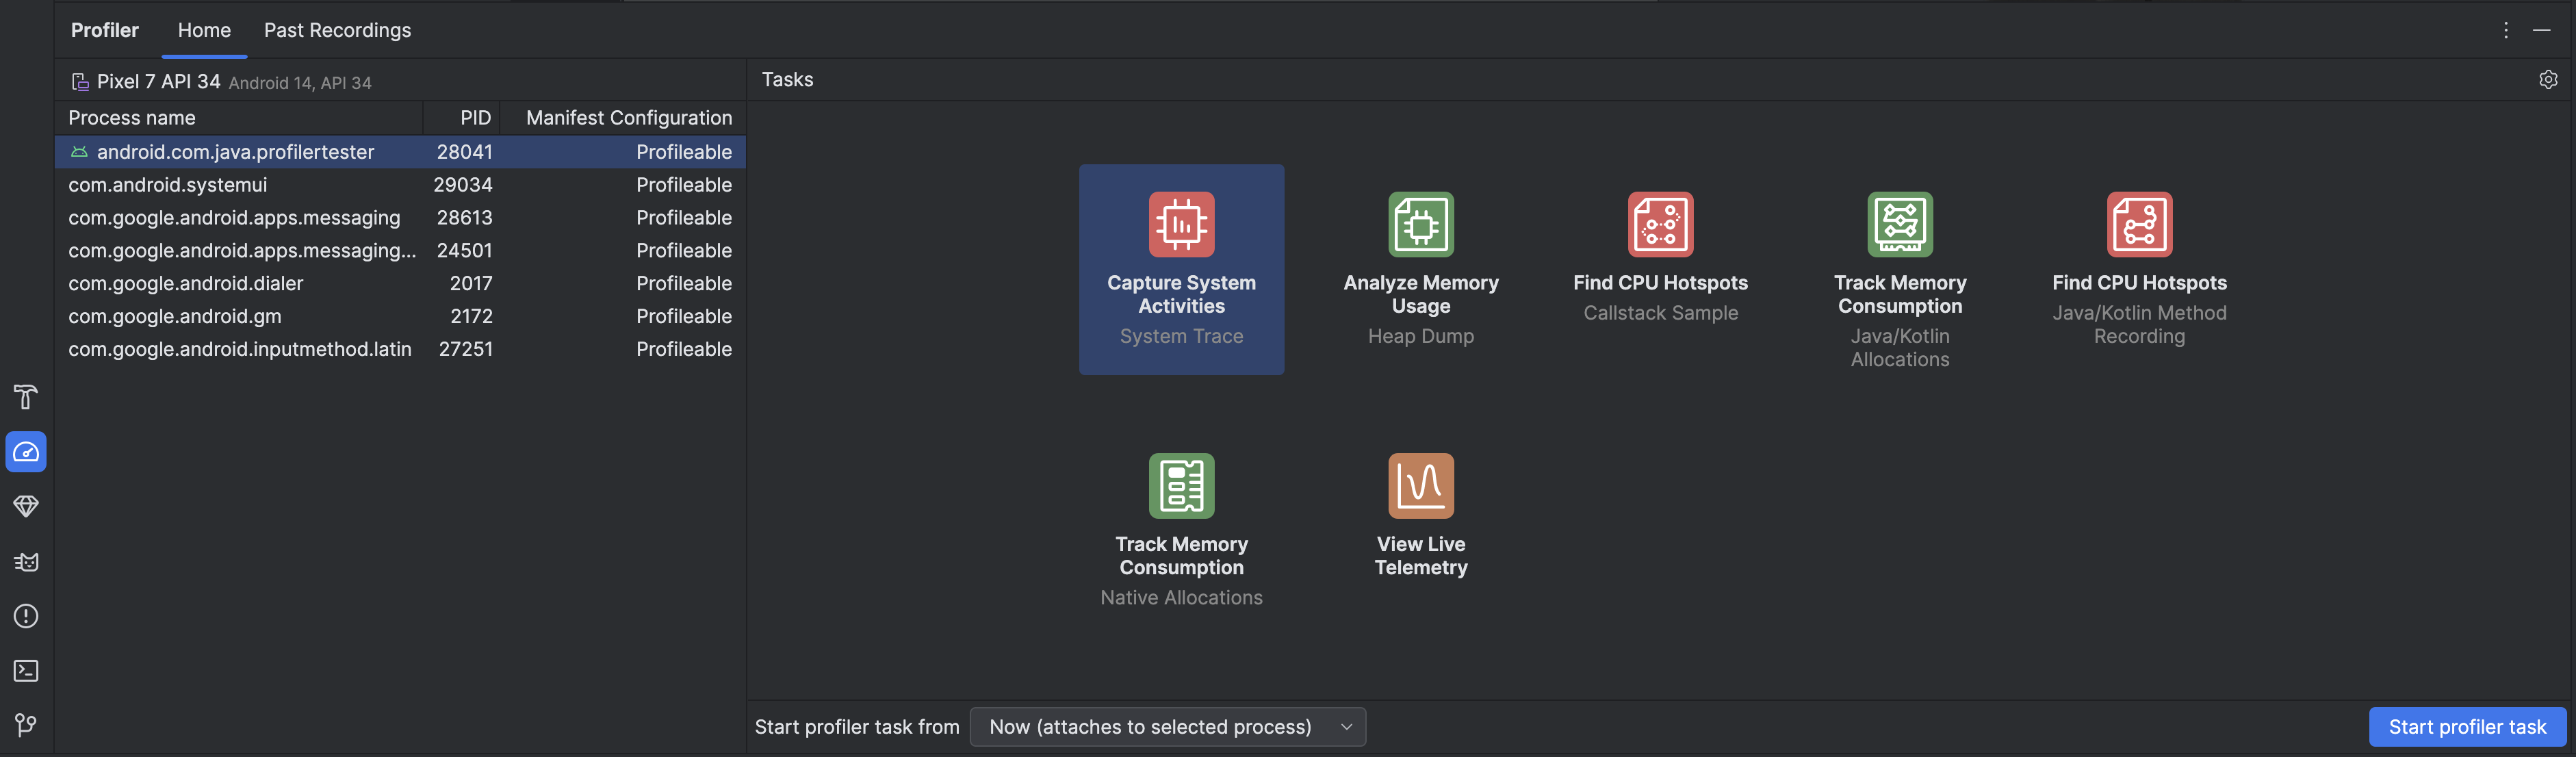
Tasks 섹션에서 프로파일링 작업을 선택합니다. 작업에 관한 자세한 내용은 이 섹션의 다른 페이지를 참고하세요. 일부 프로파일링 작업은 일부 프로세스에서만 사용할 수 있습니다. 어디서부터 시작해야 할지 모르겠다면 실시간으로 앱을 검사하여 실적 활동을 전반적으로 살펴보세요.
프로파일러 작업 시작 위치 드롭다운을 사용하여 시작 시 프로파일러 작업을 시작할지 아니면 프로세스가 실행 중일 때 프로세스에 연결할지 선택합니다. 앱 시작 시간을 개선하거나 앱 시작 중에 발생하는 프로세스를 캡처하려는 경우 시작을 포함해야 합니다. 그렇지 않으면 앱의 현재 상태에서 프로파일링을 시작할 수 있습니다.
프로파일러 작업 시작을 클릭합니다. 작업이 자체 탭에서 시작됩니다.
활동이 트리거되도록 앱과 상호작용합니다.
녹음을 중지하고 (해당하는 경우) 파싱될 때까지 기다린 후 결과를 확인합니다.
트레이스 비교, 내보내기, 가져오기
프로파일링 작업을 중지하면 프로파일러 창의 이전 녹화 파일 탭에 자동으로 저장됩니다. 저장된 녹화 파일을 사용하여 여러 시나리오의 리소스 사용량을 비교할 수 있습니다. 녹음 파일은 현재 Android 스튜디오 세션이 진행되는 동안 저장됩니다. 더 오래 보관하려면 녹음 파일 내보내기를 클릭하여 내보내세요.
일부 트레이스 유형은 내보낼 수 없습니다.
이전 Android 스튜디오 실행에서 트레이스를 가져오려면 이전 녹화 파일 탭에서 녹화 파일 가져오기를 클릭하고 트레이스 파일을 선택합니다. 파일을 Android 스튜디오 편집기 창으로 드래그하여 가져올 수도 있습니다.
녹화 구성 수정
프로파일러 작업 녹화 구성을 수정하려면 프로파일러 설정 을 클릭합니다.
전환할 수 있는 두 가지 기본 설정이 있습니다.
샘플링이 포함된 태스크의 경우 샘플 간격은 각 샘플 간의 시간을 나타냅니다. 더 짧은 간격을 지정할수록 기록된 데이터의 파일 크기 한도에 더 빠르게 도달할 수 있습니다.
파일 크기 한도는 연결된 기기에 쓸 수 있는 데이터의 양을 나타냅니다. 기록을 중지하면 Android 스튜디오가 이 데이터를 파싱하여 프로파일러 창에 표시합니다. 한도를 늘리고 대량의 데이터를 기록하면 Android 스튜디오가 파일을 파싱하는 데 훨씬 더 오래 걸리고 응답하지 못하게 될 수도 있습니다.
이 페이지에 나와 있는 콘텐츠와 코드 샘플에는 콘텐츠 라이선스에서 설명하는 라이선스가 적용됩니다. 자바 및 OpenJDK는 Oracle 및 Oracle 계열사의 상표 또는 등록 상표입니다.
최종 업데이트: 2024-11-22(UTC)
[[["이해하기 쉬움","easyToUnderstand","thumb-up"],["문제가 해결됨","solvedMyProblem","thumb-up"],["기타","otherUp","thumb-up"]],[["필요한 정보가 없음","missingTheInformationINeed","thumb-down"],["너무 복잡함/단계 수가 너무 많음","tooComplicatedTooManySteps","thumb-down"],["오래됨","outOfDate","thumb-down"],["번역 문제","translationIssue","thumb-down"],["샘플/코드 문제","samplesCodeIssue","thumb-down"],["기타","otherDown","thumb-down"]],["최종 업데이트: 2024-11-22(UTC)"],[],[],null,["# Profile your app performance\n\nAn app has poor performance if it responds slowly, shows choppy animations,\nfreezes, or consumes too much power. Fixing performance problems involves\n*profiling* your app, or identifying areas in which your app makes inefficient\nuse of resources such as the CPU, memory, graphics, or the device\nbattery. This topic describes the Android Studio tools and techniques to use to\nfix common performance problems.\n\nTo learn how to run standalone profilers without running the entire Android\nStudio IDE (Windows or Linux only), see\n[Run the standalone profiler](/studio/profile/standalone-profiler).\n\nRequirements\n------------\n\nTo profile your app, we recommend having the following:\n\n- An app with a release build variant that has the `profileable` manifest\n configuration enabled, also known as a profileable app. By default, apps have\n this configuration set to true. To check or change this configuration open\n your app's manifest or `AndroidManifest.xml` file and look in the\n `\u003capplication\u003e` section for the\n [`profileable`](/guide/topics/manifest/profileable-element) manifest\n configuration:\n\n \u003cprofileable android:shell=\"true\" /\u003e\n\n | **Note:** Use a [debuggable](/studio/debug) app instead of a profileable app if you need to record Java/Kotlin allocations, capture a heap dump, or see the **Interaction** timeline in task views that provide it.\n- A virtual or physical test device that runs API level 29 or higher and has\n Google Play.\n\n- Android Gradle Plugin 7.3 or higher.\n\n### Profileable v. debuggable apps\n\nA profileable app lets you do most common profiling tasks, but you should use a\n[debuggable](/studio/debug) app instead if you need to record Java/Kotlin\nallocations or capture a heap dump. A debuggable app process and device running\nAPI level 26 or higher also lets you see the **Interaction** timeline, which\nshows user interaction and app lifecycle events, in task views that provide it.\n\nA debuggable app is based on the `debug` build variant of your app and lets you\nuse development tools such as the [debugger](/studio/debug); however, it comes\nwith some performance costs. A profileable app is based on the `release` build\nvariant of your app and enables a subset of common profiling tasks without the\nperformance overhead of the debug build.\n| **Note:** In Android Studio, click **Profile 'app' with low overhead** to use a profileable app and click **Profile 'app' with complete data** to use a debuggable app.\n\nBuild and run a profileable app\n-------------------------------\n\nTo build and run a profileable app in Android Studio, follow these steps:\n\n1. [Create a run/debug configuration](/studio/run/rundebugconfig) if you don't already have one.\n2. Select your release build variant (**Build \\\u003e Select Build Variant**).\n3. Click **More actions\n \\\u003e Profile 'app' with low overhead** or **Profile 'app' with complete data** (\"app\" is the name of the run configuration, so it might be different for you). To choose between the two options, see [Requirements](#requirements). The app opens on your test device and the **Profiler** pane opens in Android Studio.\n\nIf these instructions don't work for you, see [Build and run a profileable app\nmanually](/studio/profile/build-run-manually).\n\nStart profiling\n---------------\n\nTo start a profiling task, follow these steps:\n\n1. Select a process from the list in the **Home** tab within the **Profiler**\n pane. In most cases, you'll want to select the top process that represents\n your app.\n\n2. Select a profiling task from the **Tasks** section. For more info about the\n tasks, see the other pages in this section. Not all profiling tasks are\n available for every process. If you don't know where to start, get an overall\n view of performance activity by\n [inspecting your app live](/studio/profile/inspect-app-live).\n\n3. Use the **Start profiler task from** drop-down to select whether to start the\n profiler task from startup or attach to the process as it's running. If you're\n trying to improve your app startup time or capture a process that happens\n during app startup, you should include startup; otherwise, you can start\n profiling at your app's current state.\n\n4. Click **Start profiler task**. The task starts in its own tab.\n\n5. Interact with your app so activities are triggered.\n\n6. Stop the recording (if applicable), wait for it to parse, and see the\n results.\n\nCompare, export, and import traces\n----------------------------------\n\nWhen you stop a profiling task, it's automatically saved in the **Past\nRecordings** tab within the **Profiler** pane. You can use these saved\nrecordings to compare resource usage in different scenarios. The recordings are\nsaved for the duration of the current Android Studio session; if you want to\nkeep them for longer, export them by clicking **Export recording**\n.\nNot all trace types can be exported.\n\nTo import a trace, for example from a previous run of Android Studio, click\n**Import recording**\n\nin the **Past Recordings** tab and select your trace file. You can also import a\nfile by dragging it into the Android Studio editor window.\n\nEdit the recording configuration\n--------------------------------\n\nTo edit your profiler task recording configuration, click the profiler settings\n.\nThere are two main settings you can toggle:\n\n- For tasks that involve sampling, the **Sample interval** represents the time between each sample. The shorter the interval you specify, the faster you reach the file size limit for the recorded data.\n- The **File size limit** represents the amount of data that can be written to the connected device. When you stop recording, Android Studio parses this data and displays it in the profiler window. If you increase the limit and record a large amount of data, Android Studio takes much longer to parse the file and might become unresponsive.\n\n| **Note:** If you use a connected device running Android 8.0 (API level 26) or higher, there isn't a limit on the file size of the trace data, and the **File\n| size limit** value is ignored. However, you still need to be careful about how much data the device collects after each recording because large trace files are difficult to parse. For example, if you're recording either a sampled trace with a short sampling interval or an instrumented trace while your app calls many methods in a short time, you'll generate large trace files quickly."]]