실시간 앱 검사
컬렉션을 사용해 정리하기
내 환경설정을 기준으로 콘텐츠를 저장하고 분류하세요.
앱을 실시간으로 검사하면 기기의 CPU 사용량, 스레드 활동, 메모리 사용량을 개략적으로 파악할 수 있습니다. 앱 프로파일링을 어디서 시작해야 할지 모르겠다면 실시간 보기를 사용하여 탐색 분석을 실행한 다음 최적화할 수 있는 동작이 표시되면 특정 프로파일링 작업으로 자세히 살펴보세요.
라이브 뷰를 시작하려면 라이브 원격 분석 보기 프로파일링 작업을 선택합니다.
작업이 시작되면 다음 시각화가 실시간으로 표시됩니다.
- 상호작용: 타임라인을 따라 사용자 상호작용 및 앱 수명 주기 이벤트를 표시합니다(디버깅 가능 앱 프로세스와 API 수준 26 이상을 실행하는 기기 필요).
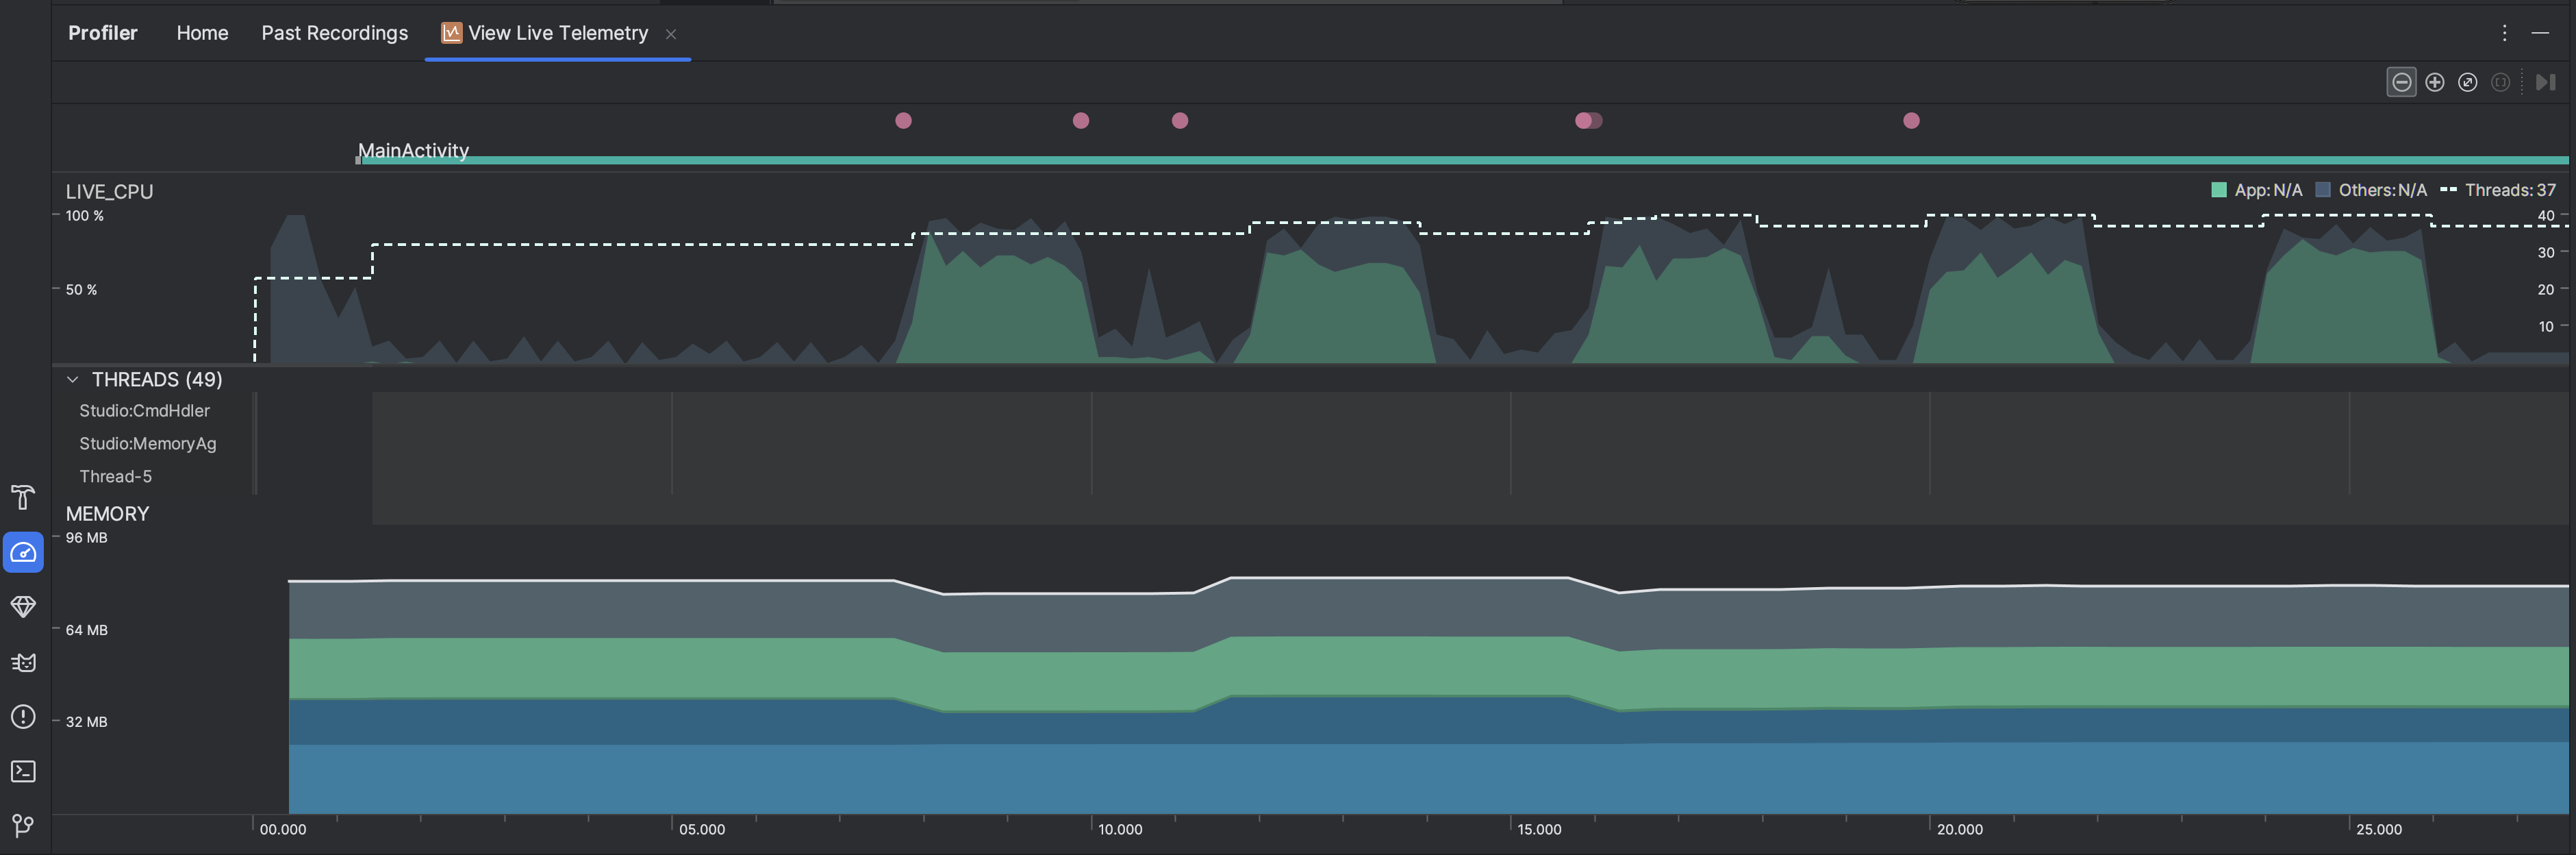
- CPU 사용량: 앱의 실시간 CPU 사용량을 이용 가능한 총 CPU 시간의 비율로 표시하고 앱에서 사용 중인 총 스레드 수를 표시합니다. 타임라인에는 기타 프로세스 (예: 시스템 프로세스 또는 다른 앱)의 CPU 사용량도 표시되므로 내 앱의 사용량과 비교할 수 있습니다. 타임라인의 가로축을 따라 마우스를 이동하여 이전의 CPU 사용량 데이터를 검사할 수 있습니다.
- 스레드: 앱 프로세스에 속하는 각 스레드를 나열하고 다음 색상을 사용하여 타임라인을 따라 각 스레드의 활동을 나타냅니다.
- 녹색: 스레드가 활성 상태이거나 CPU를 사용할 준비가 되었습니다. 즉, 실행 중이거나 실행 가능한 상태입니다.
- 노란색: 스레드가 활성 상태이지만 작업을 완료하기 위해 디스크 또는 네트워크 I/O 같은 I/O 작업을 기다리고 있습니다.
- 회색: 스레드가 일시중지 상태이며 CPU 시간을 소비하고 있지 않습니다. 이는 스레드에서 아직 사용할 수 없는 리소스에 액세스해야 할 때 종종 발생합니다. 필요한 리소스를 사용할 수 있게 될 때까지 스레드가 자발적으로 일시정지 상태로 들어가거나 커널이 스레드를 일시정지 상태로 전환합니다.
- CPU 프로파일러는
JDWP
, Profile
Saver
, Studio:VMStats
, Studio:Perfa
, Studio:Heartbeat
등 Android 스튜디오와 Android 플랫폼이 앱 프로세스에 추가하는 스레드의 CPU 사용량도 보고합니다 (스레드 활동 타임라인에 표시되는 정확한 이름은 다를 수 있음).
Android 스튜디오는 실제로 앱의 코드에 의해 스레드 활동 및 CPU 사용이 발생하는 시기를 식별할 수 있도록 이 데이터를 보고합니다.
- 메모리: 메모리 카테고리별 메모리 사용량의 누적 그래프를 표시합니다. 메모리 사용량은 왼쪽의 y축과 상단의 색상 키로 표시됩니다.

이 페이지에 나와 있는 콘텐츠와 코드 샘플에는 콘텐츠 라이선스에서 설명하는 라이선스가 적용됩니다. 자바 및 OpenJDK는 Oracle 및 Oracle 계열사의 상표 또는 등록 상표입니다.
최종 업데이트: 2025-07-27(UTC)
[[["이해하기 쉬움","easyToUnderstand","thumb-up"],["문제가 해결됨","solvedMyProblem","thumb-up"],["기타","otherUp","thumb-up"]],[["필요한 정보가 없음","missingTheInformationINeed","thumb-down"],["너무 복잡함/단계 수가 너무 많음","tooComplicatedTooManySteps","thumb-down"],["오래됨","outOfDate","thumb-down"],["번역 문제","translationIssue","thumb-down"],["샘플/코드 문제","samplesCodeIssue","thumb-down"],["기타","otherDown","thumb-down"]],["최종 업데이트: 2025-07-27(UTC)"],[],[],null,["# Inspect your app live\n\nInspecting your app live gives you a high-level overview of the device's CPU\nusage, thread activity, and memory usage. If you don't know where to start with\nprofiling your app, use live view to conduct an exploratory analysis, and then\ndig deeper with the specific profiling tasks when you see behavior that can be\noptimized.\n\nTo start live view,\n[select the **View Live Telemetry** profiling task](/studio/profile#start-profiling).\nWhen the task starts, it starts displaying the following visualizations in real\ntime:\n\n- Interactions: Shows user interaction and app lifecycle events along a timeline (requires a [debuggable](/studio/profile#profileable-v-debuggable) app process and a device running API level 26 or higher).\n- CPU usage: Shows real-time CPU usage of your app---as a percentage of total available CPU time---and the total number of threads your app is using. The timeline also shows the CPU usage of other processes (such as system processes or other apps), so you can compare it to your app's usage. You can inspect historical CPU usage data by moving your mouse along the horizontal axis of the timeline.\n- Threads: Lists each thread that belongs to your app process and indicates its activity along a timeline using the following colors:\n - Green: The thread is active or is ready to use the CPU. That is, it's in a running or runnable state.\n - Yellow: The thread is active, but it's waiting on an I/O operation (for example, disk or network I/O) before it can complete its work.\n - Gray: The thread is sleeping and is not consuming any CPU time. This sometimes occurs when the thread requires access to a resource that is not yet available. Either the thread goes into voluntary sleep, or the kernel puts the thread to sleep until the required resource becomes available.\n - The CPU Profiler also reports CPU usage of threads that Android Studio and the Android platform add to your app process---such as `JDWP`, `Profile\n Saver`, `Studio:VMStats`, `Studio:Perfa`, and `Studio:Heartbeat` (although, the exact names displayed in the thread activity timeline might vary). Android Studio reports this data so that you can identify when thread activity and CPU usage are actually caused by your app's code.\n- Memory: Shows a stacked graph of how much memory is being used by each memory category, as indicated by the y-axis on the left and the color key at the top."]]