
Debugging an app often requires working with stack traces. A stack trace generates when
your app crashes because of an error or an exception. You can also print a stack trace at any
point in your app code using methods such as
Thread.dumpStack().
While your app is running in debug mode on a connected device, Android Studio prints and highlights stack traces in the Logcat view, as shown in figure 1. A stack trace shows a list of method calls that lead to the exception being thrown, together with the filenames and line numbers where the calls happened.
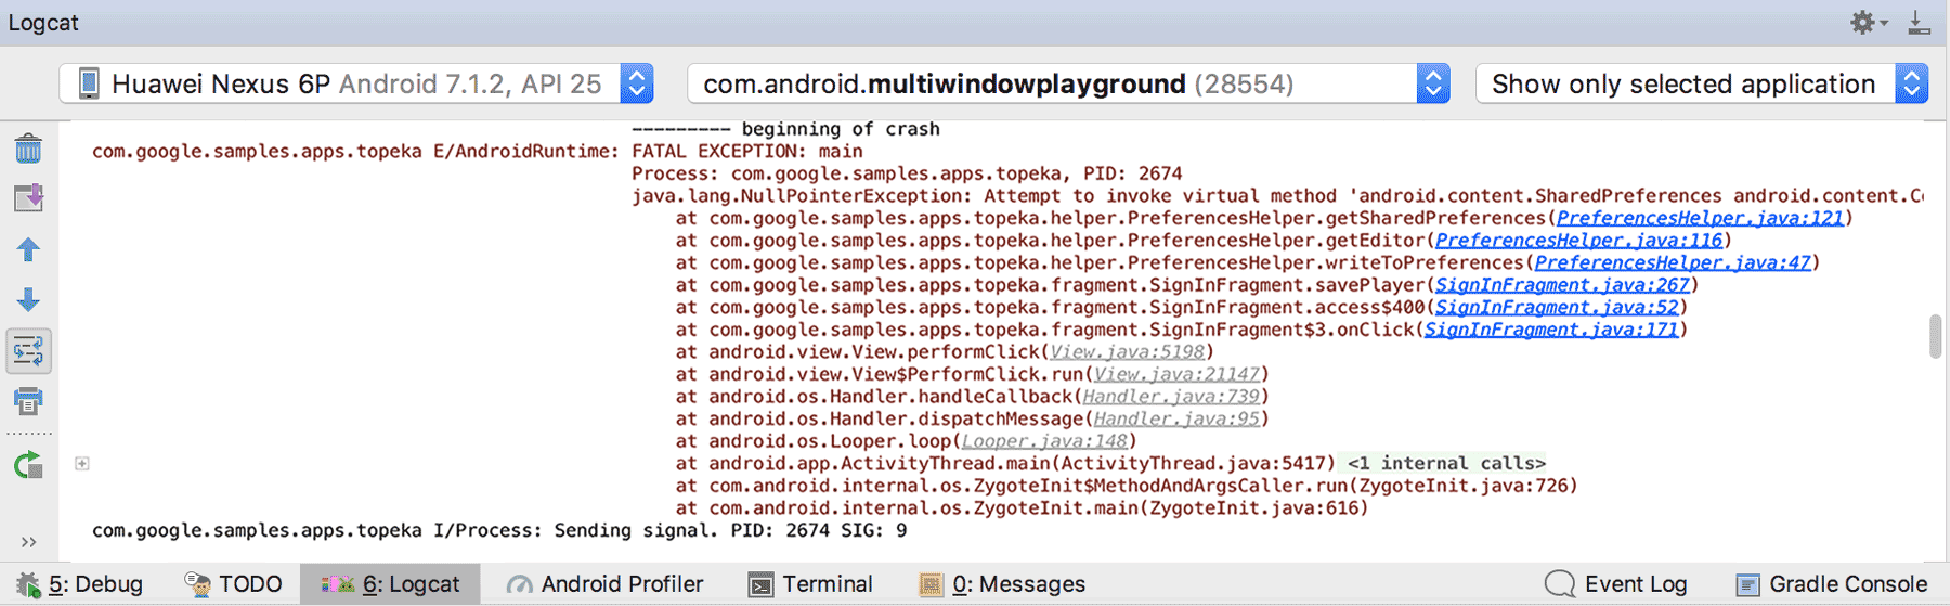
Figure 1. A stack trace in Logcat.
Click on the highlighted filenames to open the files and examine the source of the method
invocation. Click the Up the stack trace ![]() and Down the stack trace
and Down the stack trace ![]() buttons to quickly move between stack trace lines displayed
in the Logcat window.
buttons to quickly move between stack trace lines displayed
in the Logcat window.
Open stack traces from external sources
Sometimes you want to analyze stack traces shared in a bug report instead of those you found while debugging. To analyze data from Firebase Crashlytics, use the App Quality Insights tool window. To analyze data from other sources, for example stack traces generated on your users' devices from the Google Play Console, follow these steps:
-
Open your project in Android Studio.
Note: Make sure the source code you're viewing is from the same version of your app that generated the stack trace. If the code is different, you will get mismatches between the filenames and line numbers or the order of calls in the stack trace and your project.
-
From the Analyze menu, click Analyze Stacktrace.
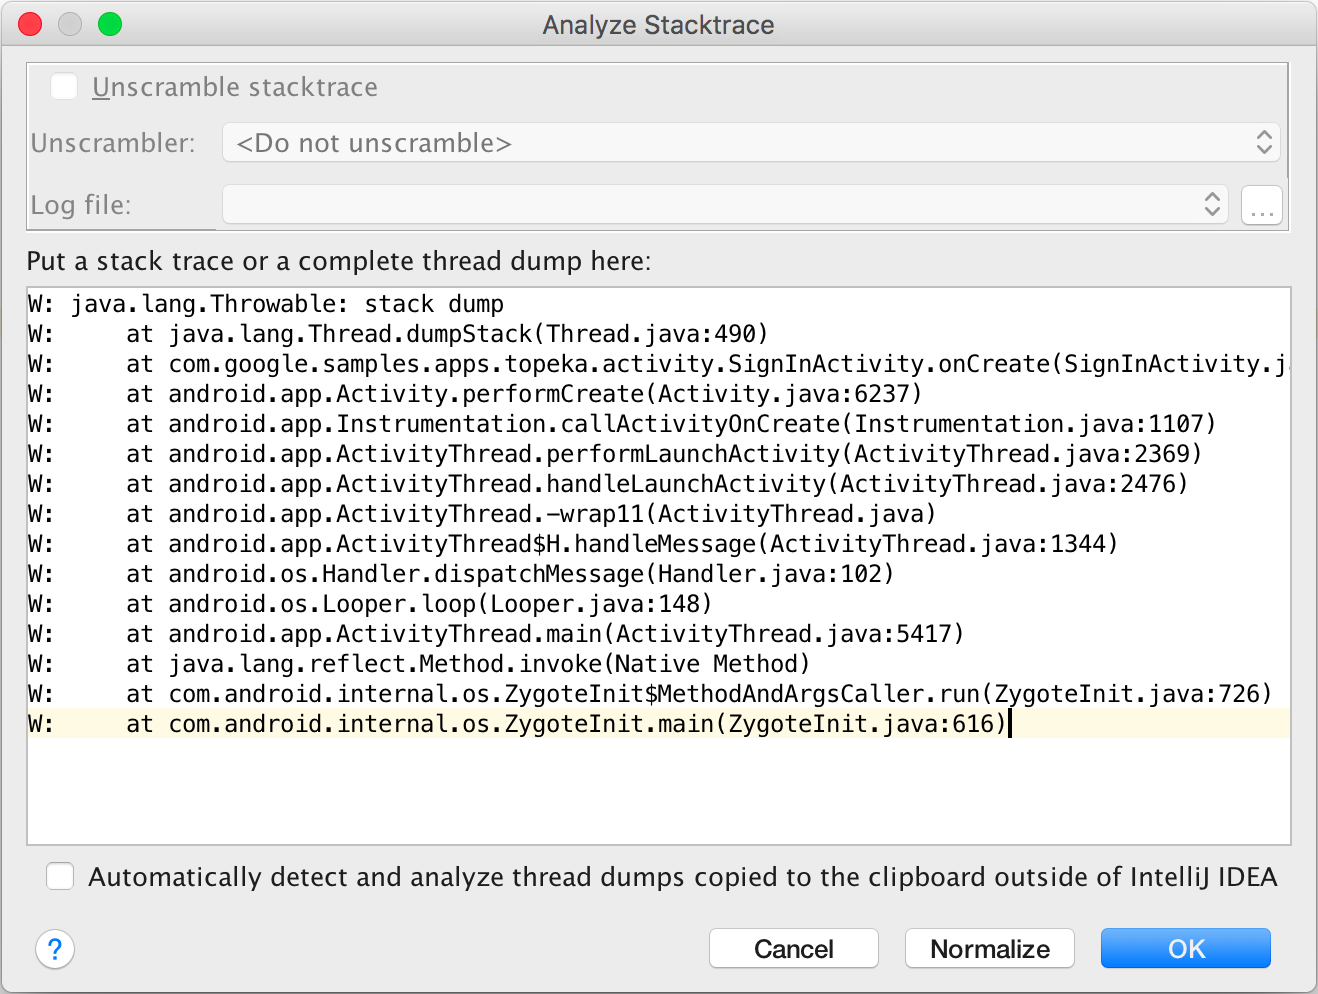
Figure 2. Analyze Stacktrace window.
- Paste the stack trace text into the Analyze Stacktrace window and click OK.
Android Studio opens a new <Stacktrace> tab, shown in figure 3, with the stack trace you pasted under the Run window.
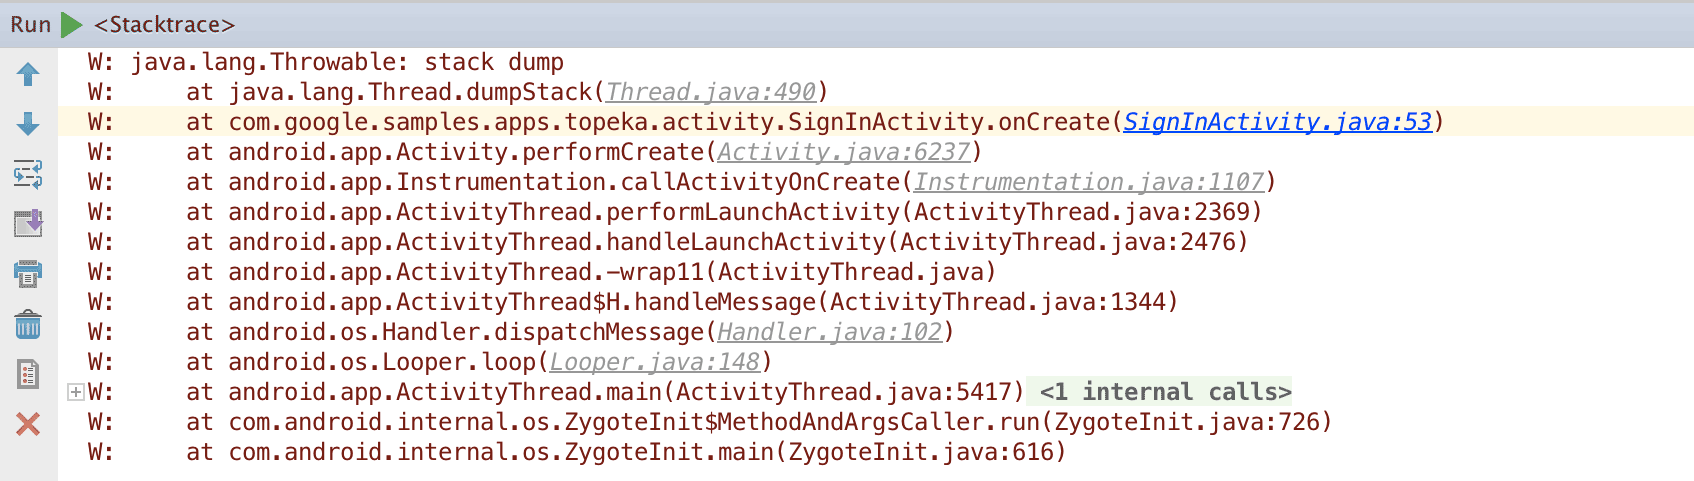
Figure 3. <Stacktrace> tab in Android Studio.
Monitor the clipboard for new stack traces
To improve your productivity if you frequently work with external stack traces, you can let Android Studio continuously monitor the system clipboard for new stack traces. To do so, follow these steps:
- Open the Analyze Stacktrace tool.
- Select the Automatically detect and analyze thread dumps copied to the clipboard outside of IntelliJ IDEA checkbox.
- Copy a stack trace in another application, such as a web browser, to the system clipboard.
When you return to the Android Studio window, the stack trace opens automatically under the Run window, so you don't have to paste it into the Analyze Stacktrace window.