
Traces are often the best source of information when first looking into a performance issue. They allow you to form a hypothesis of what the issue is and where to start looking.
There are two levels of tracing supported on Android: system tracing and method tracing.
Because system tracing only tracks areas specifically marked for tracing, it has low overhead and doesn't affect the performance of your app greatly. System tracing is great for seeing how long particular sections of your code are taking to run.
Method tracing tracks every function call in your app. This is very expensive and so it greatly affects the performance of your app, but it gives you a total picture of what is happening, what functions are being called, and how often they are being called.
By default, system traces do not include individual composable functions. They are available in method traces.
Composition tracing shows composable functions inside system traces. The feature gives you the low intrusiveness from system tracing, with method tracing levels of detail in composition.
Composition tracing setup
To try out the recomposition tracing in your project, you need to update to at least the following versions:
- Android Studio Flamingo
- Compose UI: 1.3.0
- Compose Compiler: 1.3.0
The device or emulator you run your trace on must also be at minimum API level 30.
Additionally, you need to add a new dependency on Compose Runtime Tracing:
implementation("androidx.compose.runtime:runtime-tracing:1.10.2")
If you are using the Compose BOM, you don't have to specify the version:
val composeBom = platform("androidx.compose:compose-bom:2026.01.01")
implementation(composeBom)
// ...

// dependency without a version
implementation("androidx.compose.runtime:runtime-tracing")
With this dependency, when you take a system trace that includes recomposition, you can see the composable functions automatically.
Take a system trace
To take a system trace and see the new recomposition tracing in action, follow these steps:
Open the profiler:
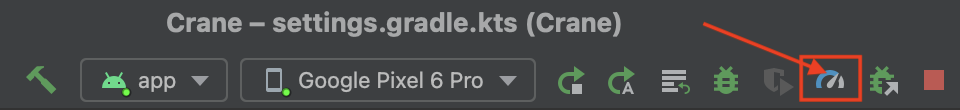
Figure 2. Android Studio - Start Profiling Click CPU timeline
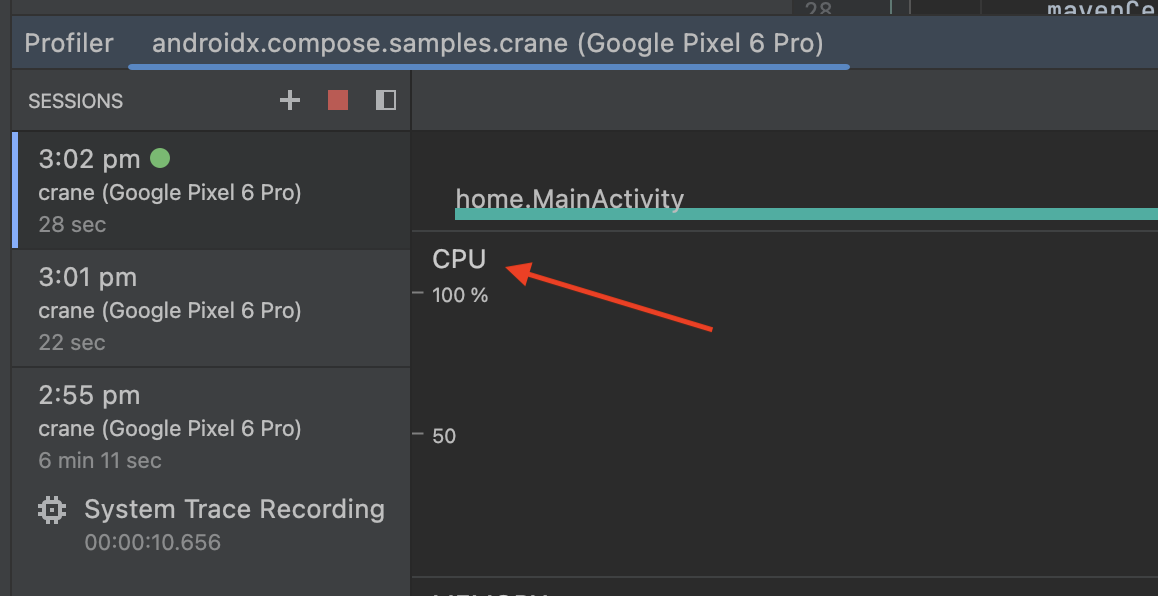
Figure 3. Android Studio Profiler - CPU timeline Navigate your app to the UI you want to trace and then select System Trace and Record
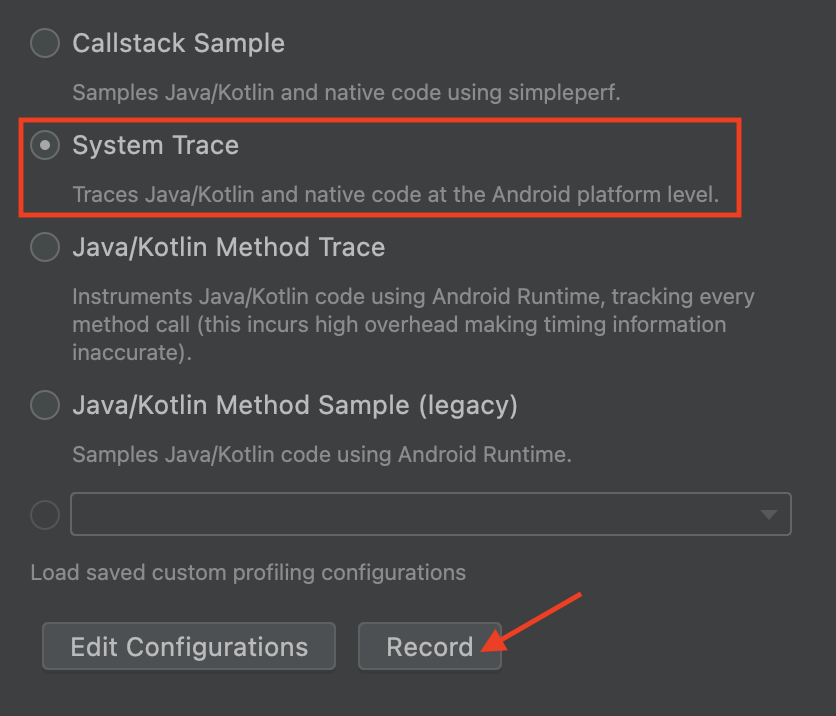
Figure 4. Trace options - System trace Use your app to cause recomposition and stop recording. Once the trace has been processed and appears, you should now be able to see the composables in the recomposition trace. You can use the keyboard and mouse to zoom and pan around the trace; if you are unfamiliar with navigating a trace, see the Record traces documentation.
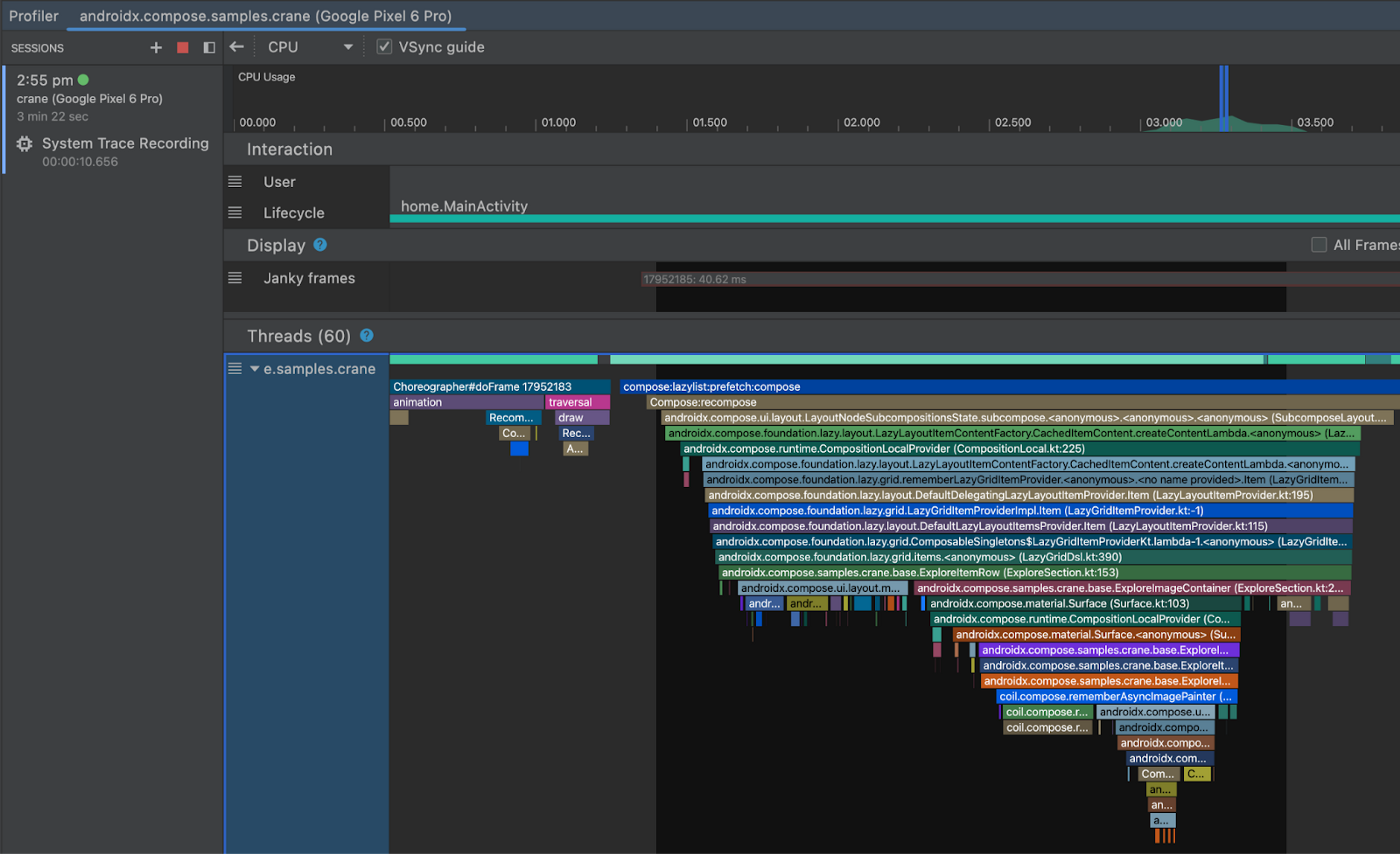
Figure 5. System trace Double-clicking on a composable in the chart takes you to its source code.
You can also see composables in the Flame Chart along with the file and line number:
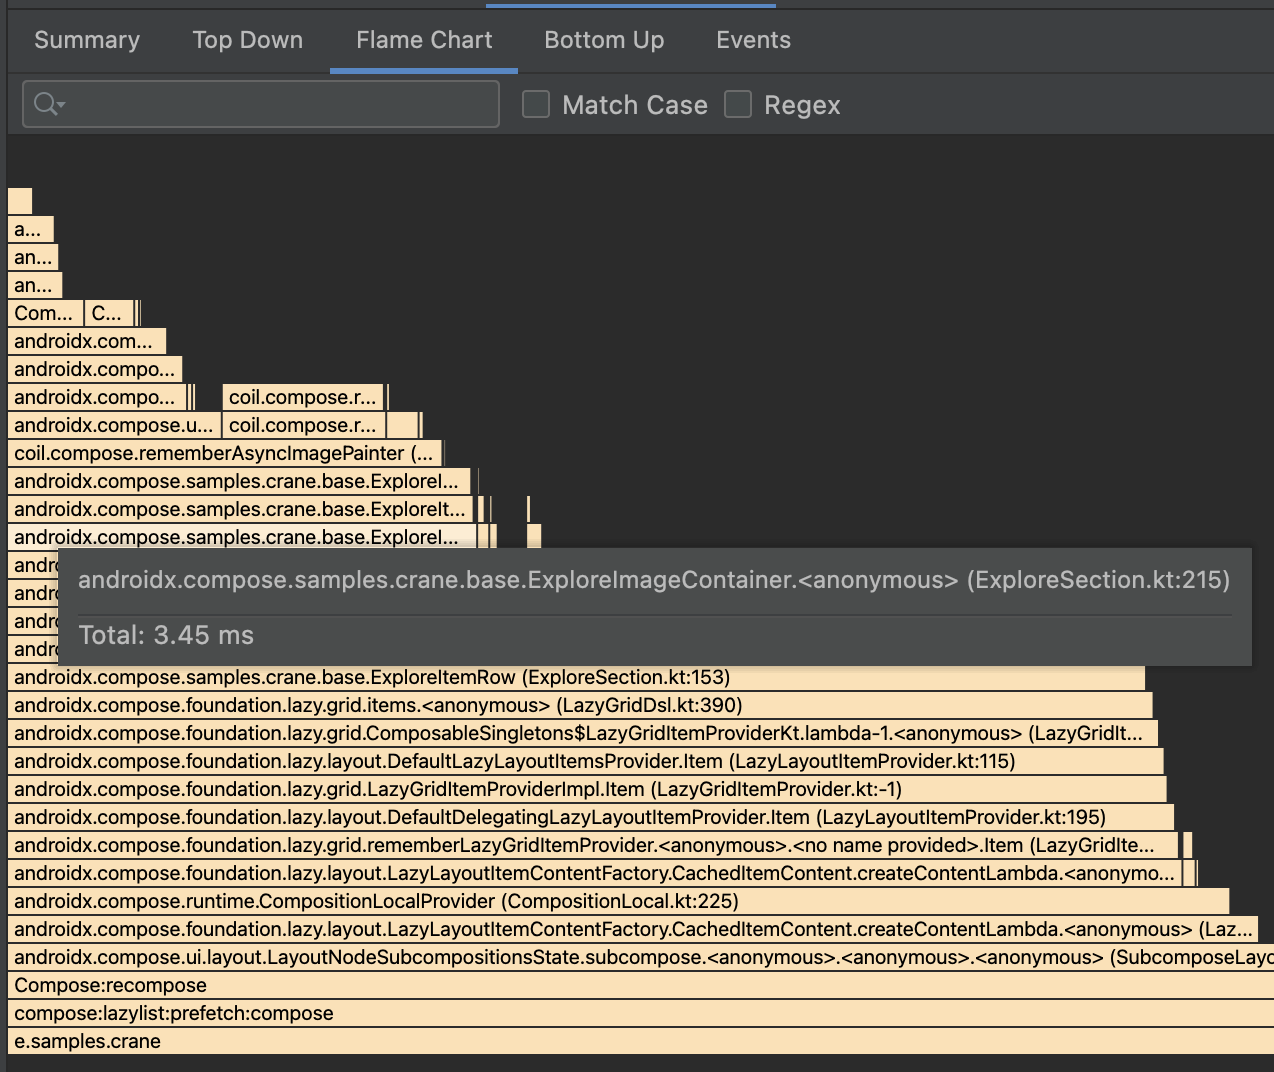
Figure 6. Flame chart
Caveats
APK size overhead
While we aimed to minimize the overhead of the feature as much as possible, there is an APK size increase for Compose apps coming from tracing strings embedded in the APK by the Compose compiler. This size increase can be relatively small if your app isn't using much Compose or larger for full Compose apps. These tracing strings are additionally unobfuscated so they can appear in tracing tools, as shown earlier. The Compose compiler injects them into all apps, starting with version 1.3.0.
The tracing strings can be removed in your production build by adding the following Proguard rule:
-assumenosideeffects public class androidx.compose.runtime.ComposerKt {

   boolean isTraceInProgress();

   void traceEventStart(int,int,int,java.lang.String);

   void traceEventStart(int,java.lang.String);

   void traceEventEnd();

}
These functions may change in the future, but any changes will be mentioned in the Compose release notes.
Note that keeping the functions in, while incurring some APK size cost, ensures that the APK being profiled is the same one that the app users run.
Accurate timing
For accurate profiling, like with any performance testing, you need to make the
app profileable and non-debuggable as per Profileable applications.
Capture a trace from terminal
It is possible to capture a composition trace from terminal. To do so, you have to perform the steps that Android Studio normally does for you automatically.
Add dependencies
First, add the additional dependencies to your app.
implementation("androidx.tracing:tracing-perfetto:1.0.0")
implementation("androidx.tracing:tracing-perfetto-binary:1.0.0")
Generate a record command
- Generate a record command using in Perfetto.
Manually add the
track_eventdata source section as per following example:adb shell perfetto \ -c - --txt \ -o /data/misc/perfetto-traces/trace \ <<EOF buffers: { size_kb: 63488 fill_policy: RING_BUFFER } buffers: { size_kb: 2048 fill_policy: RING_BUFFER } data_sources: { config { name: "track_event" } } duration_ms: 10000 flush_period_ms: 30000 incremental_state_config { clear_period_ms: 5000 } EOF
Capture a trace
- Launch the app and prepare the section you want to trace.
Enable tracing in the app by issuing a broadcast.
# set app package variable, e.g. com.google.samples.apps.nowinandroid.debug
# can be found through `adb shell ps -ef` or `adb shell cmd package list packages`
package=<your app process>

# issue a broadcast to enable tracing
adb shell am broadcast \
-a androidx.tracing.perfetto.action.ENABLE_TRACING \
$package/androidx.tracing.perfetto.TracingReceiver
Start your recording command you created previously.
Open the trace
adb pull <location>the trace from the device (location specified in the record command).Open in Perfetto.
Capture a trace with Jetpack Macrobenchmark
You can measure performance with Jetpack Macrobenchmark, which provides traces as results. To enable composition tracing with macrobenchmarks, you need to:
Add these additional dependencies to the Macrobenchmark test module:
implementation("androidx.tracing:tracing-perfetto:1.0.0")
implementation("androidx.tracing:tracing-perfetto-binary:1.0.0")
Add
androidx.benchmark.fullTracing.enable=trueinstrumentation argument before running benchmarks. Check Macrobenchmark instrumentation arguments for more information about Macrobenchmark instrumentation arguments.
Feedback
We would love to hear your feedback on this feature, any bugs you find with it, and any requests you have. You can send us feedback using the issue tracker.