Mantieni tutto organizzato con le raccolte
Salva e classifica i contenuti in base alle tue preferenze.
Gli stack di chiamate sono utili per identificare gli hotspot della CPU, ovvero le sezioni di codice che richiedono molto tempo per essere eseguite. Gli stack di chiamate ti aiutano a capire quale parte del
codice è stata eseguita e perché è stata richiamata.
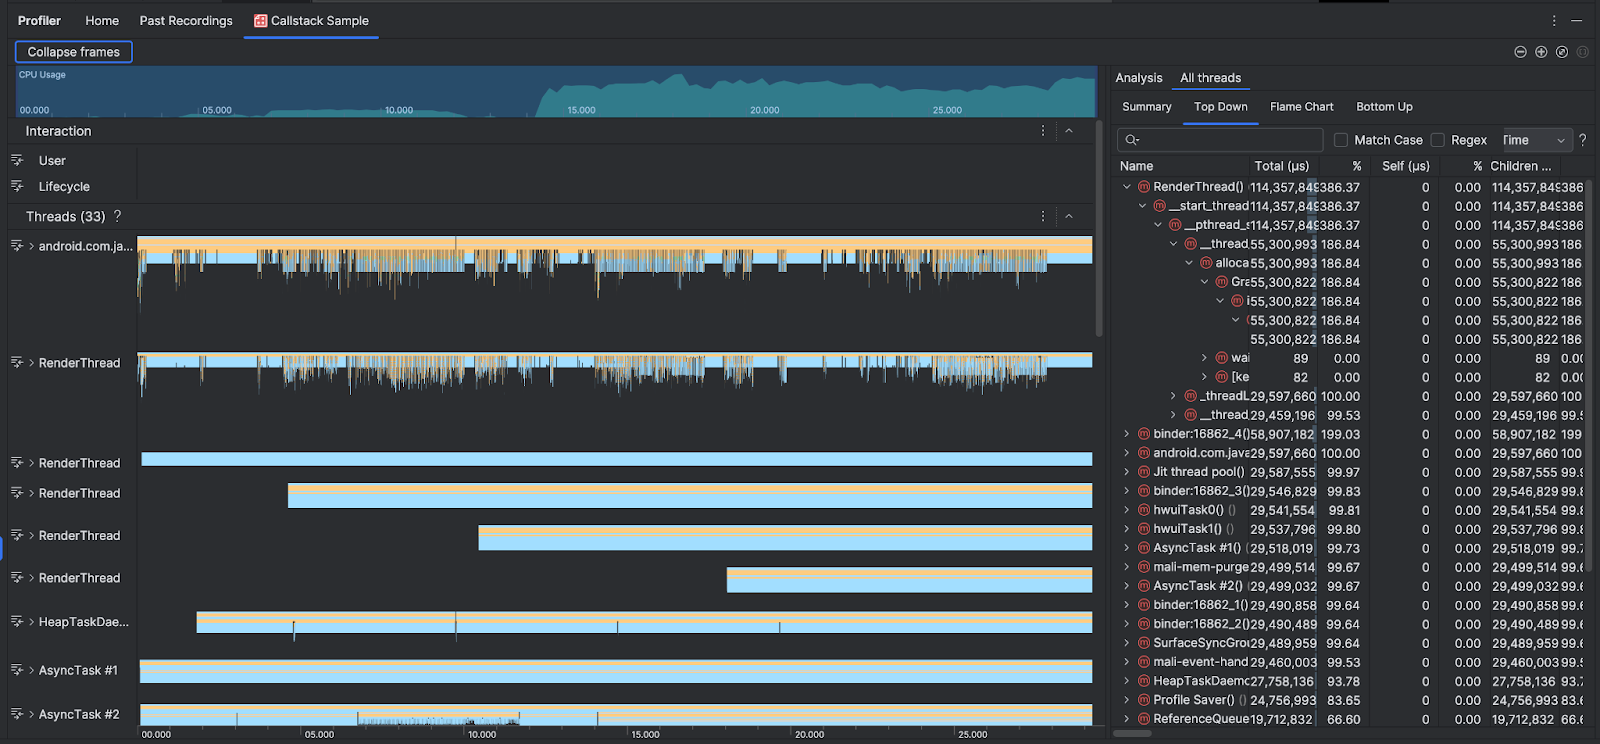
Per integrare le sequenze temporali
Utilizzo CPU e Interazioni,
la sezione Thread mostra i frame per ogni chiamata effettuata dall'app e dal sistema. Ecco alcuni suggerimenti per navigare nel campione dello stack di chiamate:
Espandi il thread di interesse e utilizza le
scorciatoie da tastiera
per navigare tra i frame dello stack. Fai clic su un frame dello stack per visualizzare i dettagli
dell'evento e delle chiamate correlate nel riquadro Analisi.
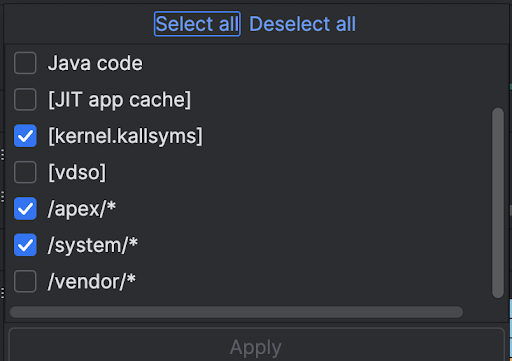
Per filtrare in base a determinati tipi di frame dello stack, fai clic su Comprimi frame e
seleziona i tipi di frame che vuoi nascondere. Se comprimi i frame, questi vengono rimossi
sia dalle sezioni Thread che Analisi. A seconda dell'indagine, potresti voler comprimere i frame della macchina virtuale Java (ad esempio android::AndroidRuntime::start e art::{...}) e del kernel di sistema (ad esempio [kernel.kallsyms]+{offset}). Di solito, ciò corrisponde alla compressione dei frame correlati a [kernel.kallsyms], /apex/ e /system/*.
Poiché un programma Java/Kotlin viene in genere eseguito tramite una macchina virtuale Java, quando Android Studio raccoglie lo stack di chiamate per un programma Java/Kotlin, lo stack di chiamate in genere include non solo il codice Java/Kotlin, ma anche il codice nativo necessario per eseguire il programma stesso e per consentire al programma di comunicare con il sistema e l'hardware.
Per passare al codice sorgente associato a un frame dello stack, fai clic con il tasto destro del mouse sul frame e poi fai clic su Vai all'origine.
Per evidenziare il frame dello stack associato a un evento nella tabella degli eventi,
fai clic sull'evento.
Esempio di codice nativo che utilizza la riga di comando
Internamente, Android Studio utilizza simpleperf per tracciare
il codice nativo della tua app. Se vuoi specificare opzioni aggiuntive per
Simpleperf, ad esempio campionare CPU di dispositivi specifici o specificare durate di campionamento
con un'elevata precisione, puoi
utilizzare simpleperf dalla riga di comando.
I campioni di contenuti e codice in questa pagina sono soggetti alle licenze descritte nella Licenza per i contenuti. Java e OpenJDK sono marchi o marchi registrati di Oracle e/o delle sue società consociate.
Ultimo aggiornamento 2025-07-27 UTC.
[[["Facile da capire","easyToUnderstand","thumb-up"],["Il problema è stato risolto","solvedMyProblem","thumb-up"],["Altra","otherUp","thumb-up"]],[["Mancano le informazioni di cui ho bisogno","missingTheInformationINeed","thumb-down"],["Troppo complicato/troppi passaggi","tooComplicatedTooManySteps","thumb-down"],["Obsoleti","outOfDate","thumb-down"],["Problema di traduzione","translationIssue","thumb-down"],["Problema relativo a esempi/codice","samplesCodeIssue","thumb-down"],["Altra","otherDown","thumb-down"]],["Ultimo aggiornamento 2025-07-27 UTC."],[],[],null,["# Sample the callstack\n\nCallstacks are useful for identifying *CPU hot spots*, or sections of code that\ntake a long time to execute. Callstacks help you understand which part of the\ncode has been executed, and why it was invoked.\n| **Note:** To sample the callstack, you must deploy your app to a device running Android 8.0 (API level 26) or higher.\n\nCallstack sample overview\n-------------------------\n\nTo sample the callstack,\n[select the **Find CPU Hotspots (Callstack Sample)** task](/studio/profile#start-profiling)\nfrom the Android Studio Profiler **Home** tab. After the recording is parsed you\nsee the following visuals:\n\nTo supplement the\n[**CPU Usage** and **Interactions** timelines](/studio/profile/cpu-profiler),\nthe **Threads** section shows frames for every call that your app and the system\nmakes. Here are some tips for navigating the callstack sample:\n\n- Expand the thread of interest and use [keyboard shortcuts](/studio/profile/cpu-profiler#ui-shortcuts) to navigate the stack frames. Click a stack frame to get details about the event and related calls in the **Analysis** pane.\n- To filter to certain types of stack frames, click **Collapse frames** and check the frame types you want to hide. Collapsing frames removes them from both the **Threads** and **Analysis** sections. Depending on your investigation, you might want to collapse frames from the Java virtual machine (for example `android::AndroidRuntime::start` and `art::{...}`), and the system kernel (for example `[kernel.kallsyms]+{offset}`). Usually this corresponds to collapsing frames related to `[kernel.kallsyms]`, `/apex/`, and `/system/*`.\n\nBecause a Java/Kotlin program typically executes through a Java virtual machine,\nwhen Android Studio collects the callstack for a Java/Kotlin program, the\ncallstack usually includes not just the Java/Kotlin code but also the native\ncode required to run the program itself and for the program to talk with the\nsystem and hardware.\n\n- To jump to the source code associated with a stack frame, right-click the frame and click **Jump to source**.\n- To highlight the stack frame associated with an event in the event table, click the event.\n\nFor information about the other visuals, see\n[Record a system trace](/studio/profile/cpu-profiler) and the\n[chart glossary](/studio/profile/chart-glossary/flame-chart).\n\nSample native code using the command line\n-----------------------------------------\n\nInternally, Android Studio uses [simpleperf](/ndk/guides/simpleperf) to trace\nyour app's native code. If you want to specify additional options for\nSimpleperf, such as sampling specific device CPUs or specifying sampling\ndurations at a high accuracy, you can\n[use simpleperf from the command line](https://android.googlesource.com/platform/system/extras/+/master/simpleperf/doc/README.md)."]]