تسجيل عمليات التخصيص المدمجة مع المحتوى
تنظيم صفحاتك في مجموعات
يمكنك حفظ المحتوى وتصنيفه حسب إعداداتك المفضّلة.
إذا كنت تكتب رمزًا أصليًا وتشعر بالقلق بشأن استخدام الذاكرة، من المفيد معرفة ملف الأداء الخاص بعمليات تخصيص الذاكرة الأصلية في تطبيقك لمعرفة ما إذا كانت هناك فرصة لتحسينها.
أسباب تحليل ذاكرة تطبيقك
يقدّم Android بيئة معالجة ذكية للذاكرة. عندما يتأكّد Android من أنّه
لم يعُد تطبيقك يستخدم بعض العناصر، يُطلق أداة جمع المهملات
الذاكرة غير المستخدَمة مرة أخرى إلى الحِزمة. يتم باستمرار تحسين الطريقة التي يتبعها Android للعثور على الذاكرة غير المستخدَمة، ولكن في مرحلة ما على جميع إصدارات Android، يجب أن يوقف النظام الرمز البرمجي مؤقتًا. في معظم الأحيان، لا يمكن ملاحظة الفواصل الزمنية.
ومع ذلك، إذا كان تطبيقك يخصّص الذاكرة بشكل أسرع من قدرة النظام على جمعها،
قد يتأخّر تطبيقك بينما يُفرِّغ المجمّع ذاكرة كافية لتلبية
عمليات التخصيص. وقد يؤدي التأخير إلى تخطّي تطبيقك للّقطات وتسبب
بطءً ملحوظًا.
للحصول على معلومات عن ممارسات البرمجة التي يمكن أن تقلِّل من استخدام ذاكرة تطبيقك، يمكنك الاطّلاع على مقالة إدارة ذاكرة تطبيقك.
نظرة عامة على عمليات تخصيص المساحات الإعلانية المدمجة مع المحتوى
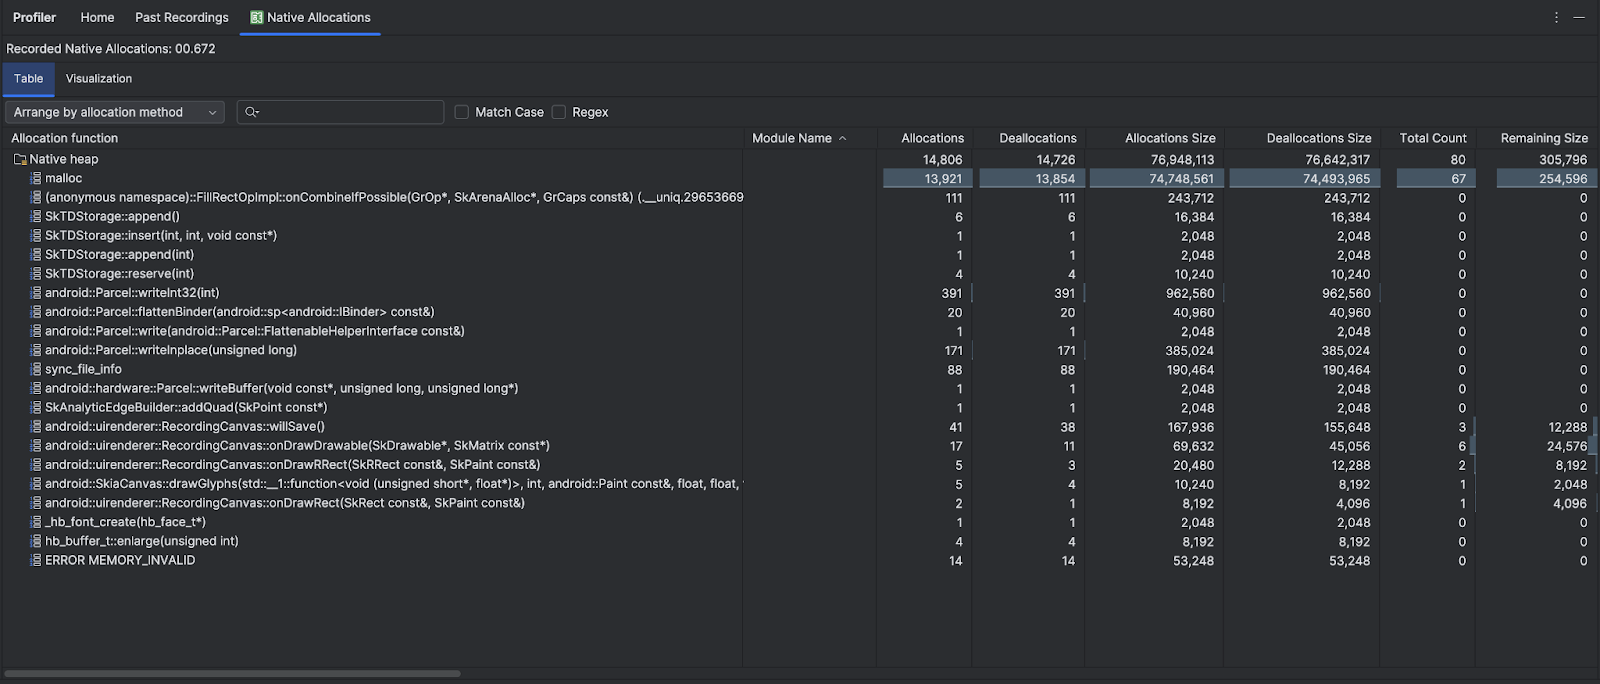
عند تنفيذ مهمة تتبُّع استهلاك الذاكرة (عمليات تخصيص الذاكرة البرمجية الأصلية)،
يتتبّع أداة تحليل الأداء في Android Studio عمليات تخصيص الذاكرة وعمليات إلغاء تخصيصها للكائنات في
الرمز البرمجي الأصلي خلال الفترة الزمنية التي تحدّدها، كما تقدّم الجدول التالي
المعلومات التالية:
- عمليات التوزيع: عدد العناصر التي تم توزيعها باستخدام
malloc()
أو عامل التشغيل new
خلال الفترة الزمنية المحدّدة.
- Deallocations: عدد العناصر التي تم إلغاء تخصيصها باستخدام
free()
أو عامل التشغيل
delete
خلال الفترة الزمنية المحدّدة.
- حجم عمليات التوزيع: الحجم المجمّع بالكيلوبايت لجميع عمليات التوزيع خلال
الفترة الزمنية المحدّدة
- حجم Deallocations: الحجم المجمّع بالبايت لجميع الذاكرة التي تمّت تحريرها
خلال الفترة الزمنية المحدّدة
- إجمالي العدد: القيمة في عمود عمليات التوزيع مطروحًا منها القيمة في عمود
عمليات تخصيص الصفقات.
- الحجم المتبقّي: القيمة في عمود حجم التخصيصات مطروحًا منها
القيمة في عمود حجم عمليات التخصيص للصفقات.

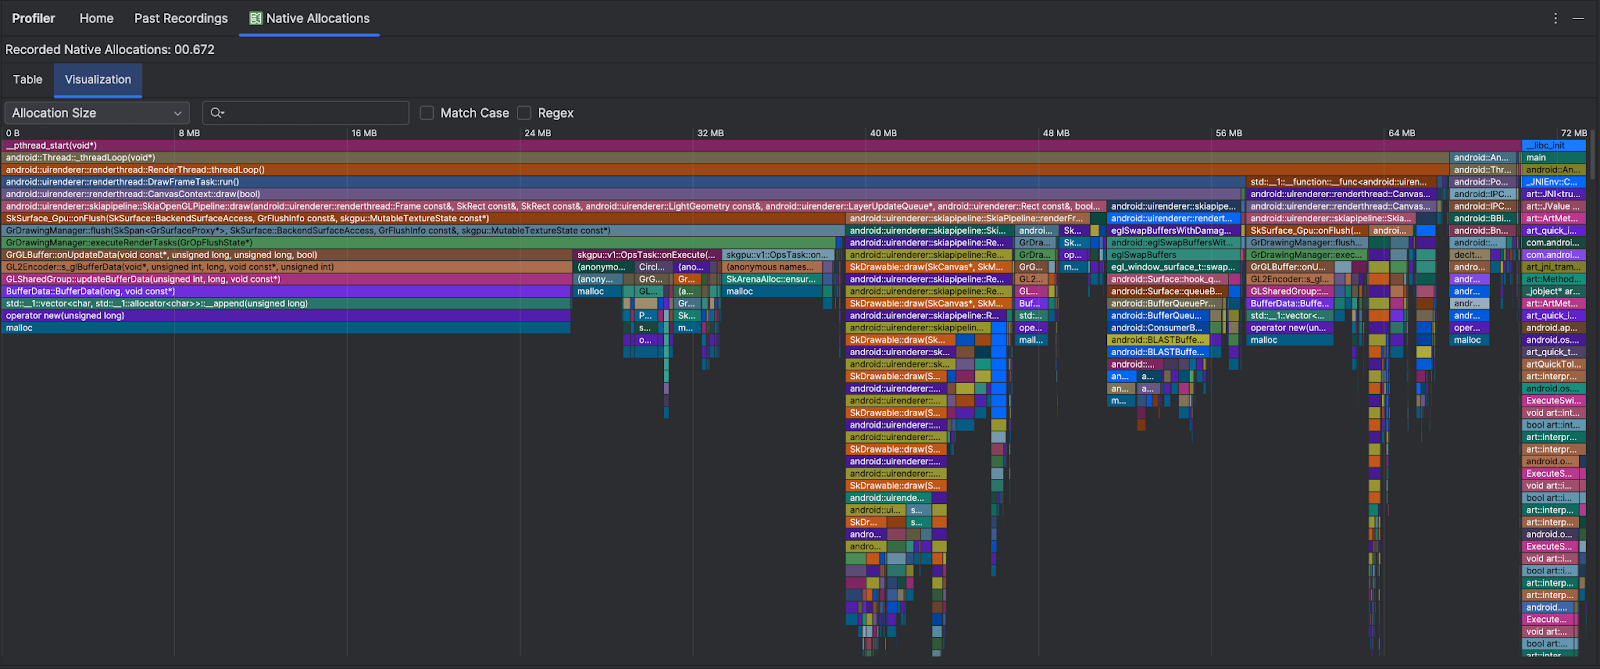
تعرِض علامة التبويب العرض المرئي عرضًا مجمّعًا لجميع العناصر ذات الصلة بالرمز البرمجي الأصلي في تسلسل استدعاء الدوالّ خلال النطاق الزمني المحدّد. ويعرِض لك بشكل أساسي
إجمالي مقدار الذاكرة التي يستهلكها تسلسل استدعاء الدوال البرمجية مع النُسخ المعروضة.
يعرض الصف الأول اسم سلسلة المحادثات. يتمّ تجميع العناصر تلقائيًا من اليمين
إلى اليسار استنادًا إلى حجم التخصيص، ويمكنك استخدام القائمة المنسدلة لتغيير الترتيب.

يستخدم أداة تحليل الأداء تلقائيًا حجم عيّنة يبلغ 2048 بايت: في كل مرة يتم فيها تخصيص 2048 بايت
من الذاكرة، يتم أخذ لقطة ذاكرة. يؤدي استخدام عيّنة أصغر حجمًا
إلى إنشاء لقطات أكثر تكرارًا، ما يؤدي إلى الحصول على بيانات أكثر دقة عن استخدام
الذاكرة. يؤدي استخدام عيّنة أكبر إلى الحصول على بيانات أقل دقة، ولكنّها تستهلك موارد نظام أقل وتُحسِّن الأداء أثناء التسجيل. لتغيير حجم
العيّنة، يُرجى الاطّلاع على تعديل إعدادات التسجيل.
يخضع كل من المحتوى وعيّنات التعليمات البرمجية في هذه الصفحة للتراخيص الموضحّة في ترخيص استخدام المحتوى. إنّ Java وOpenJDK هما علامتان تجاريتان مسجَّلتان لشركة Oracle و/أو الشركات التابعة لها.
تاريخ التعديل الأخير: 2025-07-27 (حسب التوقيت العالمي المتفَّق عليه)
[[["يسهُل فهم المحتوى.","easyToUnderstand","thumb-up"],["ساعَدني المحتوى في حلّ مشكلتي.","solvedMyProblem","thumb-up"],["غير ذلك","otherUp","thumb-up"]],[["لا يحتوي على المعلومات التي أحتاج إليها.","missingTheInformationINeed","thumb-down"],["الخطوات معقدة للغاية / كثيرة جدًا.","tooComplicatedTooManySteps","thumb-down"],["المحتوى قديم.","outOfDate","thumb-down"],["ثمة مشكلة في الترجمة.","translationIssue","thumb-down"],["مشكلة في العيّنات / التعليمات البرمجية","samplesCodeIssue","thumb-down"],["غير ذلك","otherDown","thumb-down"]],["تاريخ التعديل الأخير: 2025-07-27 (حسب التوقيت العالمي المتفَّق عليه)"],[],[],null,["# Record native allocations\n\nIf you're writing native code and concerned about its memory usage, it's helpful\nto profile your app's native allocations to discover if there's opportunity to\noptimize.\n\nWhy you should profile your app memory\n--------------------------------------\n\nAndroid provides a [managed memory\nenvironment](/topic/performance/memory-overview)---when Android determines that\nyour app is no longer using some objects, the garbage collector releases the\nunused memory back to the heap. How Android goes about finding unused memory is\nconstantly being improved, but at some point on all Android versions, the system\nmust briefly pause your code. Most of the time, the pauses are imperceivable.\nHowever, if your app allocates memory faster than the system can collect it,\nyour app might be delayed while the collector frees enough memory to satisfy\nyour allocations. The delay could cause your app to skip frames and cause\nvisible slowness.\n\nFor information about programming practices that can reduce your app's memory\nuse, read [Manage your app's memory](/topic/performance/memory).\n\nNative allocations overview\n---------------------------\n\nWhen you run the [**Track Memory Consumption (Native Allocations)**](/studio/profile#start-profiling) task,\nthe Android Studio Profiler tracks allocations and deallocations of objects in\nnative code for the time period that you specify and provides the following\ninformation:\n\n- **Allocations** : A count of objects allocated using `malloc()` or the `new` operator during the selected time period.\n- **Deallocations** : A count of objects deallocated using `free()` or the `delete` operator during the selected time period.\n- **Allocations Size**: The aggregated size in bytes of all allocations during the selected time period.\n- **Deallocations Size**: The aggregated size in bytes of all freed memory during the selected time period.\n- **Total Count** : The value in the **Allocations** column minus the value in the **Deallocations** column.\n- **Remaining Size** : The value in the **Allocations Size** column minus the value in the **Deallocations Size** column.\n\nThe **Visualization** tab shows an aggregated view of all the objects related to\nnative code in the call stack during the time range selected. It essentially\nshows you how much total memory the callstack with the instances shown takes.\nThe first row shows the thread name. By default, the objects are stacked left to\nright based on allocation size; use the drop-down to change the ordering.\n\nBy default, the profiler uses a sample size of 2048 bytes: Every time 2048 bytes\nof memory are allocated, a snapshot of memory is taken. A smaller sample size\nresults in more frequent snapshots, yielding more accurate data about memory\nusage. A larger sample size yields less accurate data, but it consumes fewer\nsystem resources and improves performance while recording. To change the sample\nsize, see [Edit the recording configuration](/studio/profile#edit-recording)."]]