إنشاء سجلات التتبع من خلال قياس حالة التطبيق
تنظيم صفحاتك في مجموعات
يمكنك حفظ المحتوى وتصنيفه حسب إعداداتك المفضّلة.
لإنشاء تتبع طريقة تنفيذ تطبيقك، يمكنك تجهيز تطبيقك
باستخدام فئة Debug
. إن قياس أداء التطبيق بهذه الطريقة يمنحك مزيدًا من التحكم في الوقت المناسب
يبدأ الجهاز ويتوقف عن تسجيل معلومات التتبُّع. يحفظ الجهاز أيضًا
سجلات التتبع باستخدام الأسماء التي تحددها، حتى تتمكن من التعرّف على كل سجل بسهولة
لاحقًا. يمكنك بعد ذلك عرض كل سجلّ تتبُّع باستخدام أداة أداة تحليل وحدة المعالجة المركزية (CPU) في Android Studio.
يمكنك أيضًا
بدء التتبُّع وإيقافه في محلّل وحدة المعالجة المركزية (CPU)
بدون قياس رمز التطبيق.
قبل بدء إنشاء سجلات التتبّع، تأكَّد من أنّ تطبيقك قد أضاف منطقًا لحفظ سجلات التتبّع في الدليل الخاص بالتطبيق
.
قياس أداء تطبيقك
لإنشاء سجلّات تتبُّع، اتصل بـ startMethodTracing()
حيث تريد أن يبدأ النظام في تسجيل بيانات التتبُّع.
وفي المكالمة، يمكنك تحديد اسم
.trace
، ويحفظه النظام في حزمة خاصة بالحزمة
الذي يستهدف بيانات التطبيق الدائمة على الجهاز المستهدف، وهو
نفس الدليل الذي يتم عرضه بواسطة
getExternalFilesDir()
وتتوفّر في دليل ~/sdcard/
على معظم الأجهزة
يحتوي هذا الملف على بيانات تتبُّع الطريقة الثنائية وجدول ربط يحتوي على سلسلة محادثات.
وأسماء الطرق. لإيقاف التتبّع، يُرجى الاتصال
stopMethodTracing()
يبدأ المثال التالي تسجيل سجلّ تتبُّع وإيقافه بالاسم
sample.trace
:
Kotlin
// Starts recording a trace log with the name you provide. For example, the
// following code tells the system to start recording a .trace file to the
// device with the name "sample.trace".
Debug.startMethodTracing("sample")
// The system begins buffering the generated trace data, until your
// application calls <code><a href="/reference/android/os/Debug.html#stopMethodTracing()">stopMethodTracing()</a></code>, at which time it writes
// the buffered data to the output file.
Debug.stopMethodTracing()
Java
// Starts recording a trace log with the name you provide. For example, the
// following code tells the system to start recording a .trace file to the
// device with the name "sample.trace".
Debug.startMethodTracing("sample");
...
// The system begins buffering the generated trace data, until your
// application calls <code><a href="/reference/android/os/Debug.html#stopMethodTracing()">stopMethodTracing()</a></code>, at which time it writes
// the buffered data to the output file.
Debug.stopMethodTracing();
يُرجى ملاحظة أنّه إذا استدعِ التطبيق
startMethodTracing()
مرة أخرى بدون تغيير اسم سجل التتبُّع، يستبدل السجلّ الحالي
تم حفظه على الجهاز. للتعرّف على كيفية تغيير اسم كل ملف trace
log ديناميكيًا، انتقِل إلى القسم المعنيّ بحفظ عدة سجلّات.
إذا وصل النظام إلى الحد الأقصى لحجم للمخزن المؤقت قبل الاتصال
stopMethodTracing()
،
يتوقف النظام عن التتبع ويرسل إشعارًا إلى وحدة التحكم.
تعمل الطرق التي تبدأ عمليات التتبّع وتوقِفها على مستوى عملية تطبيقك بالكامل. وهذا يعني أنّه يمكنك استدعاء startMethodTracing()
في onCreate(Bundle)
طريقة نشاطك، واستدعاء stopMethodTracing()
في onDestroy()
طريقة ذلك النشاط.
تجدر الإشارة إلى أنّ تطبيقك يعمل بشكل أبطأ عند تفعيل التحليل. أي أنك
عدم استخدام بيانات التحليل لتحديد التوقيتات المطلقة (مثل "
يستغرق تشغيل "foo()
" 2.5 ثانية"). لا تكون معلومات التوقيت في سجلّات التتبّع مفيدة إلا عند مقارنتها بسجلّات التتبّع السابقة، حتى تتمكّن من معرفة ما إذا كانت التغييرات الأخيرة تجعل تطبيقك أسرع أو أبطأ.
عند نشر التطبيقات على الأجهزة التي تعمل بالإصدار 5.0 من نظام التشغيل Android (المستوى 21 من واجهة برمجة التطبيقات) والإصدارات الأحدث، يمكنك:
استخدام التحليل المستند إلى العيّنات للحصول على ملف مع تأثير أقل في الأداء في وقت التشغيل. إلى
تمكين تحليل نموذج، استدعاء
startMethodTracingSampling()
(بدلاً من استدعاء startMethodTracing()
) باستخدام عيّنة محدّدة
الفاصل. يجمع النظام عيّنات بشكل دوري إلى أن يستدعي تطبيقك stopMethodTracing()
.
حفظ سجلات متعددة
إذا بدأ تطبيقك عملية تتبُّع إحدى الطرق وأوقفها عدة مرات بدون تحديد اسم
جديد لسجلّ التتبُّع، سيحلّ الجهاز سجلّ التتبُّع الجديد محلّ سجلّ التتبُّع القديم، أي أنّه يحتفظ بسجلّ التتبُّع الأخير فقط. لحفظ عدة
سجلات تتبُّع على جهازك، أعِد تسمية سجلّ التتبُّع ديناميكيًا في كل مرة يُطلِق فيها تطبيقك
startMethodTracing()
.
يستخدم العيّنة أدناه فئة SimpleDateFormat
لتضمين التاريخ والوقت الحاليَين عند تسمية كل سجلّ تتبُّع:
Kotlin
// Uses the <code><a href="/reference/java/text/SimpleDateFormat.html">SimpleDateFormat</a></code> class to create a String with
// the current date and time.
val dateFormat: DateFormat = SimpleDateFormat("dd_MM_yyyy_hh_mm_ss", Locale.getDefault())
val logDate: String = dateFormat.format(Date())
// Applies the date and time to the name of the trace log.
Debug.startMethodTracing("sample-$logDate")
Java
// Uses the <code><a href="/reference/java/text/SimpleDateFormat.html">SimpleDateFormat</a></code> class to create a String with
// the current date and time.
SimpleDateFormat dateFormat =
new SimpleDateFormat("dd_MM_yyyy_hh_mm_ss", Locale.getDefault());
String logDate = dateFormat.format(new Date());
// Applies the date and time to the name of the trace log.
Debug.startMethodTracing(
"sample-" + logDate);
الوصول إلى سجلات التتبُّع على الجهاز
بعد أن ينشئ النظام سجلّ التتبُّع على جهازك، يمكنك الوصول إلى الملف.
باستخدام إحدى الطرق التالية:
استخدام "مستكشف الأجهزة"
لفتح "مستكشف الأجهزة"، انقر على
عرض > نوافذ الأدوات > Device Explorer (أو انقر على
مستكشف الأجهزة
في شريط نافذة الأدوات). كما هو موضّح في الشكل 1،
يمكنك تحديد موقع ملفات .trace
من خلال الانتقال إلى دليل التطبيق
المخصّص للحزمة.
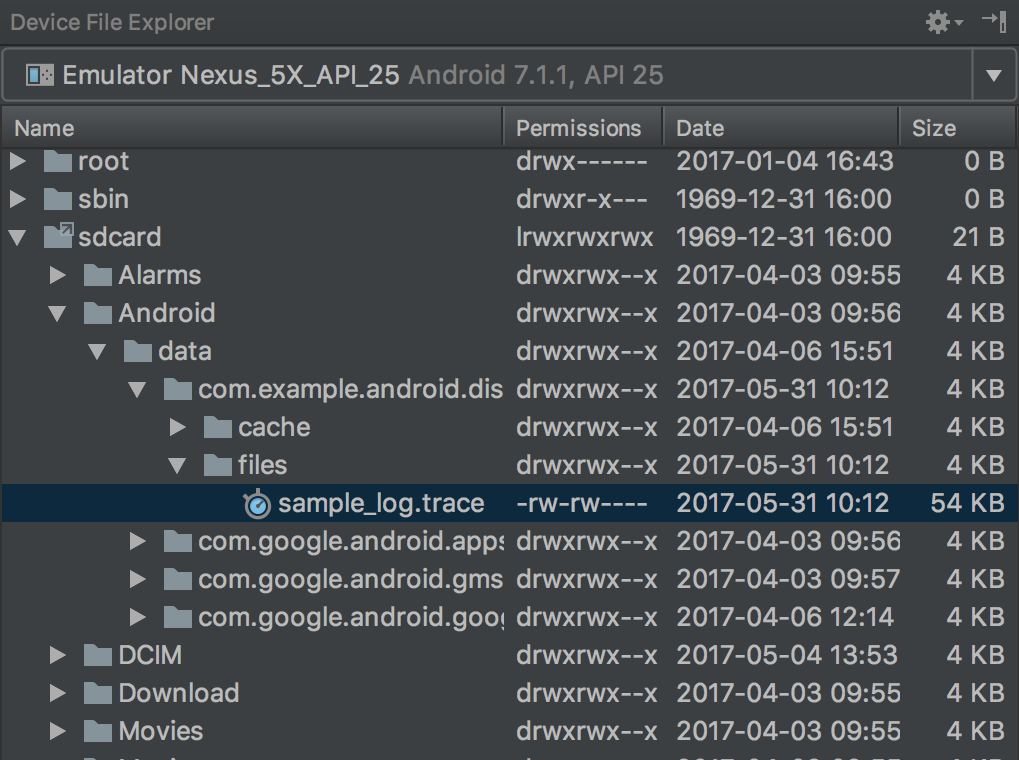
الشكل 1: تحديد موقع سجلّات التتبُّع باستخدام "مستكشف الأجهزة"
انسخ الملف إلى جهازك المحلي باستخدام الأمر adb pull
.
ينسخ الأمر أدناه سجلّ تتبُّع باسم sample.trace
من الجهاز إلى
دليل ~/Documents/trace-logs/
على جهازك المحلي.
adb pull path-on-device/sample.trace ~/Documents/trace-logs/
يمكنك بعد ذلك
استيراد ملف التتبُّع باستخدام أداة تحليل أداء وحدة المعالجة المركزية.
يخضع كل من المحتوى وعيّنات التعليمات البرمجية في هذه الصفحة للتراخيص الموضحّة في ترخيص استخدام المحتوى. إنّ Java وOpenJDK هما علامتان تجاريتان مسجَّلتان لشركة Oracle و/أو الشركات التابعة لها.
تاريخ التعديل الأخير: 2025-07-27 (حسب التوقيت العالمي المتفَّق عليه)
[[["يسهُل فهم المحتوى.","easyToUnderstand","thumb-up"],["ساعَدني المحتوى في حلّ مشكلتي.","solvedMyProblem","thumb-up"],["غير ذلك","otherUp","thumb-up"]],[["لا يحتوي على المعلومات التي أحتاج إليها.","missingTheInformationINeed","thumb-down"],["الخطوات معقدة للغاية / كثيرة جدًا.","tooComplicatedTooManySteps","thumb-down"],["المحتوى قديم.","outOfDate","thumb-down"],["ثمة مشكلة في الترجمة.","translationIssue","thumb-down"],["مشكلة في العيّنات / التعليمات البرمجية","samplesCodeIssue","thumb-down"],["غير ذلك","otherDown","thumb-down"]],["تاريخ التعديل الأخير: 2025-07-27 (حسب التوقيت العالمي المتفَّق عليه)"],[],[],null,["# Generate Trace Logs by Instrumenting Your App\n\nTo generate a method trace of your app's execution, you can instrument your app\nusing the [Debug](/reference/android/os/Debug)\nclass. Instrumenting your app this way gives you more control over exactly when\nthe device starts and stops recording tracing information. The device also saves\nyour trace logs using the names you specify, so you can easily identify each log\nlater. You can then view each trace log using the Android Studio\n[CPU Profiler](/studio/profile/cpu-profiler).\n\nYou can also\n[start and stop tracing in the CPU Profiler](/studio/profile/cpu-profiler#method_traces)\nwithout instrumenting your app's code.\n\nBefore you start generating trace logs, make sure your app has added logic to\nsave trace logs to its [app-specific\ndirectory](/training/data-storage/app-specific).\n\nInstrument your app\n-------------------\n\nTo create trace logs, call [startMethodTracing()](/reference/android/os/Debug#startMethodTracing())\nwhere you want the system to start logging tracing data.\n\nIn the call, you can specify the name for the\n`.trace` file, and the system saves it to a package-specific\ndirectory that's intended for persistent app data on the target device---this is\nthe same directory that is returned by\n[getExternalFilesDir()](/reference/android/content/Context#getExternalFilesDir(java.lang.String))\nand is located in the `~/sdcard/` directory on most devices.\nThis file contains the binary method trace data and a mapping table with thread\nand method names. To stop tracing, call\n[stopMethodTracing()](/reference/android/os/Debug#stopMethodTracing()).\n\nThe following sample starts and stops recording a trace log with the name\n`sample.trace`: \n\n### Kotlin\n\n```kotlin\n// Starts recording a trace log with the name you provide. For example, the\n// following code tells the system to start recording a .trace file to the\n// device with the name \"sample.trace\".\nDebug.startMethodTracing(\"sample\")\n\n// The system begins buffering the generated trace data, until your\n// application calls \u003ccode\u003e\u003ca href=\"/reference/android/os/Debug.html#stopMethodTracing()\"\u003estopMethodTracing()\u003c/a\u003e\u003c/code\u003e, at which time it writes\n// the buffered data to the output file.\nDebug.stopMethodTracing()\n```\n\n### Java\n\n```java\n// Starts recording a trace log with the name you provide. For example, the\n// following code tells the system to start recording a .trace file to the\n// device with the name \"sample.trace\".\nDebug.startMethodTracing(\"sample\");\n...\n// The system begins buffering the generated trace data, until your\n// application calls \u003ccode\u003e\u003ca href=\"/reference/android/os/Debug.html#stopMethodTracing()\"\u003estopMethodTracing()\u003c/a\u003e\u003c/code\u003e, at which time it writes\n// the buffered data to the output file.\nDebug.stopMethodTracing();\n```\n\nNote that if your app calls the\n[startMethodTracing()](/reference/android/os/Debug#startMethodTracing())\nagain without changing the name of the trace log, it overwrites the existing log\nsaved to the device. To learn how to dynamically change the name of each trace\nlog, go to the section about [saving multiple logs](#save_multiple_logs).\n\nIf the system reaches the maximum buffer size before you call\n[stopMethodTracing()](/reference/android/os/Debug#stopMethodTracing()),\nthe system stops tracing and sends a notification to the console.\nThe methods that start and stop traces work across your entire app process. That\nis, you could call\n[startMethodTracing()](/reference/android/os/Debug#startMethodTracing())\nin your activity's\n[onCreate(Bundle)](/reference/android/app/Activity#onCreate(android.os.Bundle))\nmethod, and call [stopMethodTracing()](/reference/android/os/Debug#stopMethodTracing())\nin that activity's [onDestroy()](/reference/android/app/Activity#onDestroy())\nmethod.\n\nNote that your app runs more slowly when profiling is enabled. That is, you\nshouldn't use the profiling data to determine absolute timings (such as, \"method\n`foo()` takes 2.5 seconds to run\"). The timing information in the trace logs are\nuseful only when comparing it to previous trace logs, so you can see if recent\nchanges make your app faster or slower.\n\nWhen deploying to devices running Android 5.0 (API level 21) and higher, you can\nuse sample-based profiling to profile with less runtime performance impact. To\nenable sample profiling, call\n[startMethodTracingSampling()](/reference/android/os/Debug#startMethodTracingSampling(java.lang.String, int, int))\n(instead of calling `startMethodTracing()`) with a specified sampling\ninterval. The system gathers samples periodically until your app calls\n[stopMethodTracing()](/reference/android/os/Debug#stopMethodTracing()).\n\n### Save multiple logs\n\nIf your app starts and stops a method trace multiple times without specifying a\nnew name for the trace log, the device overwrites the older trace log with the\nnew one---that is, it only keeps the most recent trace log. To save multiple\ntrace logs to your device, dynamically rename the trace log each time your app\ncalls [startMethodTracing()](/reference/android/os/Debug#startMethodTracing()).\nThe sample below uses the [SimpleDateFormat](/reference/java/text/SimpleDateFormat)\nclass to include the current date and time when naming each trace log: \n\n### Kotlin\n\n```kotlin\n// Uses the \u003ccode\u003e\u003ca href=\"/reference/java/text/SimpleDateFormat.html\"\u003eSimpleDateFormat\u003c/a\u003e\u003c/code\u003e class to create a String with\n// the current date and time.\nval dateFormat: DateFormat = SimpleDateFormat(\"dd_MM_yyyy_hh_mm_ss\", Locale.getDefault())\nval logDate: String = dateFormat.format(Date())\n// Applies the date and time to the name of the trace log.\nDebug.startMethodTracing(\"sample-$logDate\")\n```\n\n### Java\n\n```java\n// Uses the \u003ccode\u003e\u003ca href=\"/reference/java/text/SimpleDateFormat.html\"\u003eSimpleDateFormat\u003c/a\u003e\u003c/code\u003e class to create a String with\n// the current date and time.\nSimpleDateFormat dateFormat =\n new SimpleDateFormat(\"dd_MM_yyyy_hh_mm_ss\", Locale.getDefault());\nString logDate = dateFormat.format(new Date());\n// Applies the date and time to the name of the trace log.\nDebug.startMethodTracing(\n \"sample-\" + logDate);\n```\n\nAccess trace logs on the device\n-------------------------------\n\nAfter the system creates the trace log on your device, you can access the file\nin one of the following ways:\n\n- [Use the Device Explorer](/studio/debug/device-file-explorer).\n To open the Device Explorer, click\n **View \\\u003e Tool Windows \\\u003e Device Explorer** (or click the\n **Device Explorer**\n button in the tool window bar). As shown in figure 1\n you can locate the `.trace` files by navigating to your app's\n package-specific directory.\n\n\n **Figure 1.** Locating the trace logs using the Device Explorer.\n\n \u003cbr /\u003e\n\n- Copy the file to your local machine using the `adb pull` command.\n The command below copies a trace log named `sample.trace` from the device to\n the `~/Documents/trace-logs/` directory of your local machine.\n\n ```\n adb pull path-on-device/sample.trace ~/Documents/trace-logs/\n ```\n\n \u003cbr /\u003e\n\nYou can then\n[import the trace file](/studio/profile/import-traces) with the CPU Profiler."]]