
若要產生應用程式執行作業的方法追蹤記錄,您可以使用 Debug 類別檢測應用程式。以這種方式檢測應用程式,可讓您更精確地控制裝置開始及停止記錄追蹤資訊的時間。裝置也會使用您指定的名稱儲存追蹤記錄,方便您之後識別每個記錄檔。接下來,您可以使用 Android Studio CPU 分析器查看每個追蹤記錄。
您也可以在 CPU 分析器中啟動及停止追蹤,而不必檢測應用程式的程式碼。
開始產生追蹤記錄之前,請先確認您的應用程式已新增邏輯,可將追蹤記錄儲存至應用程式專用的目錄。
檢測應用程式
若要建立追蹤記錄,請在系統開始記錄追蹤資料的位置呼叫 startMethodTracing()。
在呼叫中,您可以為 .trace 檔案指定名稱,讓系統將檔案儲存到套件專屬目錄中,以便用於目標裝置上的永久應用程式資料。此為由 getExternalFilesDir() 傳回的相同目錄,且位於大多數裝置的 ~/sdcard/ 目錄中。檔案含有二進位方法追蹤記錄資料,以及包含執行緒和方法名稱的對應資料表。若要停止追蹤,請呼叫 stopMethodTracing()。
下列範例會開始及停止記錄名為 sample.trace 的追蹤記錄:
Kotlin
// Starts recording a trace log with the name you provide. For example, the
// following code tells the system to start recording a .trace file to the
// device with the name "sample.trace".
Debug.startMethodTracing("sample")

// The system begins buffering the generated trace data, until your
// application calls <code><a href="/reference/android/os/Debug.html#stopMethodTracing()">stopMethodTracing()</a></code>, at which time it writes
// the buffered data to the output file.
Debug.stopMethodTracing()
Java
// Starts recording a trace log with the name you provide. For example, the
// following code tells the system to start recording a .trace file to the
// device with the name "sample.trace".
Debug.startMethodTracing("sample");
...
// The system begins buffering the generated trace data, until your
// application calls <code><a href="/reference/android/os/Debug.html#stopMethodTracing()">stopMethodTracing()</a></code>, at which time it writes
// the buffered data to the output file.
Debug.stopMethodTracing();
請注意,如果您的應用程式再次呼叫 startMethodTracing(),而未變更追蹤記錄名稱,則會覆寫儲存在裝置上的現有記錄。若要瞭解如何動態變更每個追蹤記錄的名稱,請參閱「儲存多個記錄檔」一節。
如果系統在您呼叫 stopMethodTracing() 前達到緩衝區空間上限,系統會停止追蹤,並傳送通知至主控台。開始和停止追蹤記錄的方法適用於整個應用程式程序。也就是說,您可以在活動的 onCreate(Bundle) 方法中呼叫 startMethodTracing(),並在該活動的 onDestroy() 方法中呼叫 stopMethodTracing()。
請注意,啟用剖析功能時,應用程式執行速度會變慢。也就是說,您不應使用剖析資料來判斷絕對時間 (例如「方法 foo() 需要 2.5 秒才能執行」)。只有在與先前的追蹤記錄進行比較時,追蹤記錄中的時間資訊才有用,以便查看近期的變更是否加快或減緩應用程式的運作速度。
部署至搭載 Android 5.0 (API 級別 21) 以上版本的裝置時,您可以使用樣本式剖析功能,以降低對執行階段效能的影響。若要啟用樣本剖析,請以指定的取樣間隔呼叫 startMethodTracingSampling() (而非呼叫 startMethodTracing())。系統會定期收集樣本,直到應用程式呼叫 stopMethodTracing() 為止。
儲存多個記錄檔
如果應用程式多次啟動並停止方法追蹤記錄,卻沒有指定追蹤記錄的新名稱,裝置就會用新的記錄覆寫舊的追蹤記錄;也就是說,系統只會保留最新的追蹤記錄。若要將多個追蹤記錄儲存到您的裝置中,請在應用程式呼叫 startMethodTracing() 時動態重新命名追蹤記錄。以下範例使用 SimpleDateFormat 類別,在每個追蹤記錄命名時加入目前的日期和時間:
Kotlin
// Uses the <code><a href="/reference/java/text/SimpleDateFormat.html">SimpleDateFormat</a></code> class to create a String with
// the current date and time.
val dateFormat: DateFormat = SimpleDateFormat("dd_MM_yyyy_hh_mm_ss", Locale.getDefault())
val logDate: String = dateFormat.format(Date())
// Applies the date and time to the name of the trace log.
Debug.startMethodTracing("sample-$logDate")
Java
// Uses the <code><a href="/reference/java/text/SimpleDateFormat.html">SimpleDateFormat</a></code> class to create a String with
// the current date and time.
SimpleDateFormat dateFormat =
        new SimpleDateFormat("dd_MM_yyyy_hh_mm_ss", Locale.getDefault());
String logDate = dateFormat.format(new Date());
// Applies the date and time to the name of the trace log.
Debug.startMethodTracing(
        "sample-" + logDate);
存取裝置上的追蹤記錄
系統在裝置上建立追蹤記錄後,您可以透過下列其中一種方式存取檔案:
使用 Device Explorer。如要開啟 Device Explorer,請依序點選「View」>「Tool Windows」>「Device Explorer」,或者按一下工具視窗列中的「Device Explorer」按鈕
 。如圖 1 所示,只要前往應用程式的套件專屬目錄,即可找到
 .trace檔案。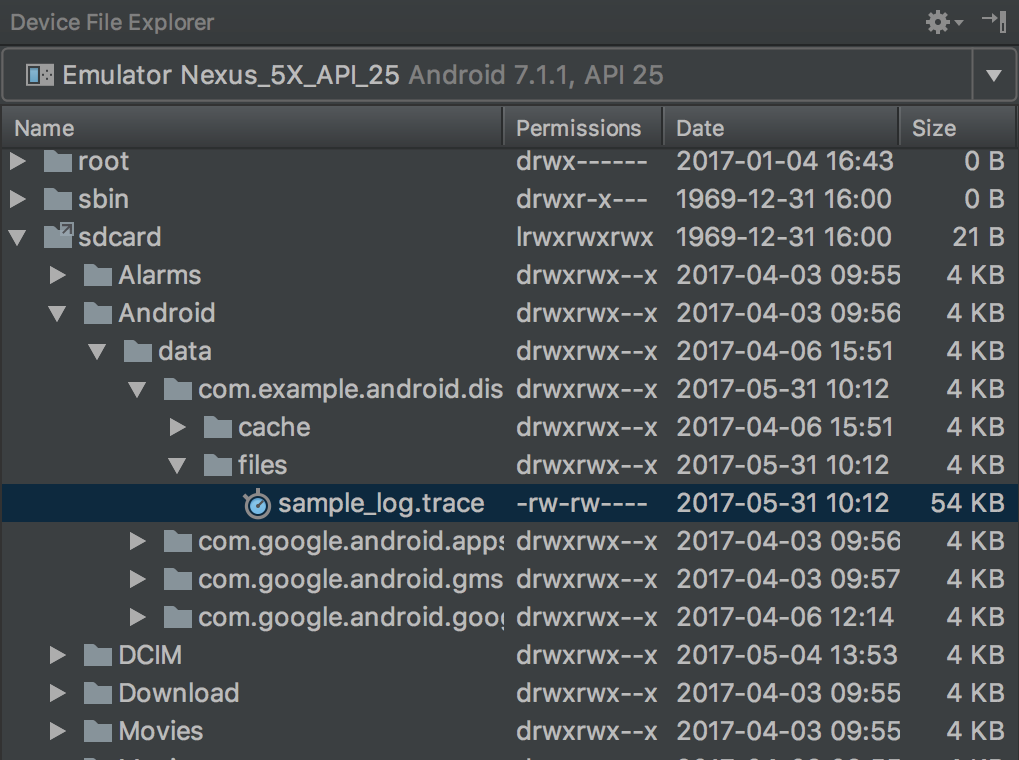
圖 1. 使用 Device Explorer 找到追蹤記錄。
使用
adb pull指令,將檔案複製到本機電腦。下列指令會將名為sample.trace的追蹤記錄從裝置複製到本機電腦的~/Documents/trace-logs/目錄。adb pull path-on-device/sample.trace ~/Documents/trace-logs/
接下來,您可以使用 CPU 分析器匯入追蹤記錄檔。