
アプリ実行のメソッド トレースを生成するために、Debug クラスを使ってアプリをインストルメント化できます。この方法でアプリをインストルメント化すると、デバイスがトレース情報の記録を開始、停止する正確なタイミングをより細かく制御できます。また、デバイスでは指定した名前でトレースログが保存されるため、後で各ログを簡単に特定できます。各トレースログは Android Studio の CPU Profiler で表示できます。
アプリのコードをインストルメント化しなくても、CPU Profiler でトレースを開始、停止することもできます。
トレースログの生成を開始する前に、トレースログをアプリ固有のディレクトリに保存するためのロジックが追加されていることを確認してください。
アプリをインストルメント化する
トレースログを生成するには、トレースデータのログ記録を開始する場所で startMethodTracing() を呼び出します。
この呼び出しで .trace ファイルの名前を指定すると、ターゲット デバイス上で永続的なアプリデータを保存するためのパッケージ固有ディレクトリにファイルが保存されます。このディレクトリは、getExternalFilesDir() で返されるものと同じであり、ほとんどのデバイスでは ~/sdcard/ ディレクトリ以下になります。このファイルには、メソッド トレースのバイナリデータと、スレッド名とメソッド名のマッピング テーブルが含まれます。トレースを停止するには、stopMethodTracing() を呼び出します。
次のサンプルでは、sample.trace という名前のトレースログの記録の開始と停止が行われます。
Kotlin
// Starts recording a trace log with the name you provide. For example, the
// following code tells the system to start recording a .trace file to the
// device with the name "sample.trace".
Debug.startMethodTracing("sample")

// The system begins buffering the generated trace data, until your
// application calls <code><a href="/reference/android/os/Debug.html#stopMethodTracing()">stopMethodTracing()</a></code>, at which time it writes
// the buffered data to the output file.
Debug.stopMethodTracing()
Java
// Starts recording a trace log with the name you provide. For example, the
// following code tells the system to start recording a .trace file to the
// device with the name "sample.trace".
Debug.startMethodTracing("sample");
...
// The system begins buffering the generated trace data, until your
// application calls <code><a href="/reference/android/os/Debug.html#stopMethodTracing()">stopMethodTracing()</a></code>, at which time it writes
// the buffered data to the output file.
Debug.stopMethodTracing();
トレースログの名前を変更せずにアプリで startMethodTracing() を再度呼び出した場合、デバイスに保存された既存のログが上書きされることに注意してください。各トレースログの名前を動的に変更する方法について詳しくは、複数のログを保存するのセクションをご覧ください。
stopMethodTracing() を呼び出す前にシステムが最大バッファサイズに到達した場合は、トレースが停止して通知がコンソールに送られます。トレースの開始と停止を行うメソッドは、アプリプロセス全体で機能します。つまり、アクティビティの onCreate(Bundle) メソッドで startMethodTracing() を呼び出し、そのアクティビティの onDestroy() メソッドで stopMethodTracing() を呼び出すことができます。
プロファイリングを有効にすると、アプリの実行速度が遅くなることに注意してください。つまり、プロファイリング データを使用して、絶対的なタイミング(「メソッド foo() の実行に 2.5 秒かかる」など)を決定することはできません。トレースログのタイミング情報は、以前のトレースログと比較した場合にのみ有用であり、その場合は最近の変更によりアプリの速度が速くなったか、遅くなったかを確認できます。
Android 5.0(API レベル 21)以降を搭載しているデバイスにデプロイする際、サンプルを基にしたプロファイリングを使用すると、実行時のパフォーマンスへの影響を抑えてプロファイリングできます。サンプルを基にしたプロファイリングを有効にするには、(startMethodTracing() を呼び出す代わりに)startMethodTracingSampling() を呼び出して、サンプリング間隔を指定します。アプリで stopMethodTracing() を呼び出すまで、定期的にサンプルが収集されます。
複数のログを保存する
トレースログの新しい名前を指定せずにアプリがメソッド トレースの開始と停止を繰り返すと、デバイスでは古いトレースログが新しいトレースログで上書きされます。つまり、最新のトレースログのみが保持されます。デバイスに複数のトレースログを保存するには、アプリで startMethodTracing() を呼び出すたびにトレースログの名前を動的に変更します。以下のサンプルでは、SimpleDateFormat クラスを使用して、各トレースログに名前を付けるときに現在の日時を追加しています。
Kotlin
// Uses the <code><a href="/reference/java/text/SimpleDateFormat.html">SimpleDateFormat</a></code> class to create a String with
// the current date and time.
val dateFormat: DateFormat = SimpleDateFormat("dd_MM_yyyy_hh_mm_ss", Locale.getDefault())
val logDate: String = dateFormat.format(Date())
// Applies the date and time to the name of the trace log.
Debug.startMethodTracing("sample-$logDate")
Java
// Uses the <code><a href="/reference/java/text/SimpleDateFormat.html">SimpleDateFormat</a></code> class to create a String with
// the current date and time.
SimpleDateFormat dateFormat =
        new SimpleDateFormat("dd_MM_yyyy_hh_mm_ss", Locale.getDefault());
String logDate = dateFormat.format(new Date());
// Applies the date and time to the name of the trace log.
Debug.startMethodTracing(
        "sample-" + logDate);
デバイスでトレースログにアクセスする
デバイスにトレースログが作成されたら、次のいずれかの方法でそのファイルにアクセスできます。
Device Explorer を使用します。Device Explorer を開くには、[View] > [Tool Windows] > [Device Explorer] をクリックします(または、ツール ウィンドウ バーで Device Explorer アイコン
 をクリックします)。図 1 に示すように、アプリのパッケージ固有のディレクトリに移動して
 .traceファイルを見つけることができます。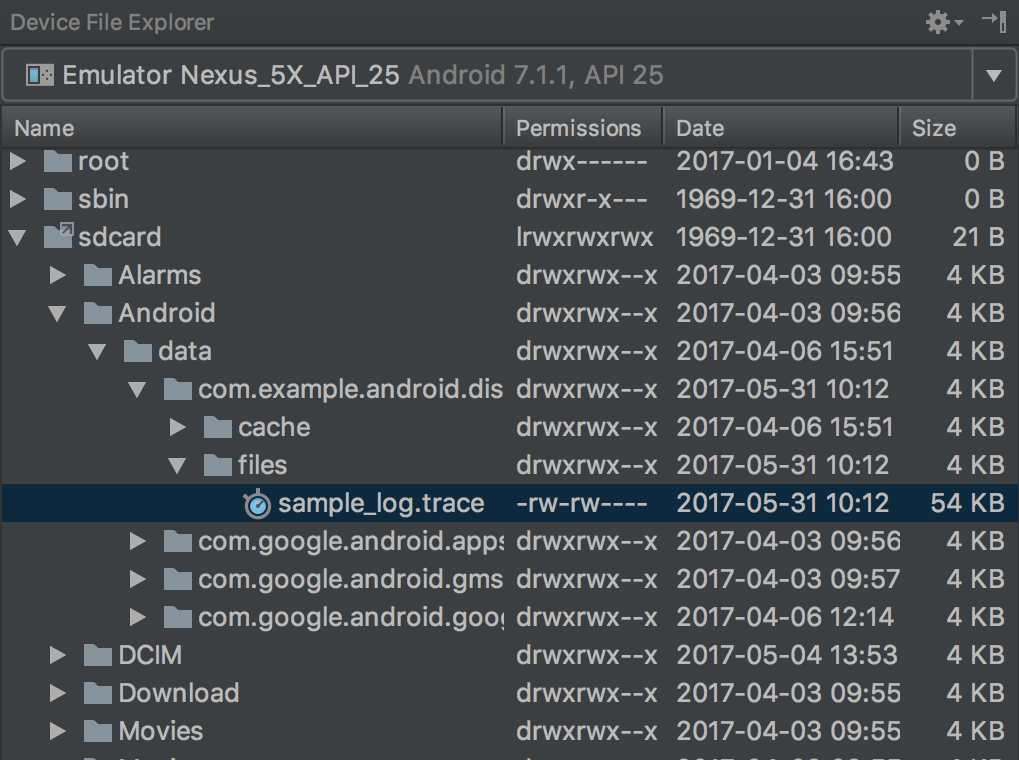
図 1. Device Explorer を使用してトレースログを探しているところ
adb pullコマンドを使用してファイルをローカルマシンにコピーします。以下のコマンドは、sample.traceという名前のトレースログをデバイスからローカルマシンの~/Documents/trace-logs/ディレクトリにコピーします。adb pull path-on-device/sample.trace ~/Documents/trace-logs/
その後、CPU Profiler を使用してトレース ファイルをインポートできます。