บันทึกการติดตามของระบบ
จัดทุกอย่างให้เป็นระเบียบอยู่เสมอด้วยคอลเล็กชัน
บันทึกและจัดหมวดหมู่เนื้อหาตามค่ากำหนดของคุณ
การติดตามระบบจะแสดงกิจกรรมและการใช้ทรัพยากรทั่วทั้งระบบ เพื่อให้คุณ
ดูวิธีตั้งเวลาและเรียกใช้กระบวนการของแอปได้ มุมมองการติดตามระบบใน
เครื่องมือสร้างโปรไฟล์ของ Android Studio มักใช้เพื่อตรวจสอบสิ่งต่อไปนี้
- วิธีที่กระบวนการของแอปและระบบกระจายไปทั่วคอร์และเธรดของอุปกรณ์
- UI แสดงผลได้ราบรื่นเพียงใด
- การใช้พลังงานทั้งในระดับอุปกรณ์และแอป
หน้านี้แสดงภาพรวมของภาพที่ใช้กันมากที่สุดในมุมมองการติดตามระบบ
ดูรายละเอียดเพิ่มเติมเกี่ยวกับการแสดงภาพข้อมูลที่ไม่ได้อธิบายไว้ที่นี่ได้ในคำศัพท์ของแผนภูมิ
ดูตัวอย่างโดยละเอียดเพิ่มเติม
เกี่ยวกับสิ่งที่ควรใช้การติดตามระบบได้ในหน้าอื่นๆ ในส่วนนี้
หลังจากบันทึกการติดตามระบบแล้ว คุณจะเห็นภาพต่อไปนี้แสดงบนไทม์ไลน์
คุณควรให้ความสำคัญกับความสัมพันธ์ของทรัพยากรระบบต่างๆ เช่น หากสังเกตเห็นว่ามีค่าสูงสุดในรางจ่ายไฟของโมเด็ม คุณควรไปที่ส่วนเธรดและดูว่ากิจกรรมของเธรดใดที่อาจทำให้เกิดค่าสูงสุดในขณะนั้น
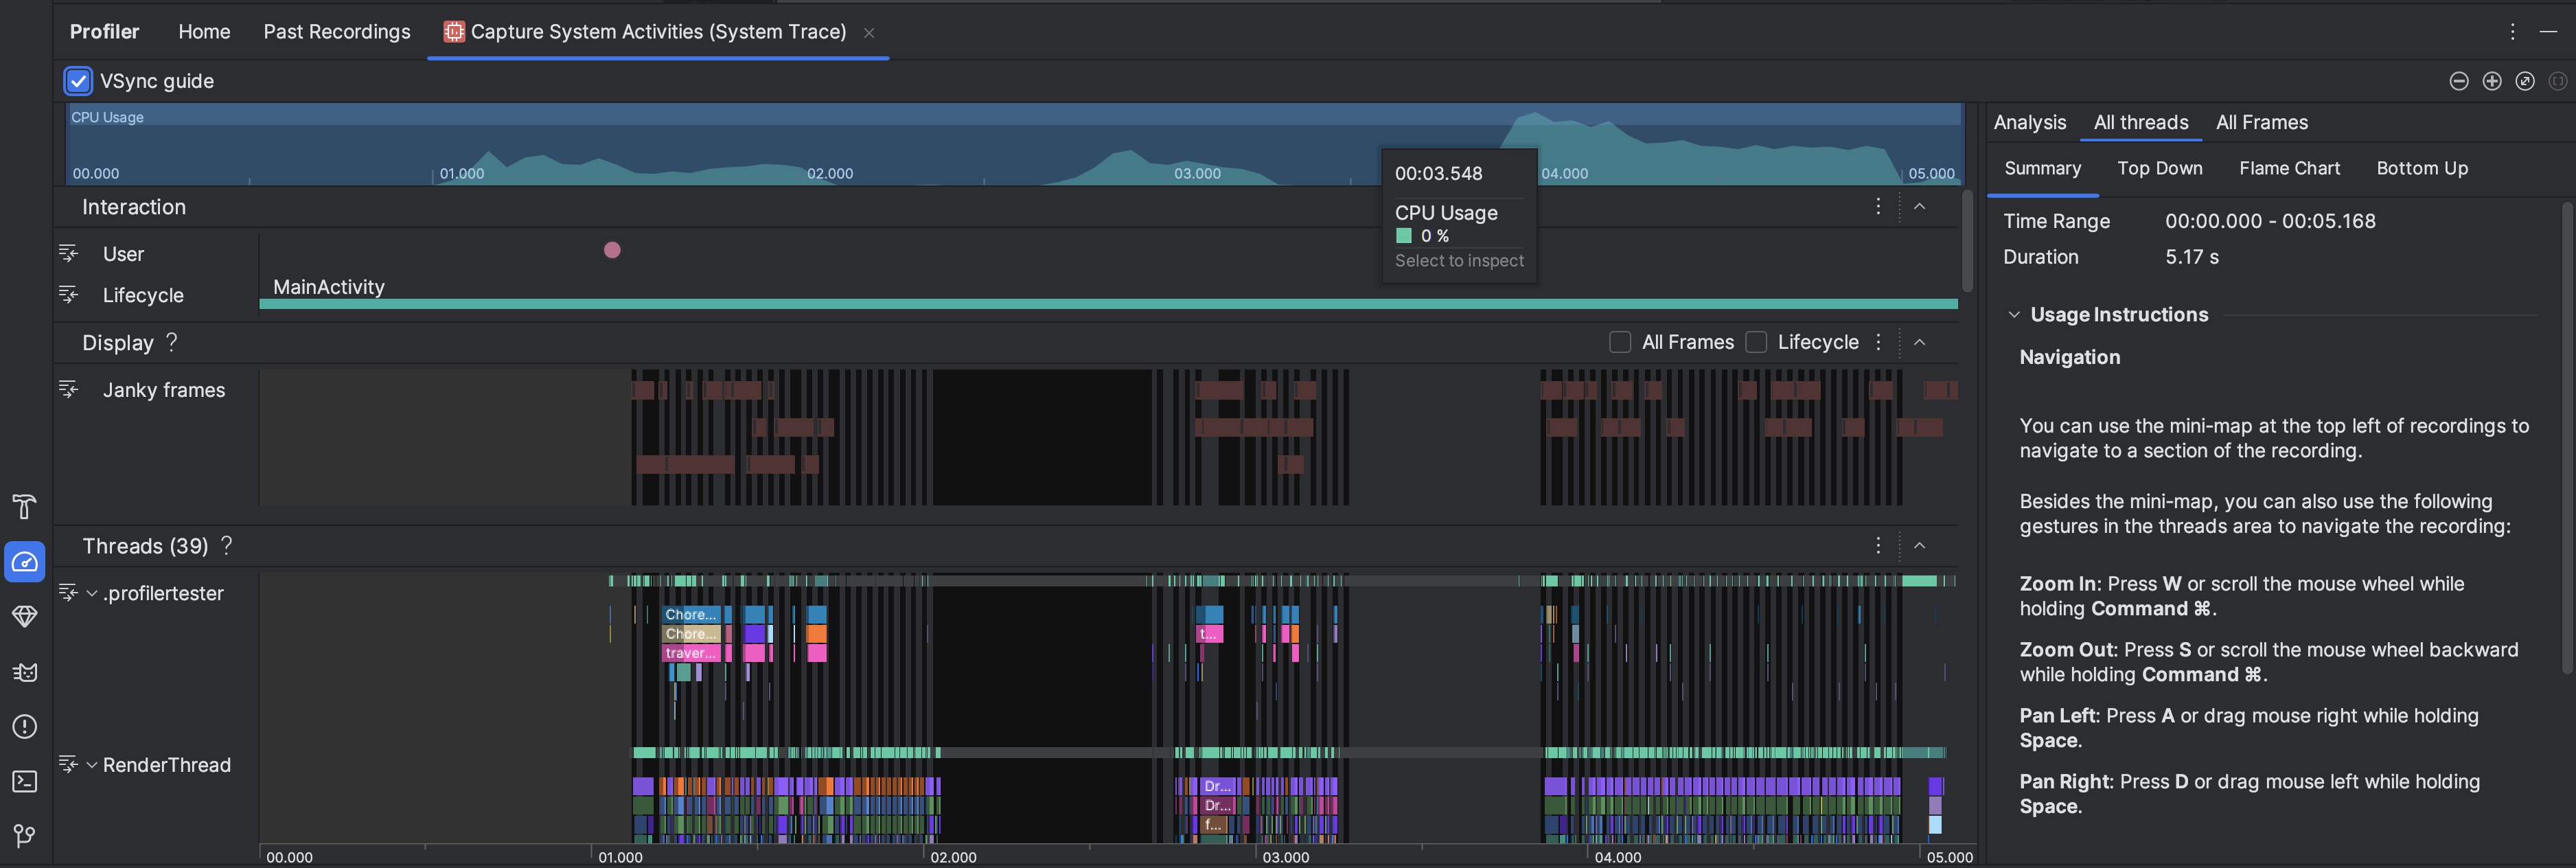
- การใช้งาน CPU: แสดงการใช้งาน CPU ของแอปเป็นเปอร์เซ็นต์ของความจุ CPU ทั้งหมดที่ใช้ได้ตามเวลา
ไฮไลต์ส่วนของไทม์ไลน์เพื่อกรองรายละเอียดของช่วงเวลานั้น
- การโต้ตอบ: แสดงการโต้ตอบของผู้ใช้และเหตุการณ์วงจรของแอปตามไทม์ไลน์ (ต้องมีกระบวนการแอปที่แก้ไขข้อบกพร่องได้และอุปกรณ์ที่ใช้ API ระดับ 26 ขึ้นไป)
- การแสดงผล: แสดงข้อมูลที่เกี่ยวข้องกับความราบรื่นในการแสดงผล UI ของแอป เลือกวงจรเพื่อตรวจสอบระยะเวลาที่แอปใช้ในการแสดงผลแต่ละเฟรมใน
เธรดหลักและ
RenderThread
ข้อมูลนี้มีประโยชน์ในการตรวจสอบ
คอขวดที่ทำให้ UI กระตุกและมี
อัตราเฟรมต่ำ
เธรด: แสดงเธรดที่แอปและกระบวนการของระบบต่างๆ ทำงาน
ดูวิธีใช้การติดตามระบบเพื่อตรวจสอบและช่วยลดการกระตุกของ UI ได้ที่ตรวจหาการกระตุกของ UI
เคล็ดลับ: เมื่อตรวจสอบไทม์ไลน์ของ
Threads คุณจะใช้แป้นพิมพ์ลัดต่อไปนี้ได้
- ซูมเข้า: กด W หรือหมุนล้อเมาส์ขณะกด Ctrl (Command ใน macOS) ค้างไว้
- ซูมออก: กด S หรือเลื่อนล้อเมาส์ไปข้างหลัง
ขณะกด Ctrl ค้างไว้ (Command ใน macOS)
- เลื่อนไปทางซ้าย: กด A หรือลากเมาส์ไปทางขวาขณะ
กด Space ค้างไว้
- เลื่อนไปทางขวา: กด D หรือลากเมาส์ไปทางซ้ายขณะกด Space ค้างไว้
- ขยายหรือยุบเธรด: ดับเบิลคลิกชื่อเธรดหรือ
กด Enter ขณะเลือกเธรด
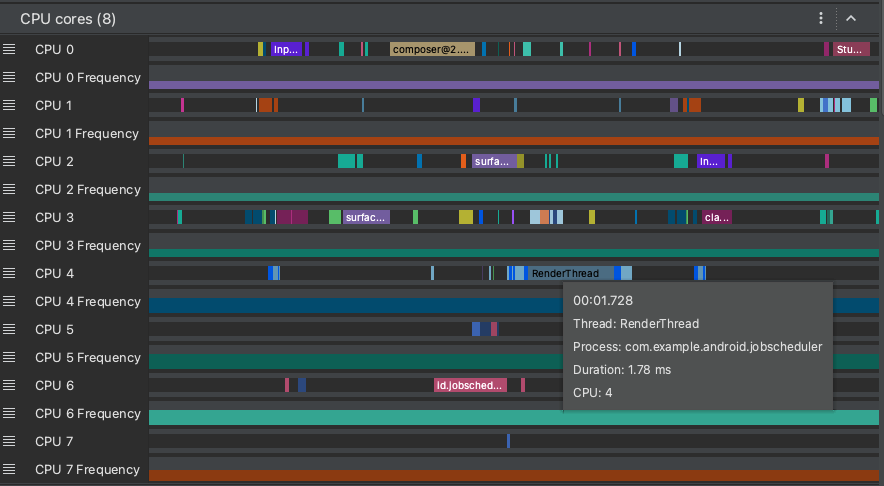
แกน CPU: แสดงกิจกรรมในแต่ละแกนในอุปกรณ์ การดูกิจกรรมตามคอร์อาจช่วยให้คุณทราบว่าคอร์ใดเป็น"คอร์ใหญ่" หรือ "คอร์เล็ก" ในโปรเซสเซอร์มือถือรุ่นใหม่
วางตัวชี้เหนือกิจกรรมของเธรดเพื่อดูว่าเธรดใดที่คอร์นี้ทำงานอยู่ ณ เวลาดังกล่าว
หน่วยความจำของกระบวนการ (RSS): แสดงปริมาณหน่วยความจำจริงที่แอปใช้งานอยู่ในปัจจุบัน
ดูรายละเอียดเพิ่มเติมได้ที่คำศัพท์แผนภูมิ
รางจ่ายไฟ: ปรากฏเมื่อคุณสร้างโปรไฟล์ในอุปกรณ์จริง ดูข้อมูลเพิ่มเติมได้ที่ตรวจสอบการใช้พลังงาน
แบตเตอรี่: แสดงการใช้งานแบตเตอรี่ของแอป
ตัวอย่างเนื้อหาและโค้ดในหน้าเว็บนี้ขึ้นอยู่กับใบอนุญาตที่อธิบายไว้ในใบอนุญาตการใช้เนื้อหา Java และ OpenJDK เป็นเครื่องหมายการค้าหรือเครื่องหมายการค้าจดทะเบียนของ Oracle และ/หรือบริษัทในเครือ
อัปเดตล่าสุด 2025-07-27 UTC
[[["เข้าใจง่าย","easyToUnderstand","thumb-up"],["แก้ปัญหาของฉันได้","solvedMyProblem","thumb-up"],["อื่นๆ","otherUp","thumb-up"]],[["ไม่มีข้อมูลที่ฉันต้องการ","missingTheInformationINeed","thumb-down"],["ซับซ้อนเกินไป/มีหลายขั้นตอนมากเกินไป","tooComplicatedTooManySteps","thumb-down"],["ล้าสมัย","outOfDate","thumb-down"],["ปัญหาเกี่ยวกับการแปล","translationIssue","thumb-down"],["ตัวอย่าง/ปัญหาเกี่ยวกับโค้ด","samplesCodeIssue","thumb-down"],["อื่นๆ","otherDown","thumb-down"]],["อัปเดตล่าสุด 2025-07-27 UTC"],[],[],null,["# Record a system trace\n\nA system trace shows you system-wide activities and resource usage, so you can\nsee how your app processes are scheduled and run. The system trace view in the\nAndroid Studio Profiler is commonly used to investigate the following:\n\n- How app and system processes are distributed across device cores and threads.\n- How smoothly the UI renders.\n- Power usage at both the device and app level.\n\nThis page provides an overview of the most commonly used visuals in the system\ntrace view. See the [chart glossary](/studio/profile/chart-glossary/flame-chart)\nfor more details about visualizations not described here. For more detailed\nexamples of what to use a system trace for, see the other pages in this section.\n\nAfter you [record a system trace](/studio/profile#start-profiling), you see the\nfollowing visualizations displayed over a timeline. You should focus on how\ndifferent system resources are correlated; for example, if you notice a spike in\nthe modem power rail, you should go to the threads section and see what thread\nactivity could be causing the spike at the time.\n\n- **CPU Usage**: Shows CPU usage of your app as a percentage of total available CPU capacity by time. Highlight a section of the timeline to filter to the details for that time period.\n- **Interactions** : Shows user interaction and app lifecycle events along a timeline (requires a [debuggable](/studio/profile#profileable-v-debuggable) app process and a device running API level 26 or higher).\n- **Display** : Shows info related to how smooth your app UI renders. Select **Lifecycle** to inspect how long it takes your app to render each frame on the main thread and `RenderThread`. This info is helpful for [investigating\n bottlenecks that cause UI jank and low\n framerates](/studio/profile/jank-detection).\n- **Threads** : Shows the threads that your app and various system processes run\n on. To learn about how to use system traces to investigate and help reduce UI\n jank, see [Detect UI jank](/studio/profile/jank-detection).\n\n **Tip:** When inspecting the **Threads** timeline, the following shortcuts are available:\n - **Zoom in:** Press \u003ckbd\u003eW\u003c/kbd\u003e or scroll the mouse wheel while holding \u003ckbd\u003eCtrl\u003c/kbd\u003e (\u003ckbd\u003eCommand\u003c/kbd\u003e on macOS).\n - **Zoom out:** Press \u003ckbd\u003eS\u003c/kbd\u003e or scroll the mouse wheel backward while holding \u003ckbd\u003eCtrl\u003c/kbd\u003e (\u003ckbd\u003eCommand\u003c/kbd\u003e on macOS).\n - **Pan left:** Press \u003ckbd\u003eA\u003c/kbd\u003e or drag mouse right while holding \u003ckbd\u003eSpace\u003c/kbd\u003e.\n - **Pan right:** Press \u003ckbd\u003eD\u003c/kbd\u003e or drag mouse left while holding \u003ckbd\u003eSpace\u003c/kbd\u003e.\n - **Expand or collapse a thread:** Double-click the thread name or press \u003ckbd\u003eEnter\u003c/kbd\u003e while a thread is selected.\n- **CPU cores** : Shows the activity on each core in your device. Viewing the\n activity by core might give you an idea of which ones are the [\"big\" or\n \"little\" cores](https://en.wikipedia.org/wiki/ARM_big.LITTLE) in\n modern mobile processors. Hold the pointer over a thread activity to\n see which thread this core is running on at that particular time.\n\n- **Process Memory (RSS)**: Shows the amount of physical memory currently in use\n by the app. For more details, see the chart glossary.\n\n- **Power Rails** : Appears when you profile on a physical device. For more info,\n see [Inspect power usage](/studio/profile/power-profiler).\n\n- **Battery**: Shows your app's battery usage."]]