แผนภูมิเปลวไฟ
จัดทุกอย่างให้เป็นระเบียบอยู่เสมอด้วยคอลเล็กชัน
บันทึกและจัดหมวดหมู่เนื้อหาตามค่ากำหนดของคุณ
แท็บแผนภูมิเปลวไฟแสดงแผนภูมิการเรียกแบบกลับด้านที่รวบรวม
สแต็กการเรียกที่เหมือนกัน กล่าวคือ ระบบจะรวบรวมเมธอดหรือฟังก์ชันที่เหมือนกันซึ่งใช้ลำดับผู้โทรเดียวกัน และแสดงเป็นแถบที่ยาวขึ้นใน
แผนภูมิเปลวไฟ (แทนที่จะแสดงเป็นแถบที่สั้นกว่าหลายแถบ ดังที่แสดงใน
แผนภูมิการเรียก) ซึ่งจะช่วยให้คุณดูได้ง่ายขึ้นว่าเมธอดหรือฟังก์ชันใดใช้เวลามากที่สุด อย่างไรก็ตาม การดำเนินการนี้ยังหมายความว่าแกนนอนไม่ได้แสดงไทม์ไลน์ แต่จะแสดงระยะเวลาสัมพัทธ์ที่แต่ละเมธอดหรือฟังก์ชันใช้ในการดำเนินการแทน
ดูแผนภูมิการเรียกใช้ในรูปที่ 1 เพื่อช่วยอธิบายแนวคิดนี้ โปรดทราบว่าเมธอด D จะเรียก B หลายครั้ง (B1, B2 และ B3) และการเรียก B บางครั้งจะเรียก C (C1 และ C3)
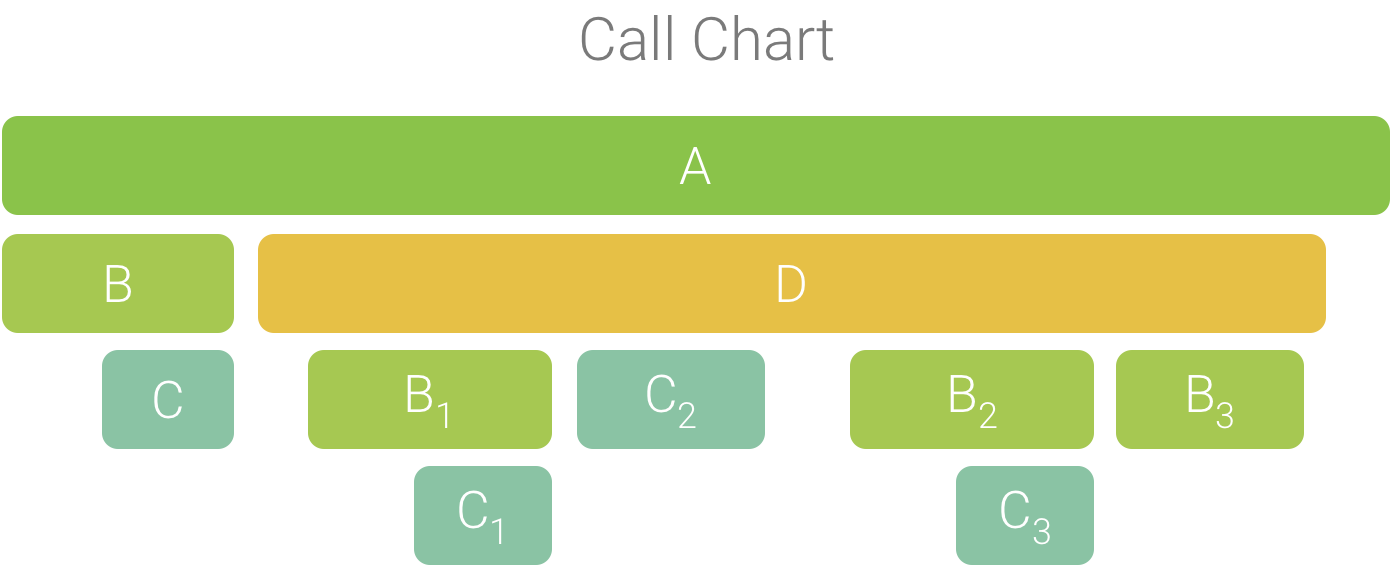
รูปที่ 1 แผนภูมิการโทรที่มีการเรียกใช้เมธอดหลายรายการ
ซึ่งใช้ลำดับผู้โทรร่วมกัน
เนื่องจาก B1, B2 และ B3 มีลำดับผู้โทรเหมือนกัน (A → D → B) ระบบจึงรวบรวมข้อมูลตามที่แสดงในรูปที่ 2 ในทํานองเดียวกัน ระบบจะรวบรวม C1 และ C3 เนื่องจากมีลําดับผู้โทรเหมือนกัน (A → D → B → C) โปรดทราบว่าระบบจะไม่รวม C2 เนื่องจากมีลําดับผู้โทรที่แตกต่างกัน (A → D → C)
รูปที่ 2 รวบรวมวิธีการที่เหมือนกันซึ่งใช้สแต็กการเรียกใช้เดียวกัน
ระบบจะใช้การเรียกที่รวบรวมไว้เพื่อสร้างแผนภูมิเปลวไฟ ดังที่แสดงในรูปที่ 3
โปรดทราบว่าสำหรับการเรียกใดๆ ในแผนภูมิเปลวเพลิง ผู้ถูกเรียกที่ใช้เวลา CPU มากที่สุดจะปรากฏก่อน
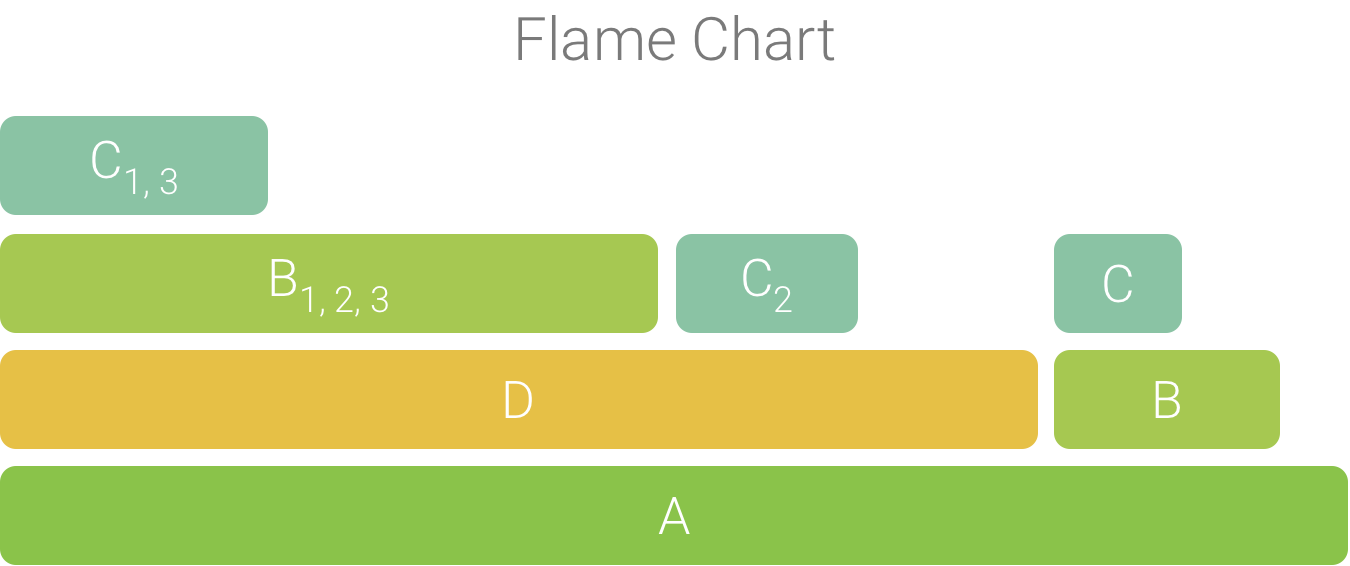
รูปที่ 3 แผนภูมิเปลวไฟแสดงการเรียก
แผนภูมิที่แสดงในรูปที่ 5
ตัวอย่างเนื้อหาและโค้ดในหน้าเว็บนี้ขึ้นอยู่กับใบอนุญาตที่อธิบายไว้ในใบอนุญาตการใช้เนื้อหา Java และ OpenJDK เป็นเครื่องหมายการค้าหรือเครื่องหมายการค้าจดทะเบียนของ Oracle และ/หรือบริษัทในเครือ
อัปเดตล่าสุด 2025-07-27 UTC
[[["เข้าใจง่าย","easyToUnderstand","thumb-up"],["แก้ปัญหาของฉันได้","solvedMyProblem","thumb-up"],["อื่นๆ","otherUp","thumb-up"]],[["ไม่มีข้อมูลที่ฉันต้องการ","missingTheInformationINeed","thumb-down"],["ซับซ้อนเกินไป/มีหลายขั้นตอนมากเกินไป","tooComplicatedTooManySteps","thumb-down"],["ล้าสมัย","outOfDate","thumb-down"],["ปัญหาเกี่ยวกับการแปล","translationIssue","thumb-down"],["ตัวอย่าง/ปัญหาเกี่ยวกับโค้ด","samplesCodeIssue","thumb-down"],["อื่นๆ","otherDown","thumb-down"]],["อัปเดตล่าสุด 2025-07-27 UTC"],[],[],null,["# Flame chart\n\nThe **Flame Chart** tab provides an inverted call chart that aggregates\nidentical call stacks. That is, identical methods or functions that share the\nsame sequence of callers are collected and represented as one longer bar in a\nflame chart (rather than displaying them as multiple shorter bars, as shown in a\ncall chart). This makes it easier to see which methods or functions consume the\nmost time. However, this also means that the horizontal axis doesn't represent a\ntimeline; instead, it indicates the relative amount of time each method or\nfunction takes to execute.\n\nTo help illustrate this concept, consider the call chart in Figure 1. Note\nthat method D makes multiple calls to B (B~1~, B~2~, and\nB~3~), and some of those calls to B make a call to C (C~1~ and\nC~3~).\n\n\n**Figure 1.** A call chart with multiple method calls\nthat share a common sequence of callers.\n\n\u003cbr /\u003e\n\nBecause B~1~, B~2~, and B~3~ share the same sequence\nof callers (A → D → B) they are aggregated, as shown in Figure 2. Similarly,\nC~1~ and C~3~ are aggregated because they share the same\nsequence of callers (A → D → B → C); note that C~2~ is not included\nbecause it has a different sequence of callers (A → D → C).\n\n\n**Figure 2.** Aggregating identical methods that share\nthe same call stack.\n\n\u003cbr /\u003e\n\nThe aggregated calls are used to create the flame chart, as shown in Figure 3.\nNote that, for any given call in a flame chart, the callees that consume the\nmost CPU time appear first.\n\n\n**Figure 3.** A flame chart representation of the call\nchart shown in figure 5.\n\n\u003cbr /\u003e"]]