錄製系統追蹤記錄
透過集合功能整理內容
你可以依據偏好儲存及分類內容。
系統追蹤記錄會顯示全系統的活動和資源用量,方便您瞭解應用程式程序的排程和執行方式。Android Studio 分析器中的系統追蹤檢視畫面通常用於調查下列事項:
- 應用程式和系統程序在裝置核心和執行緒間的分配方式。
- UI 的算繪流暢度。
- 裝置和應用程式層級的耗電量。
本頁面提供系統追蹤檢視畫面中最常用的視覺化元素總覽。如要進一步瞭解本文未說明的視覺化圖表,請參閱圖表詞彙表。如需系統追蹤的詳細使用範例,請參閱本節的其他頁面。
錄製系統追蹤記錄後,時間軸上會顯示下列視覺化資料。您應著重於不同系統資源的關聯性;舉例來說,如果您發現數據機電源軌的尖峰,應前往執行緒部分,查看當時可能導致尖峰的執行緒活動。

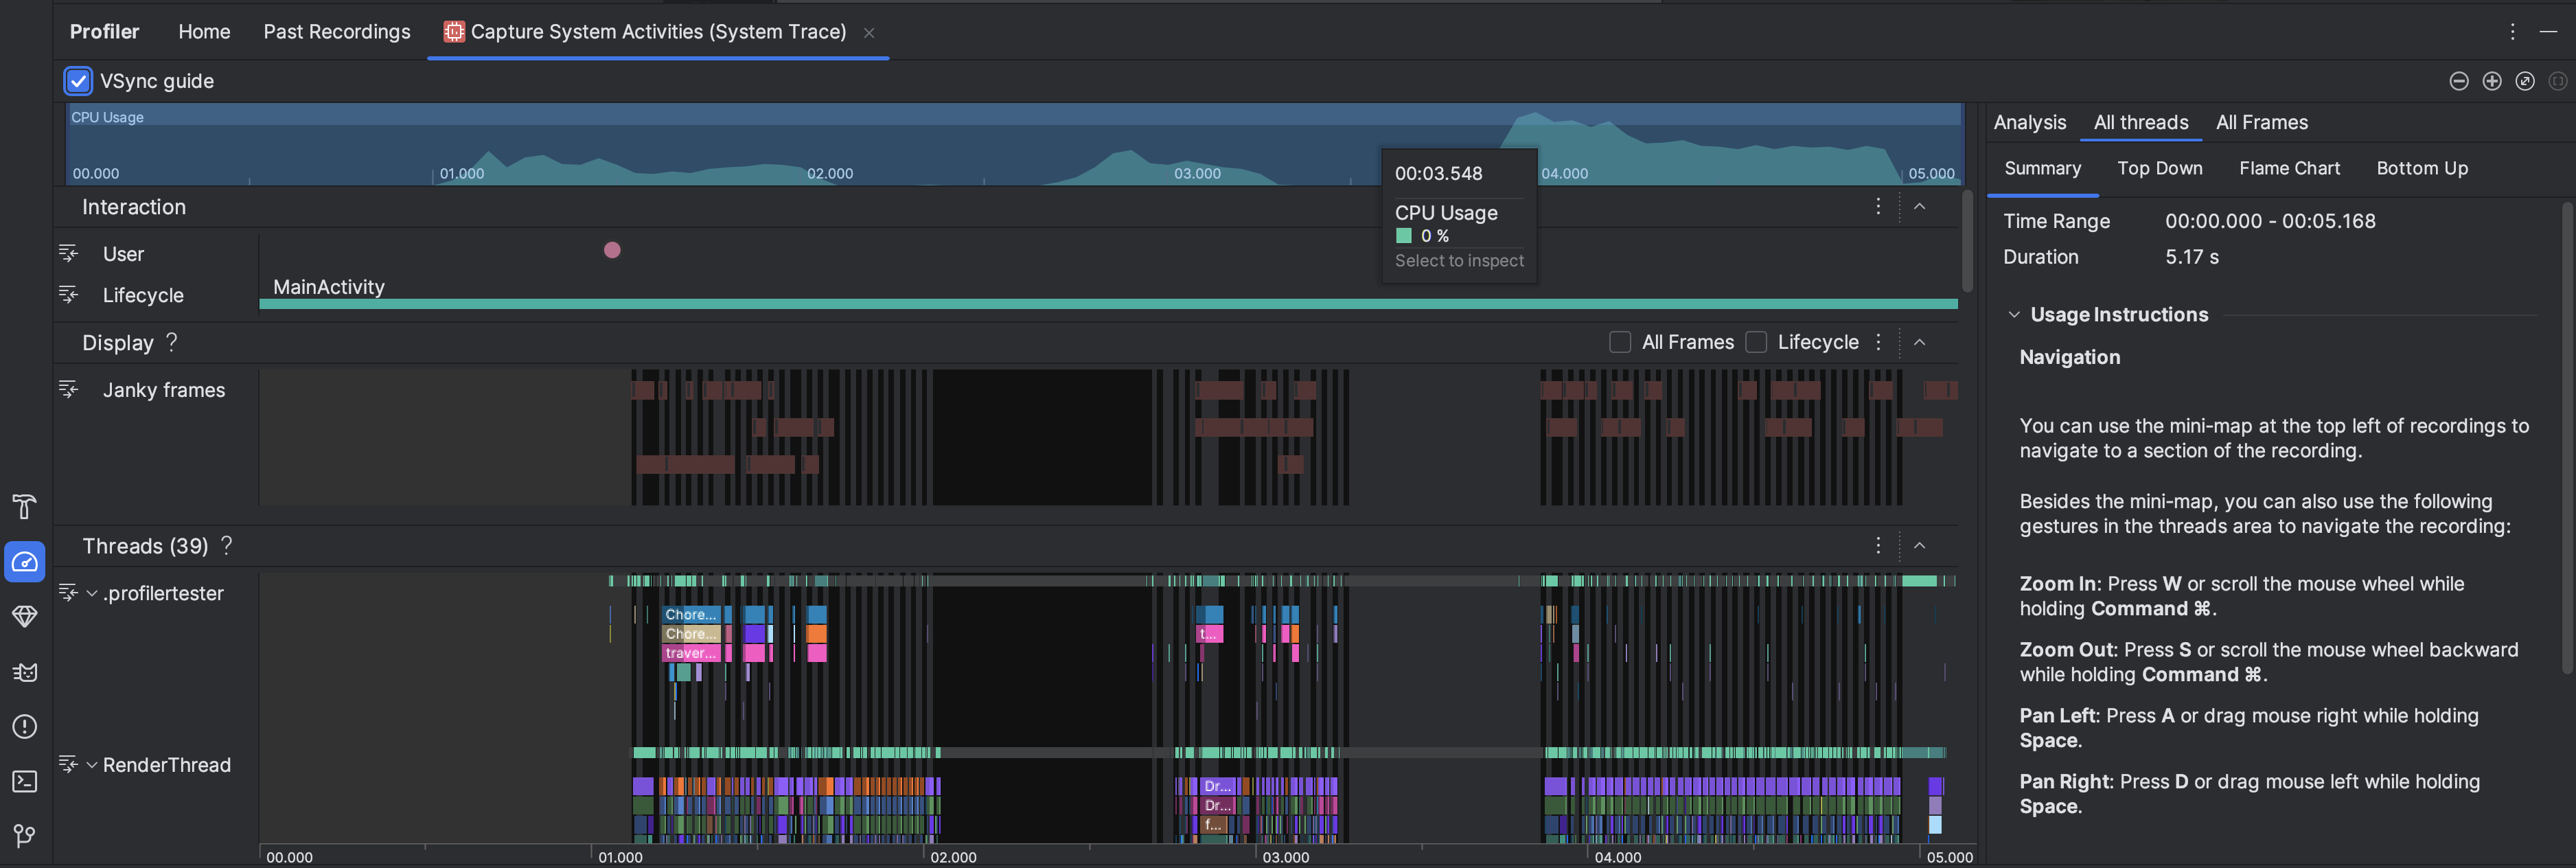
- CPU 用量:顯示應用程式的 CPU 用量,以和總可用 CPU 容量之間的百分比呈現。醒目顯示時間軸的某個部分,即可篩選出該時間範圍的詳細資料。
- 互動:顯示時間軸中的使用者互動和應用程式生命週期中大小事件 (需要可偵錯的應用程式程序,以及執行 API 級別 26 以上版本的裝置)。
- 顯示:顯示與應用程式 UI 算繪流暢度相關的資訊。選取「生命週期」,即可檢查應用程式在主執行緒和
RenderThread
上轉譯每個影格所需的時間。這項資訊有助於調查造成 UI 資源浪費和影格速率低落的瓶頸。
執行緒:顯示應用程式和各種系統程序執行的執行緒。如要瞭解如何使用系統追蹤記錄來調查並降低 UI jank,請參閱「偵測 UI jank」。
提示:檢查「Threads」
時間軸時,您可以使用下列快捷鍵:
- 放大:按住 W 鍵,或按住 Ctrl 鍵 (macOS 上的 Command 鍵) 時滾動滑鼠滾輪。
- 縮小:按住 S 鍵,或按住 Ctrl 鍵 (macOS 上的 Command 鍵) 時反方向滾動滑鼠滾輪。
- 向左平移:按住 A 鍵,或按住 Space 鍵並將滑鼠向右拖曳。
- 向右平移:按住 D 鍵,或按住 Space 鍵並將滑鼠向左拖曳。
- 展開或收合執行緒:在執行緒名稱上按兩下,或選擇執行緒後按下 Enter 鍵。
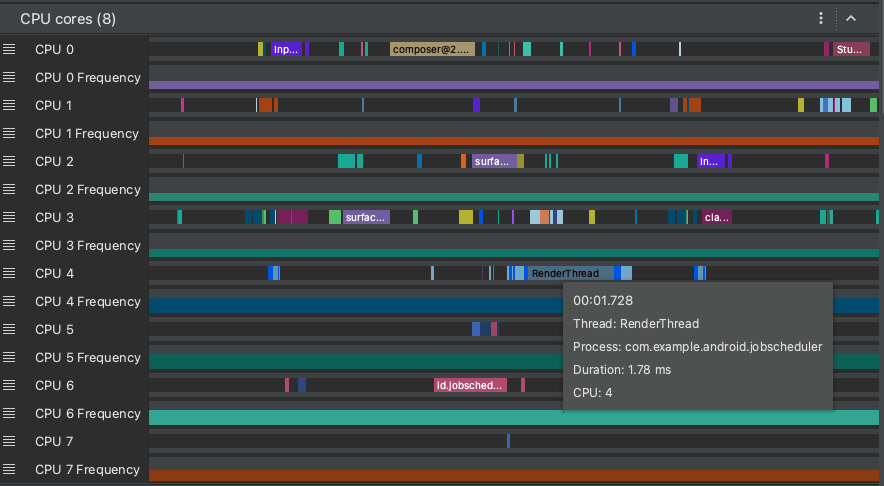
CPU 核心:顯示裝置中每個核心的活動。查看每個核心的活動量,或許能讓您瞭解新型行動處理器中屬於「大」或「小」的核心。將指標懸停在執行緒活動上,即可查看這個核心在特定時間執行的執行緒。

程序記憶體 (RSS):顯示應用程式目前使用的實體記憶體量。詳情請參閱圖表詞彙。
電源軌:在實體裝置上進行剖析時顯示。詳情請參閱「檢查耗電量」。
電池:顯示應用程式的電池用量。
這個頁面中的內容和程式碼範例均受《內容授權》中的授權所規範。Java 與 OpenJDK 是 Oracle 和/或其關係企業的商標或註冊商標。
上次更新時間:2025-07-27 (世界標準時間)。
[[["容易理解","easyToUnderstand","thumb-up"],["確實解決了我的問題","solvedMyProblem","thumb-up"],["其他","otherUp","thumb-up"]],[["缺少我需要的資訊","missingTheInformationINeed","thumb-down"],["過於複雜/步驟過多","tooComplicatedTooManySteps","thumb-down"],["過時","outOfDate","thumb-down"],["翻譯問題","translationIssue","thumb-down"],["示例/程式碼問題","samplesCodeIssue","thumb-down"],["其他","otherDown","thumb-down"]],["上次更新時間:2025-07-27 (世界標準時間)。"],[],[],null,["# Record a system trace\n\nA system trace shows you system-wide activities and resource usage, so you can\nsee how your app processes are scheduled and run. The system trace view in the\nAndroid Studio Profiler is commonly used to investigate the following:\n\n- How app and system processes are distributed across device cores and threads.\n- How smoothly the UI renders.\n- Power usage at both the device and app level.\n\nThis page provides an overview of the most commonly used visuals in the system\ntrace view. See the [chart glossary](/studio/profile/chart-glossary/flame-chart)\nfor more details about visualizations not described here. For more detailed\nexamples of what to use a system trace for, see the other pages in this section.\n\nAfter you [record a system trace](/studio/profile#start-profiling), you see the\nfollowing visualizations displayed over a timeline. You should focus on how\ndifferent system resources are correlated; for example, if you notice a spike in\nthe modem power rail, you should go to the threads section and see what thread\nactivity could be causing the spike at the time.\n\n- **CPU Usage**: Shows CPU usage of your app as a percentage of total available CPU capacity by time. Highlight a section of the timeline to filter to the details for that time period.\n- **Interactions** : Shows user interaction and app lifecycle events along a timeline (requires a [debuggable](/studio/profile#profileable-v-debuggable) app process and a device running API level 26 or higher).\n- **Display** : Shows info related to how smooth your app UI renders. Select **Lifecycle** to inspect how long it takes your app to render each frame on the main thread and `RenderThread`. This info is helpful for [investigating\n bottlenecks that cause UI jank and low\n framerates](/studio/profile/jank-detection).\n- **Threads** : Shows the threads that your app and various system processes run\n on. To learn about how to use system traces to investigate and help reduce UI\n jank, see [Detect UI jank](/studio/profile/jank-detection).\n\n **Tip:** When inspecting the **Threads** timeline, the following shortcuts are available:\n - **Zoom in:** Press \u003ckbd\u003eW\u003c/kbd\u003e or scroll the mouse wheel while holding \u003ckbd\u003eCtrl\u003c/kbd\u003e (\u003ckbd\u003eCommand\u003c/kbd\u003e on macOS).\n - **Zoom out:** Press \u003ckbd\u003eS\u003c/kbd\u003e or scroll the mouse wheel backward while holding \u003ckbd\u003eCtrl\u003c/kbd\u003e (\u003ckbd\u003eCommand\u003c/kbd\u003e on macOS).\n - **Pan left:** Press \u003ckbd\u003eA\u003c/kbd\u003e or drag mouse right while holding \u003ckbd\u003eSpace\u003c/kbd\u003e.\n - **Pan right:** Press \u003ckbd\u003eD\u003c/kbd\u003e or drag mouse left while holding \u003ckbd\u003eSpace\u003c/kbd\u003e.\n - **Expand or collapse a thread:** Double-click the thread name or press \u003ckbd\u003eEnter\u003c/kbd\u003e while a thread is selected.\n- **CPU cores** : Shows the activity on each core in your device. Viewing the\n activity by core might give you an idea of which ones are the [\"big\" or\n \"little\" cores](https://en.wikipedia.org/wiki/ARM_big.LITTLE) in\n modern mobile processors. Hold the pointer over a thread activity to\n see which thread this core is running on at that particular time.\n\n- **Process Memory (RSS)**: Shows the amount of physical memory currently in use\n by the app. For more details, see the chart glossary.\n\n- **Power Rails** : Appears when you profile on a physical device. For more info,\n see [Inspect power usage](/studio/profile/power-profiler).\n\n- **Battery**: Shows your app's battery usage."]]