
Android 會從應用程式產生影格並將其顯示在螢幕上以呈現 UI。如果應用程式的 UI 顯示速度緩慢,系統會強制略過影格。發生這種情況時,使用者會看到螢幕畫面不斷閃爍,這稱為「卡頓」。
發生卡頓的原因,通常是 UI 執行緒 (在多數應用程式中為主要執行緒) 的非同步呼叫處理速度減緩或遭到封鎖。您可以透過系統追蹤記錄找出問題。
在 Android 12 以上版本偵測卡頓
對於搭載 Android 12 (API 級別 31) 以上版本的裝置,CPU 分析器的「Display」窗格下方的「Janky frames」軌跡會顯示已擷取的追蹤記錄。
如何偵測卡頓:
在 Android Studio 中,依序選取「View」>「Tool Windows」>「Profiler」,或按一下工具列中的「Profile」
 。
。如果畫面上顯示「Select Deployment Target」對話方塊,請選擇要部署應用程式的裝置,以便進行剖析。如果您已透過 USB 連線裝置,但清單中未列出該裝置,請確認您已啟用 USB 偵錯。
按一下 CPU 時間軸中任一處,即可開啟 CPU 分析器。
在 CPU 分析器的設定選單中,選取「System Trace」,然後按一下「Record」。與應用程式完成互動後,按一下「Stop」。
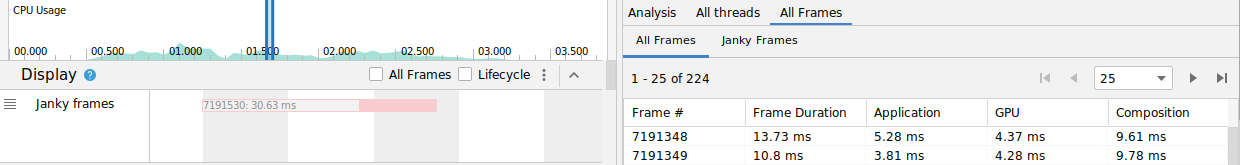
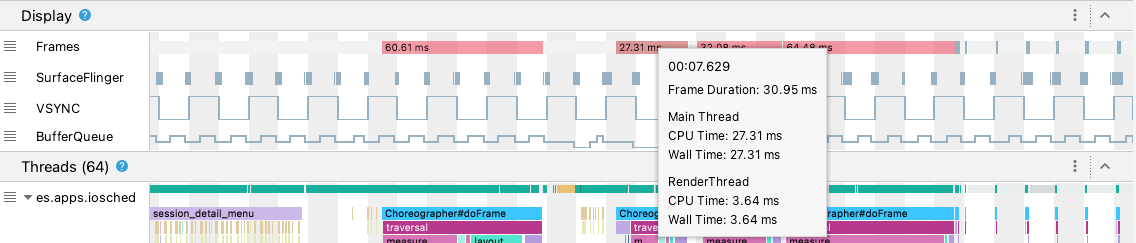
「Display」下方應該會顯示「Janky frames」軌跡。根據預設,分析器只會顯示需列為調查的卡頓影格。在每個卡頓的影格中,紅色部分會醒目顯示影格超過轉譯期限的時間區段。
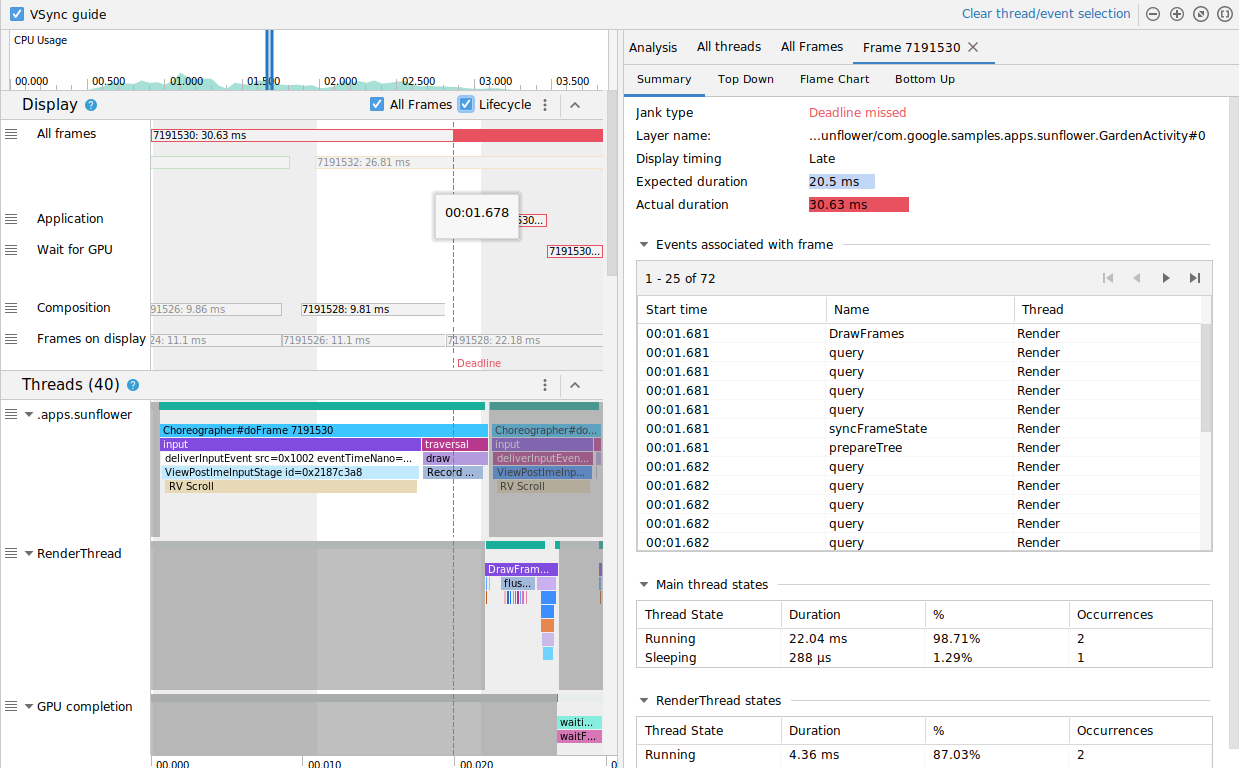
找到某個卡頓影格後,在上面按一下;或者,您也可以按下「M」來調整縮放,將焦點移至所選影格上。這些執行緒中的相關事件會醒目顯示:主執行緒、RenderThread 和 GPU 完成數。
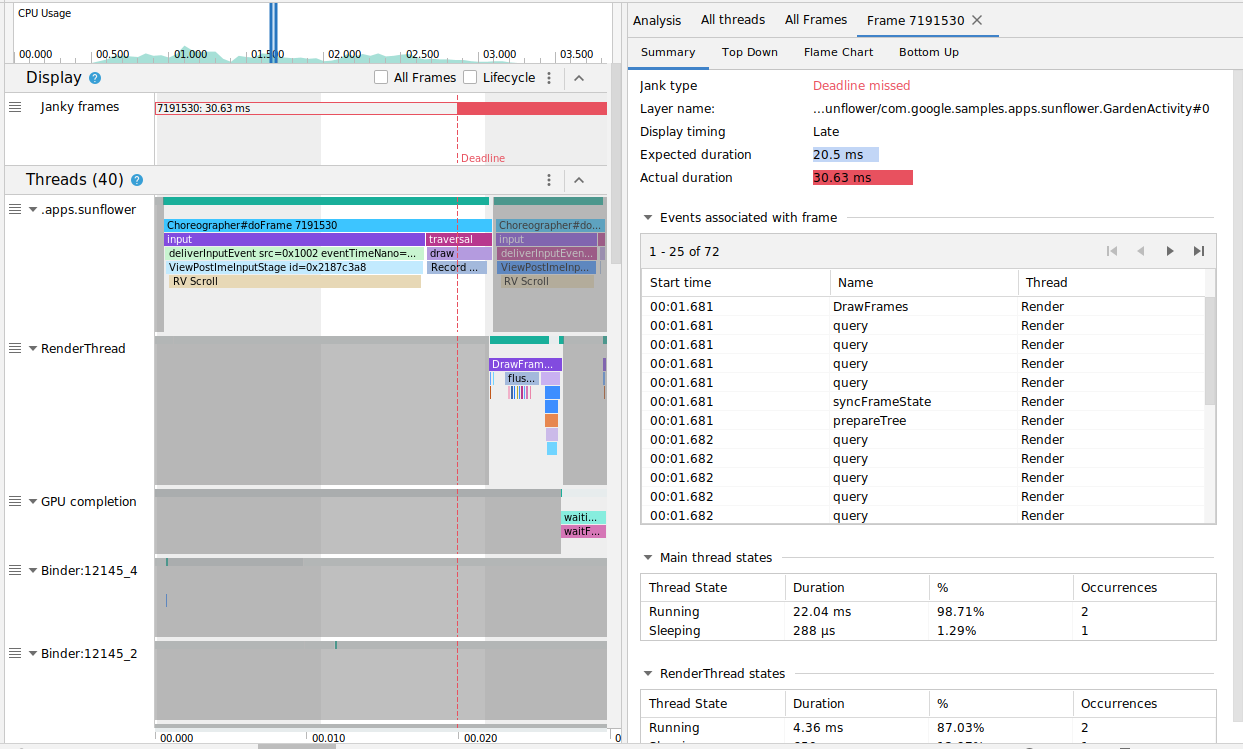
您可以選擇切換「All Frames」和「Lifecycle」核取方塊,分別查看所有影格或轉譯時間的詳細資訊。
在 Android 11 上偵測卡頓
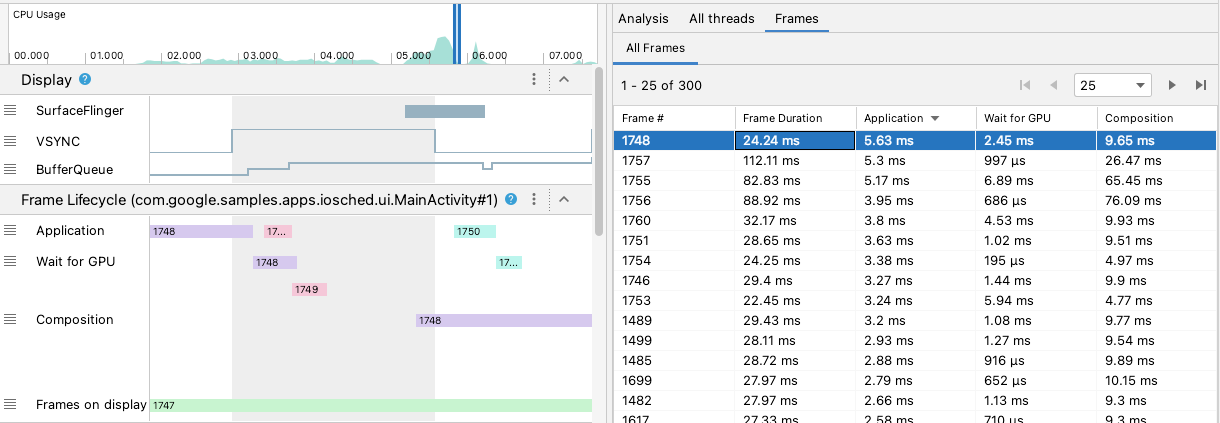
對於使用 Android 11 (API 級別 30) 的裝置,CPU 分析器的「Frame Lifecycle」區段會顯示已擷取的追蹤記錄。
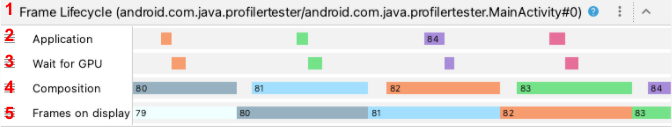
「Frame Lifecycle」區段包含圖層名稱和四個軌跡。每個軌跡都代表影格轉譯管道中的一個階段。「Frame Lifecycle」包含以下元素:
- Frame Lifecycle (Layer name):包含圖層名稱 (位於括弧中) 的區段標題。層級是單一的構成單位。
- Application:此軌跡顯示應用程式將緩衝區移出佇列到重新排入佇列的時段。這通常會對應至
RenderThread中的追蹤事件。 - Wait for GPU:這個軌跡顯示的是 GPU 擁有緩衝區的時間長度。此為從緩衝區發送到 GPU 至 GPU 完成其在緩衝區工作的時間。但這並不表示 GPU 在這段期間內只會在這個緩衝區中作業。如要進一步瞭解 GPU 在指定時間範圍內的運作方式,建議您使用 Android GPU 檢查器。
- Composition:這個軌跡顯示的是從 SurfaceFlinger 將緩衝區鎖存並傳送以供系統組合開始,到將緩衝區傳送至螢幕畫面的時間。
- Frames on Display:這個軌跡顯示了影格停留在畫面上的時間長度。
Frame Lifecycle:這個區段說明了影格緩衝區在算繪管道的不同階段間的移動方式。影格會依影格編號進行顏色編碼,方便您更容易追蹤特定的影格。
Android Studio 也會在「All Frames」分頁中以表格格式顯示追蹤記錄中的所有影格。
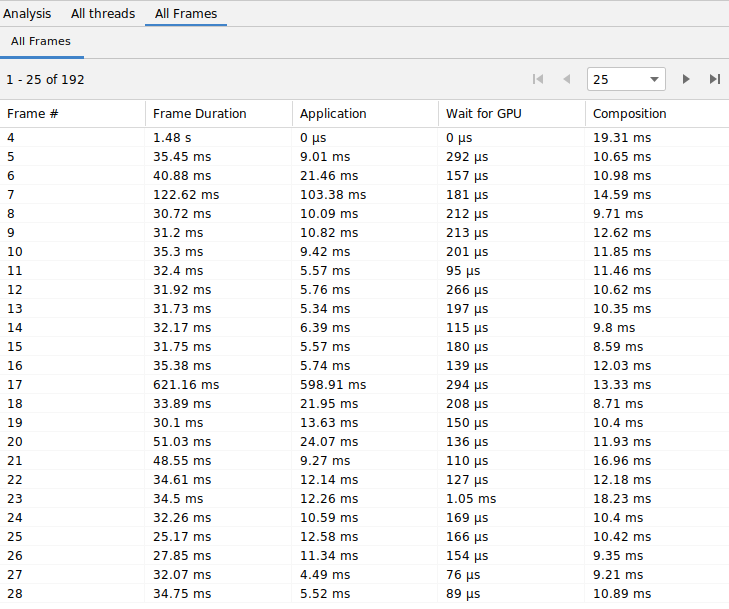
「Frame #」、「Application」、「Wait for GPU」和「Composition」資料欄代表的資料與「Frame Lifecycle」區段內的軌跡資料相同。「Frame Duration」資料欄代表從「Application」開始到「Frames on Display」開始的時間。這本質上是端到端顯示影格所需的時間。
您可以按照任何資料欄排序影格表格,以快速找到最短或最長的影格。表格也支援分頁控制選項,可協助您瀏覽數百個影格。
如要在 Android 11 上偵測及調查卡頓,請按照下列步驟操作:
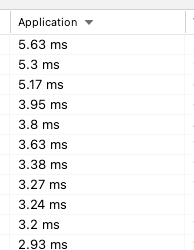
按照「Application」欄對「All Frames」表格進行遞減排序,將最耗時的影格優先顯示。
查看最長的執行時間,然後選取表格列。這會在左側時間軸檢視畫面中放大所選影格。
在「Frame Lifecycle」和「Threads」區段中尋找相關的執行緒。
在 Android 10 以下版本偵測卡頓
對於搭載 Android 10 (API 級別 29) 以下版本的裝置,相關的 OS 圖形管道資訊會顯示在 CPU 分析器系統追蹤記錄的單一區段內,該部分稱為「Display」。
- 影格:本節顯示應用程式中的 UI 執行緒和
RenderThread追蹤記錄事件。超過 16 毫秒的事件會呈紅色,以醒目顯示潛在卡頓影格,因為其已超過顯示 60 個每秒影格數 (fps) 的期限。 - SurfaceFlinger:這個區段顯示的是 SurfaceFlinger 處理畫格緩衝區的時間。SurfaceFlinger 是一種系統處理程序,用來傳送要顯示的緩衝。
- 「VSYNC」:本節顯示 VSYNC,這是同步處理顯示管道的信號。這個軌跡會顯示 VSYNC-app 信號,在應用程式啟動太晚時顯示。原因通常是因為 UI 執行緒處於忙碌狀態。當您使用動畫功能時,螢幕會有可見的閃爍畫面,並在動畫或捲動完成前加上額外輸入延遲時間。由於顯示頻率可能會超過每秒 60 次,或以可變速率顯示,因此這對於查看高刷新率的螢幕尤其重要。
- BufferQueue:這個部分顯示有多少影格已排入緩衝區,正在等待 SurfaceFlinger 使用。如果應用程式已部署至搭載 Android 9 (API 級別 28) 以上版本的裝置,這個測試群組會顯示應用程式途徑 BufferQueue (
0、1或2) 的緩衝區數量。BufferQueue 可協助您瞭解圖片緩衝區在 Android 圖形元件間移動時的狀態。例如,2表示應用程式目前處於三重緩衝處理,造成額外的輸入延遲時間。
「Display」部分會提供實用的信號來偵測潛在的卡頓情形,例如 UI 執行緒或 RenderThread 耗時超過 16 ms 時。如要調查導致卡頓的具體詳細資料,可以查看「Threads」區段,其中顯示與 UI 算繪作業相關的執行緒。
上圖中,「Threads」區段顯示了 UI 執行緒 (java.com.google.samples.apps.iosched)、RenderThread 和 GPU completion 執行緒。這些是與 UI 顯示相關的執行緒,可能會導致卡頓。
如要在 Android 10 以下版本中偵測卡頓,請按照下列步驟操作:
查看「Display」中的「Frames」軌跡。紅框是調查的候選項。
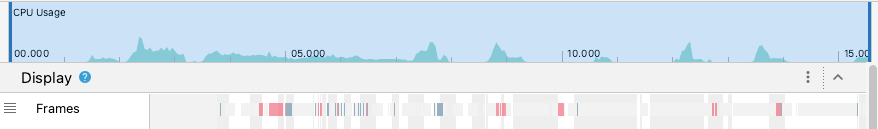
找到可能卡頓的影格時,請按下
W鍵,或按住 Control 鍵 (macOS 為 Command 鍵) 並捲動滑鼠滾輪來放大畫面。繼續放大,直到開始在 UI 執行緒和RenderThread中看到追蹤事件為止。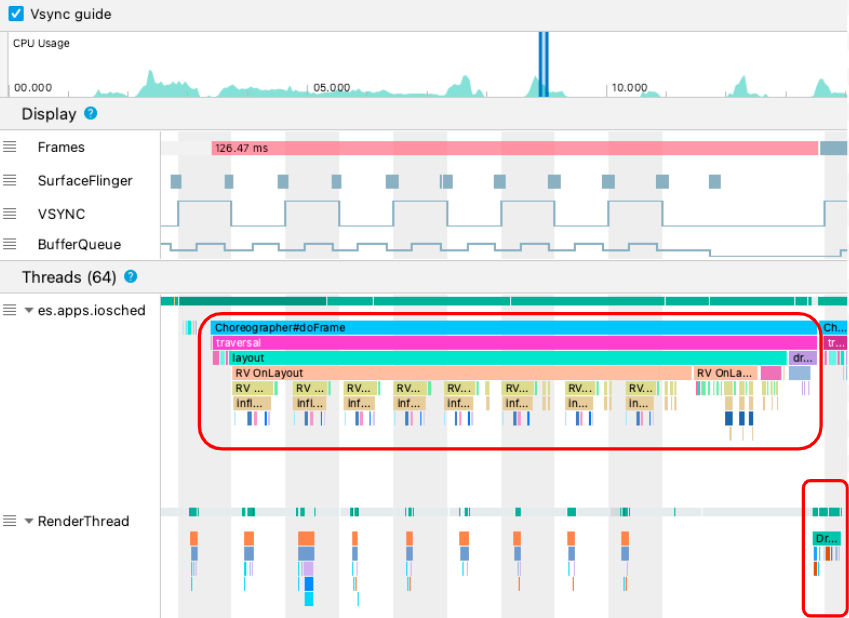
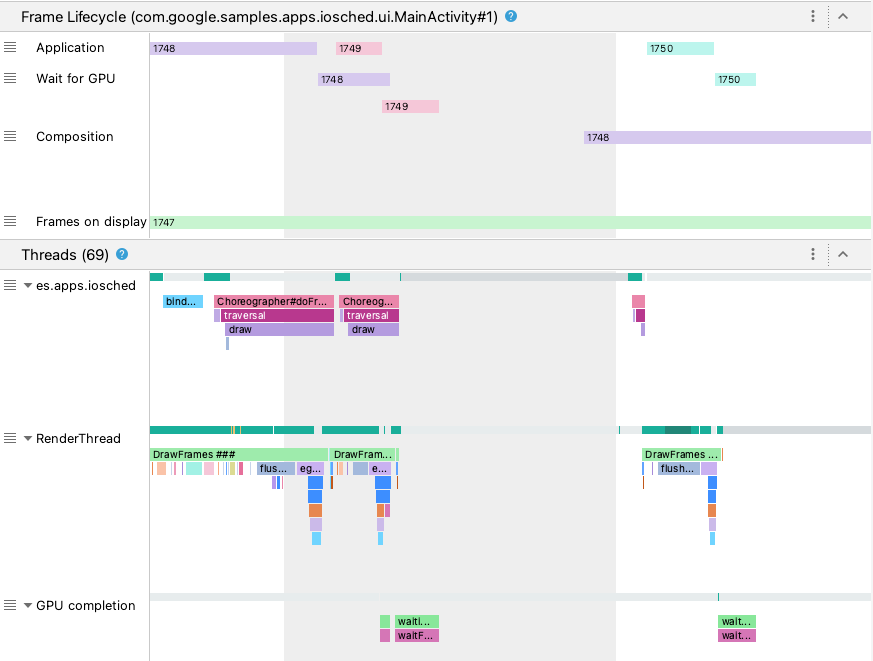
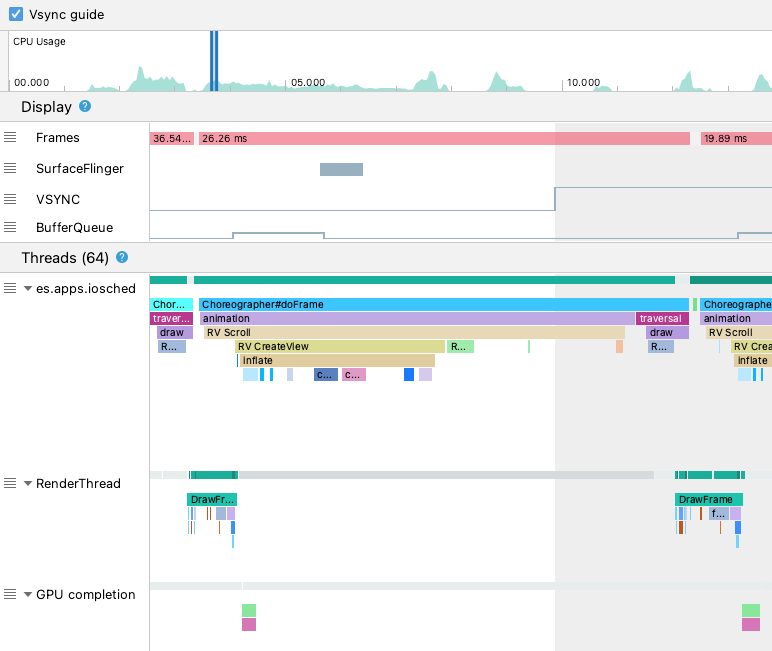
在上圖中,UI 執行緒呼叫
Choreographer以協調動畫、檢視版面配置、圖片繪圖及相關程序時,會顯示Choreographer#doFrame。RenderThread組成並發出對 GPU 的實際繪圖指令時,會顯示DrawFrames。如果您看到特別長的追蹤記錄事件,可以進一步縮小,找出導致顯示速度變慢的原因。上圖顯示了 UI 執行緒中的
inflate,這表示應用程式正在耗時加載版面配置。當您放大其中一個inflate事件時,您可準確瞭解每個 UI 元件花費的時間,如下圖所示。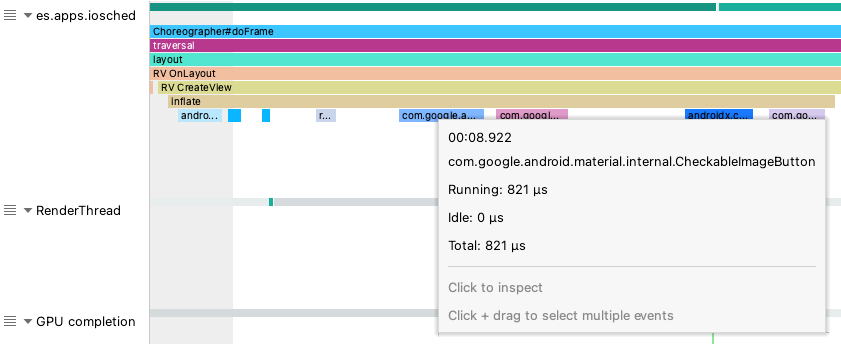
瞭解詳情
如要進一步瞭解如何減少卡頓,請參閱「卡頓的常見來源」。