火焰圖
透過集合功能整理內容
你可以依據偏好儲存及分類內容。
「Flame Chart」分頁會提供反轉的呼叫圖,以聚合相同的呼叫堆疊。也就是說,共享相同呼叫者順序的相同方法或函式會被收集起來,並在火焰圖中以一個長條表示(而非如同呼叫圖的多個短條)。如此一來,您就能更輕鬆地查看哪些方法或函式花費的時間最多。但這也表示水平軸並不代表時間軸,而是會指出每個方法或函式執行所需的相對時間。
建議您查看圖 1 的呼叫圖,來瞭解這個概念。請注意,方法 D 向 B 發出多次呼叫 (B1、B2 和 B3),以及部分 D 對 B 發出的呼叫都會呼叫 C (C1 和 C3)。
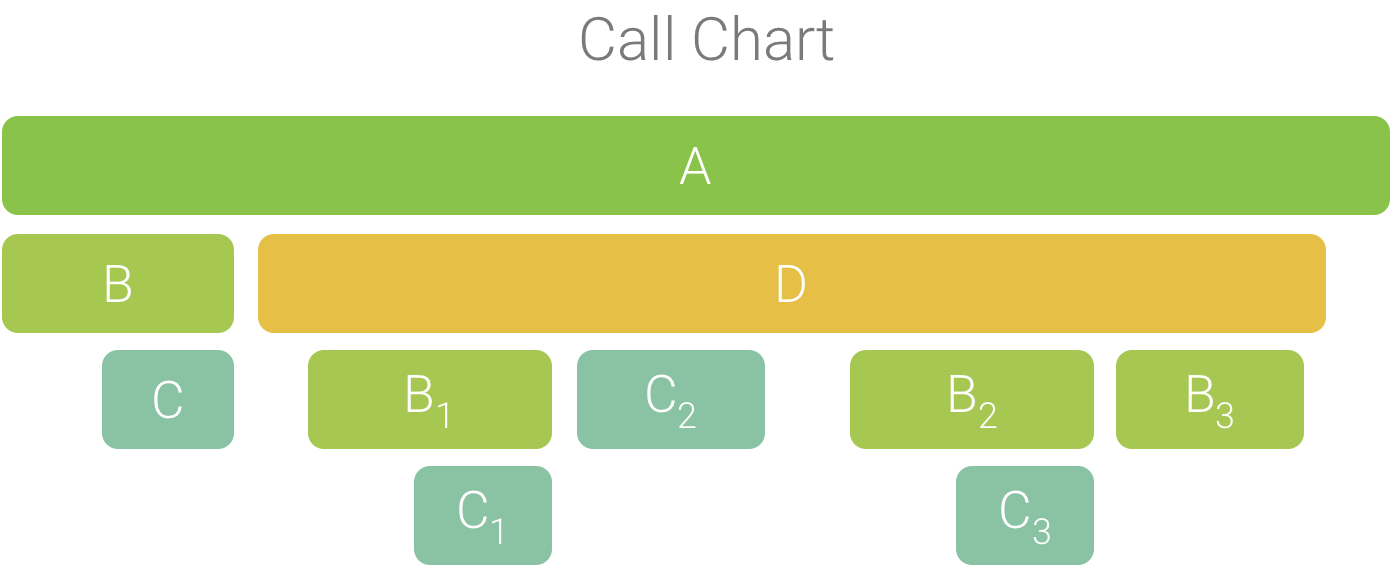
圖 1. 具多個方法呼叫的呼叫圖,這些方法共享一個常見的呼叫端序列。
因為 B1、B2 和 B3 會共用相同的呼叫端序列 (A → D → B),如圖 2 所示。同樣地,C1 和 C3 也會累加在一起,因爲共用相同的呼叫端序列 (A → D → B → C);請留意到 C2 包含不同的呼叫端順序 (A → D → C),因此未包含在內。
圖 2. 聚合共用相同呼叫堆疊的相同方法。
使用聚合呼叫建立火焰圖,如圖 3 所示。請注意,對於火焰圖中的特定呼叫,會優先佔用最多 CPU 作業時間的呼叫端。
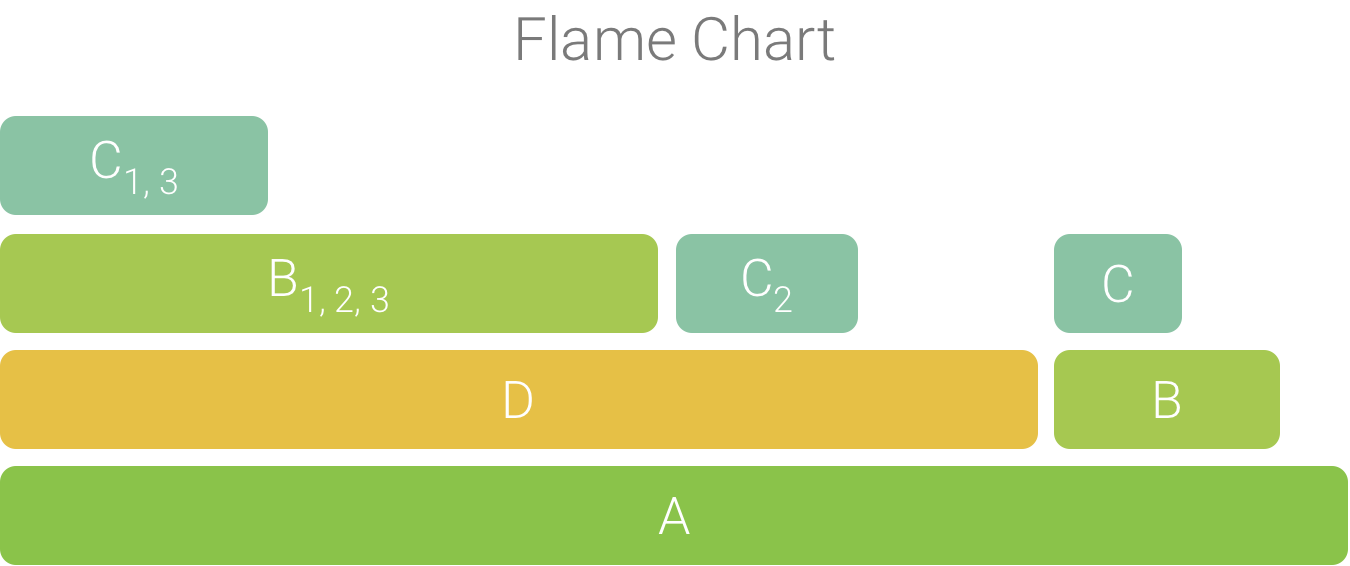
圖 3. 圖 5 中呼叫圖的火焰示意圖。
這個頁面中的內容和程式碼範例均受《內容授權》中的授權所規範。Java 與 OpenJDK 是 Oracle 和/或其關係企業的商標或註冊商標。
上次更新時間:2025-07-27 (世界標準時間)。
[[["容易理解","easyToUnderstand","thumb-up"],["確實解決了我的問題","solvedMyProblem","thumb-up"],["其他","otherUp","thumb-up"]],[["缺少我需要的資訊","missingTheInformationINeed","thumb-down"],["過於複雜/步驟過多","tooComplicatedTooManySteps","thumb-down"],["過時","outOfDate","thumb-down"],["翻譯問題","translationIssue","thumb-down"],["示例/程式碼問題","samplesCodeIssue","thumb-down"],["其他","otherDown","thumb-down"]],["上次更新時間:2025-07-27 (世界標準時間)。"],[],[],null,["# Flame chart\n\nThe **Flame Chart** tab provides an inverted call chart that aggregates\nidentical call stacks. That is, identical methods or functions that share the\nsame sequence of callers are collected and represented as one longer bar in a\nflame chart (rather than displaying them as multiple shorter bars, as shown in a\ncall chart). This makes it easier to see which methods or functions consume the\nmost time. However, this also means that the horizontal axis doesn't represent a\ntimeline; instead, it indicates the relative amount of time each method or\nfunction takes to execute.\n\nTo help illustrate this concept, consider the call chart in Figure 1. Note\nthat method D makes multiple calls to B (B~1~, B~2~, and\nB~3~), and some of those calls to B make a call to C (C~1~ and\nC~3~).\n\n\n**Figure 1.** A call chart with multiple method calls\nthat share a common sequence of callers.\n\n\u003cbr /\u003e\n\nBecause B~1~, B~2~, and B~3~ share the same sequence\nof callers (A → D → B) they are aggregated, as shown in Figure 2. Similarly,\nC~1~ and C~3~ are aggregated because they share the same\nsequence of callers (A → D → B → C); note that C~2~ is not included\nbecause it has a different sequence of callers (A → D → C).\n\n\n**Figure 2.** Aggregating identical methods that share\nthe same call stack.\n\n\u003cbr /\u003e\n\nThe aggregated calls are used to create the flame chart, as shown in Figure 3.\nNote that, for any given call in a flame chart, the callees that consume the\nmost CPU time appear first.\n\n\n**Figure 3.** A flame chart representation of the call\nchart shown in figure 5.\n\n\u003cbr /\u003e"]]