トップダウン チャートとボトムアップ グラフ
コレクションでコンテンツを整理
必要に応じて、コンテンツの保存と分類を行います。
[Top Down] タブには呼び出しの一覧が表示され、メソッドノードまたは関数ノードを展開すると呼び出し先が表示されます。図 2 は、次の呼び出しチャートのトップダウン グラフを示しています。グラフ内の各矢印は、呼び出し元から呼び出し先を指しています。
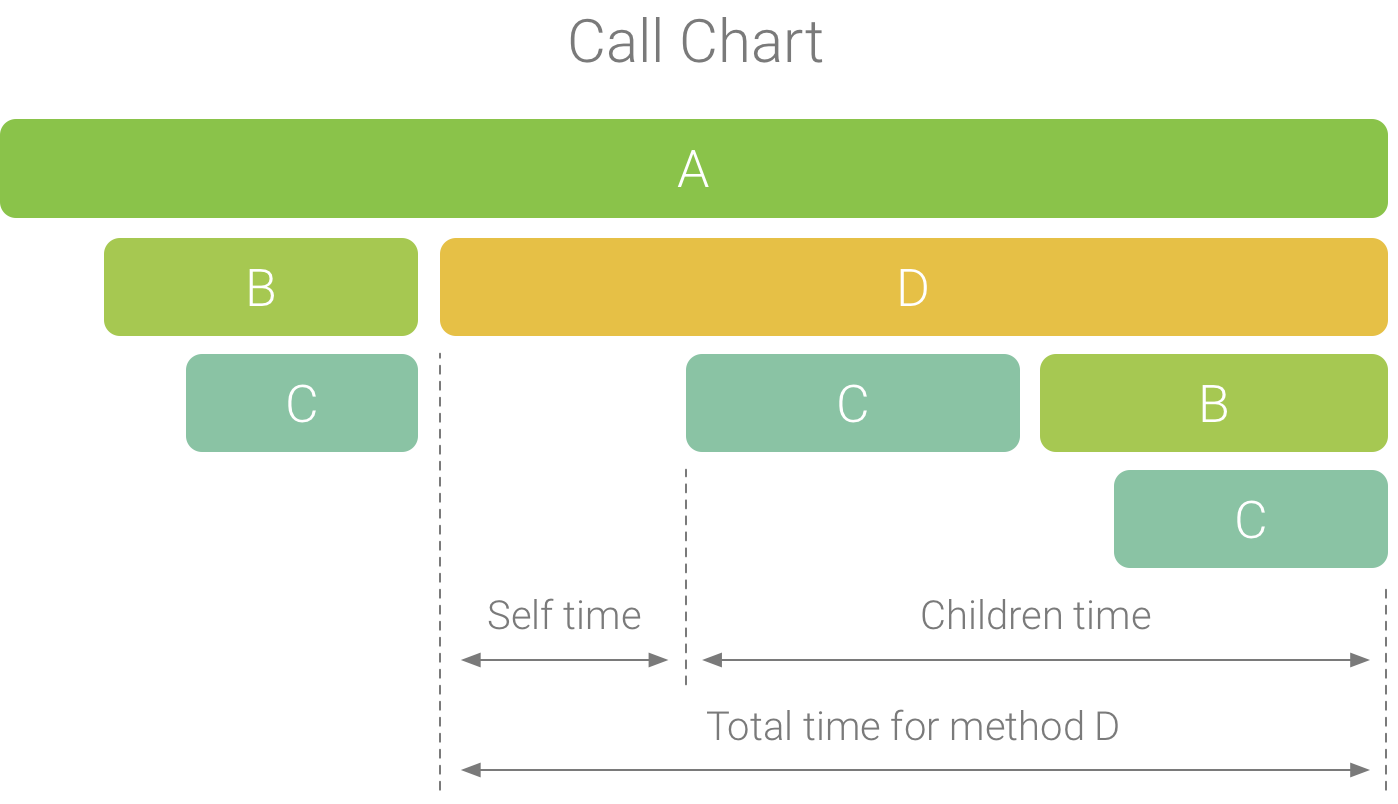
図 1. セルフ時間、子時間、メソッド D の合計時間を示した呼び出しチャートの例。
図 2 に示すように、[Top Down] タブでメソッド A のノードを展開すると、その呼び出し先であるメソッド B とメソッド D が表示されます。さらに、メソッド D のノードを展開すると、その呼び出し先であるメソッド B とメソッド C などが表示されます。[Flame Chart] タブの場合と同じように、トップダウン ツリーでは同じコールスタックを共有している同一のメソッドのトレース情報が集約されます。つまり、[Flame Chart] タブの表示は [Top Down] タブをグラフィックで表示したものです。
[Top Down] タブには、各呼び出しに費やされた CPU 時間の把握に役立つ次の情報が表示されます(時間は、選択した範囲にあるスレッドの合計時間の割合としても表されます)。
- Self: 図 1 のメソッド D が示すように、メソッドまたは関数の呼び出しが自身のコードの実行に費やした時間であり、呼び出し先の実行に費やした時間ではありません。
- Children: 図 1 のメソッド D が示すように、メソッドまたは関数呼び出しがその呼び出し先の実行に費やした時間であり、自身のコードの実行に費やした時間ではありません。
- Total: メソッドの Self 時間と Children 時間の合計です。図 1 のメソッド D が示すように、アプリがメソッド呼び出しの実行に費やした合計時間を表します。
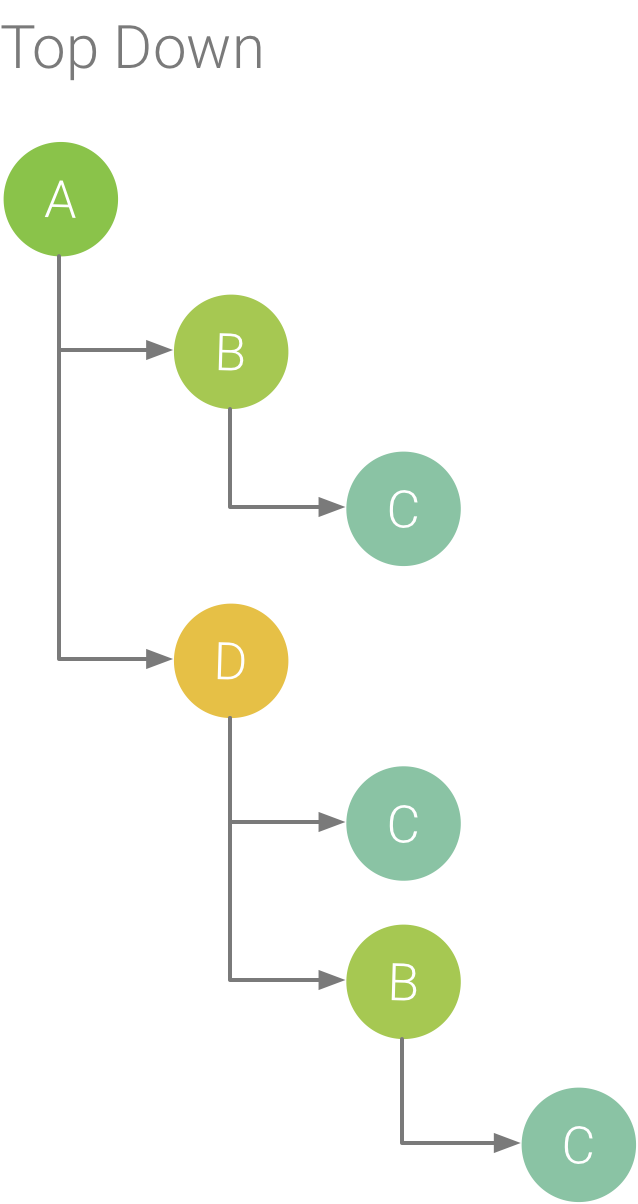
図 2. トップダウン ツリー。
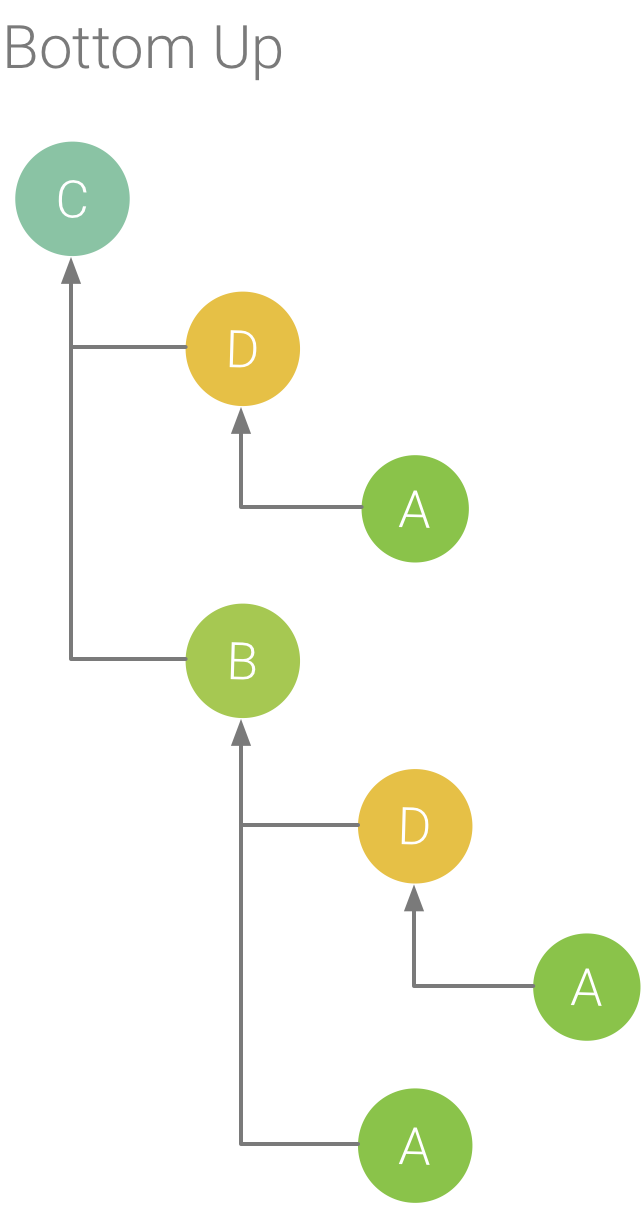
図 3. 図 5 のメソッド C のボトムアップ ツリー
[Bottom Up] タブには、呼び出しの一覧が表示され、メソッドまたは関数のノードを展開するとその呼び出し元が表示されます。図 3 では、図 2 で示すトレース例を使用してメソッド C のボトムアップ ツリーを示しています。ボトムアップ ツリーでメソッド C のノードを開くと、その一意の各呼び出し元であるメソッド B とメソッド D が表示されます。メソッド B はメソッド C を 2 回呼び出しますが、ボトムアップ ツリーでメソッド C のノードを展開すると、メソッド B が 1 つだけ表示されることに注意してください。さらに、メソッド B のノードを展開すると、その呼び出し元であるメソッド A とメソッド D が表示されます。
[Bottom Up] タブは、メソッドまたは関数を最も多くの(または最も少ない)CPU 時間を消費したスレッド順に並べ替える際に便利です。各ノードを調べると、これらのメソッドまたは関数を呼び出すときに最も多くの CPU 時間を消費した呼び出し元を特定できます。トップダウン ツリーとは異なり、ボトムアップ ツリーの各メソッドまたは関数の計時情報は、各ツリーの最上部のメソッド(トップノード)に関連しています。CPU 時間は、記録中のスレッドの合計時間の割合としても表されます。次の表は、トップノードとその呼び出し元(サブノード)の計時情報を解釈する方法を理解するために役立ちます。
|
Self |
Children |
Total |
ボトムアップ ツリーの最上位のメソッドまたは関数(トップノード) |
メソッドまたは関数がその呼び出し先ではなく自身のコードの実行に費やした合計時間。トップダウン ツリーとは異なり、この計時情報は、記録中におけるメソッドまたは関数へのすべての呼び出しの合計時間を表しています。
|
メソッドまたは関数が自身のコードではなくその呼び出し先の実行に費やした合計時間。トップダウン ツリーとは異なり、この計時情報は、記録中におけるメソッドまたは関数の呼び出し先へのすべての呼び出しの合計時間を表しています。
|
セルフ時間と子時間の合計。
|
呼び出し元(サブノード) |
呼び出し元から呼び出されたときの呼び出し先のセルフ時間の合計。図 6 のボトムアップ ツリーを例として説明すると、メソッド B のセルフ時間は、メソッド B から呼び出されるたびに実行されるメソッド C のセルフ時間の合計に等しくなります。 |
呼び出し元から呼び出されたときの呼び出し先の子時間の合計。図 6 のボトムアップ ツリーを例として説明すると、メソッド B の子時間は、メソッド B から呼び出されるたびに実行されるメソッド C の子時間の合計に等しくなります。
|
セルフ時間と子時間の合計。
|
注: Android Studio は、特定の記録中にプロファイラがファイルサイズの制限に達すると、新しいデータの収集を停止します(ただし、記録は停止しません)。通常、インストルメント化されたトレースを実行すると、データの収集がより早く停止します。このタイプのトレースでは、サンプリング ベースのトレースよりも短い時間でより多くのデータを収集するからです。インスペクション タイムフレームを制限への到達後に発生した記録期間に拡張した場合、トレースペインのタイミング データは変化しません(新しいデータが利用できないため)。また、データが利用できない記録の部分のみを選択すると、トレースペインには計時情報として NaN が表示されます。
このページのコンテンツやコードサンプルは、コンテンツ ライセンスに記載のライセンスに従います。Java および OpenJDK は Oracle および関連会社の商標または登録商標です。
最終更新日 2025-07-27 UTC。
[[["わかりやすい","easyToUnderstand","thumb-up"],["問題の解決に役立った","solvedMyProblem","thumb-up"],["その他","otherUp","thumb-up"]],[["必要な情報がない","missingTheInformationINeed","thumb-down"],["複雑すぎる / 手順が多すぎる","tooComplicatedTooManySteps","thumb-down"],["最新ではない","outOfDate","thumb-down"],["翻訳に関する問題","translationIssue","thumb-down"],["サンプル / コードに問題がある","samplesCodeIssue","thumb-down"],["その他","otherDown","thumb-down"]],["最終更新日 2025-07-27 UTC。"],[],[],null,["# Top down and bottom up charts\n\nThe **Top Down** tab displays a list of calls in which expanding a method or\nfunction node displays its callees. Figure 2 shows a top down graph for the\nfollowing call chart. Each arrow in the graph points from a caller to a callee.\n\n\n**Figure 1.** An example call chart that illustrates\nself, children, and total time for method D.\n\n\u003cbr /\u003e\n\nAs shown in Figure 2, expanding the node for method A in the **Top Down** tab\ndisplays its callees, methods B and D. After that, expanding the node for method\nD exposes its callees, such as methods B and C. Similar to the\n[**Flame chart**](/studio/profile/chart-glossary/flame-chart) tab, the top down\ntree aggregates trace information for identical methods that share the same call\nstack. That is, the **Flame chart** tab provides a graphical representation of\nthe **Top Down** tab.\n\nThe **Top Down** tab provides the following information to help describe CPU\ntime spent on each call (times are also represented as a percentage of the\nthread's total time over the selected range):\n\n- **Self:** the time the method or function call spent executing its own code and not that of its callees, as illustrated in Figure 1 for method D.\n- **Children:** the time the method or function call spent executing its callees and not its own code, as illustrated in Figure 1 for method D.\n- **Total:** the sum of the method's **Self** and **Children** time. This represents the total time the app spent executing a call, as illustrated in Figure 1 for method D.\n\n**Figure 2.** A Top Down tree.\n\n\u003cbr /\u003e\n\n**Figure 3.** A Bottom Up tree for method C from\nFigure 5.\n\n\u003cbr /\u003e\n\nThe **Bottom Up** tab displays a list of calls in which expanding a function or\nmethod's node displays its callers. Using the example trace shown in Figure 2,\nfigure 3 provides a bottom up tree for method C. Opening the node for method C\nin the bottom up tree displays each of its unique callers, methods B and D. Note\nthat, although B calls C twice, B appears only once when expanding the node for\nmethod C in the bottom up tree. After that, expanding the node for B displays\nits caller, methods A and D.\n\nThe **Bottom Up** tab is useful for sorting methods or functions by those that\nconsume the most (or least) CPU time. You can inspect each node to determine\nwhich callers spend the most CPU time invoking those methods or functions.\nCompared to the top down tree, timing info for each method or function in a\nbottom up tree is in reference to the method at the top of each tree (top node).\nCPU time is also represented as a percentage of the thread's total time during\nthat recording. The following table helps explain how to interpret timing\ninformation for the top node and its callers (sub-nodes).\n\n| | Self | Children | Total |\n| Method or function at the top of the bottom up tree (top node) | Represents the total time the method or function spent executing its own code and not that of its callees. Compared to the top down tree, this timing information represents a sum of all calls to this method or function over the duration of the recording. | Represents the total time the method or function spent executing its callees and not its own code. Compared to the top down tree, this timing information represents the sum of all calls to this method or function's callees over the duration of the recording. | The sum of the self time and children time. |\n| Callers (sub-nodes) | Represents the total self time of the callee when being called by the caller. Using the bottom up tree in Figure 6 as an example, the self time for method B would equal the sum of the self times for each execution of method C when called by B. | Represents the total children time of the callee when being invoked by the caller. Using the bottom up tree in Figure 6 as an example, the children time for method B would equal the sum of the children times for each execution of method C when called by B. | The sum of the self time and children time. |\n|----------------------------------------------------------------|----------------------------------------------------------------------------------------------------------------------------------------------------------------------------------------------------------------------------------------------------------------|--------------------------------------------------------------------------------------------------------------------------------------------------------------------------------------------------------------------------------------------------------------------|---------------------------------------------|\n\n\n**Note:** For a given recording, Android Studio stops collecting new data\nwhen the profiler reaches the file size limit (however, this does not stop the\nrecording). This typically happens much more quickly when performing\ninstrumented traces because this type of tracing collects more data in a shorter\ntime, compared to a sampled trace. If you extend the inspection time into a\nperiod of the recording that occurred after reaching the limit, timing data in\nthe trace pane does not change (because no new data is available). Additionally,\nthe trace pane displays **NaN** for timing information when you select only\nthe portion of a recording that has no data available."]]