Android 스튜디오에서 Compose UI를 디버깅하는 도구를 사용할 수 있습니다.
Layout Inspector
Layout Inspector를 사용하면 에뮬레이터나 실제 기기에서 실행 중인 앱 내의 Compose 레이아웃을 검사할 수 있습니다. Layout Inspector를 사용하여 컴포저블이 얼마나 자주 재구성되거나 건너뛰는지 확인하고, 이를 통해 앱의 문제를 파악할 수 있습니다. 예를 들어 일부 코딩 오류로 인해 UI가 과도하게 재구성될 수 있으며 이는 성능 저하를 야기할 수 있습니다. 일부 코딩 오류로 인해 UI가 재구성되지 않아 UI 변경사항이 화면에 표시되지 않을 수도 있습니다. 레이아웃 검사기를 처음 사용하는 경우 실행 방법에 관한 안내를 확인하세요.
재구성 횟수 가져오기
Compose 레이아웃을 디버깅할 때는 컴포저블이 재구성되는 시점을 아는 것이 UI가 올바르게 구현되었는지 이해하는 데 중요합니다. 예를 들어 너무 많이 재구성되는 경우 앱이 필요한 것보다 더 많은 작업을 실행하는 것일 수 있습니다. 반면에 예상대로 재구성되지 않는 구성요소는 예기치 않은 동작을 유발할 수 있습니다.
Layout Inspector는 개발자가 앱과 상호작용할 때 레이아웃 계층 구조의 개별 컴포저블이 재구성되거나 건너뛴 시점을 보여줍니다. Android 스튜디오에서는 재구성이 강조 표시되어 UI에서 컴포저블이 재구성되는 위치를 확인할 수 있습니다.
그림 1. Layout Inspector에서 강조 표시된 재구성
강조 표시된 부분은 Layout Inspector의 이미지 섹션에 있는 컴포저블의 그래디언트 오버레이를 표시하며, UI에서 재구성이 가장 많은 컴포저블을 찾을 수 있는 위치를 파악할 수 있도록 점진적으로 사라집니다. 한 컴포저블이 다른 컴포저블보다 더 높은 속도로 재구성되는 경우 첫 번째 컴포저블은 더 강한 그래디언트 오버레이 색상을 수신합니다. Layout Inspector에서 컴포저블을 더블클릭하면 분석에 맞는 대응 코드로 이동합니다.
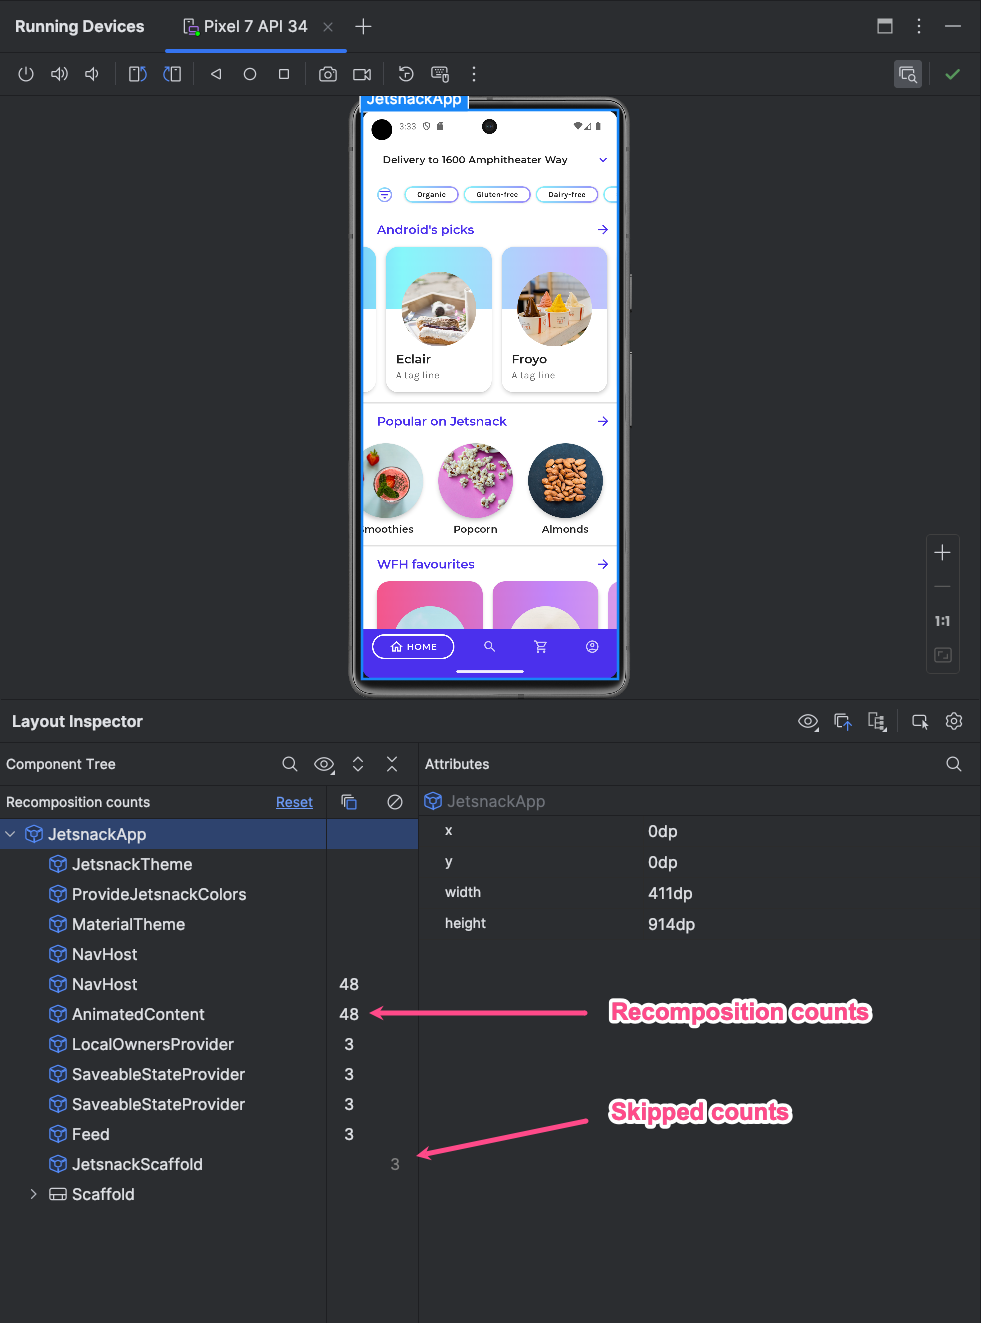
Layout Inspector 창을 열고 앱 프로세스에 연결합니다. Component Tree에는 레이아웃 계층 구조 옆에 표시되는 열이 두 개 있습니다. 첫 번째 열에는 각 노드의 컴포지션 수가 표시되고 두 번째 열에는 각 노드의 건너뛰기 수가 표시됩니다. 컴포저블 노드를 선택하면 컴포저블의 크기와 매개변수가 표시됩니다. 단, 인라인 함수가 아닌 경우 매개변수를 표시할 수 없습니다. Component Tree 또는 Layout Display에서 컴포저블을 선택하면 Attributes 창에서도 비슷한 정보를 확인할 수 있습니다.
개수를 재설정하면 앱과의 특정 상호작용 중에 재구성이나 건너뛰기를 이해하는 데 도움이 됩니다. 개수를 재설정하려면 Component Tree 창 상단의 Reset을 클릭하세요.
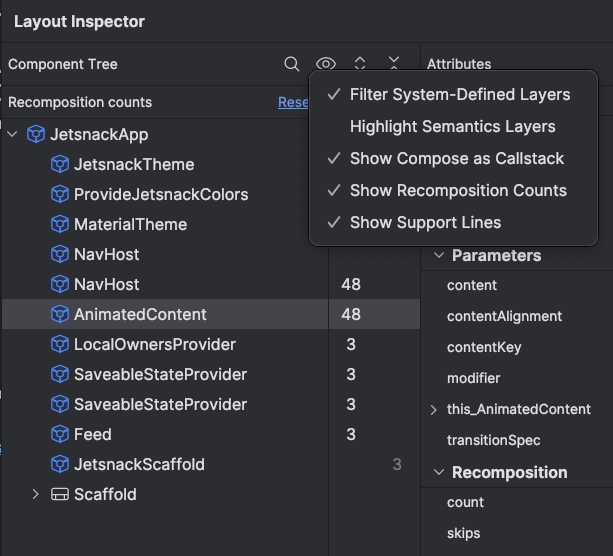
그림 3. Layout Inspector에서 컴포지션 및 건너뛰기 카운터 사용 설정
Compose 시맨틱
Compose의 시맨틱은 접근성 서비스와 테스트 프레임워크에서 이해할 수 있는 대체 방식으로 UI를 설명합니다. Layout Inspector를 사용하여 Compose 레이아웃의 시맨틱 정보를 검사할 수 있습니다.
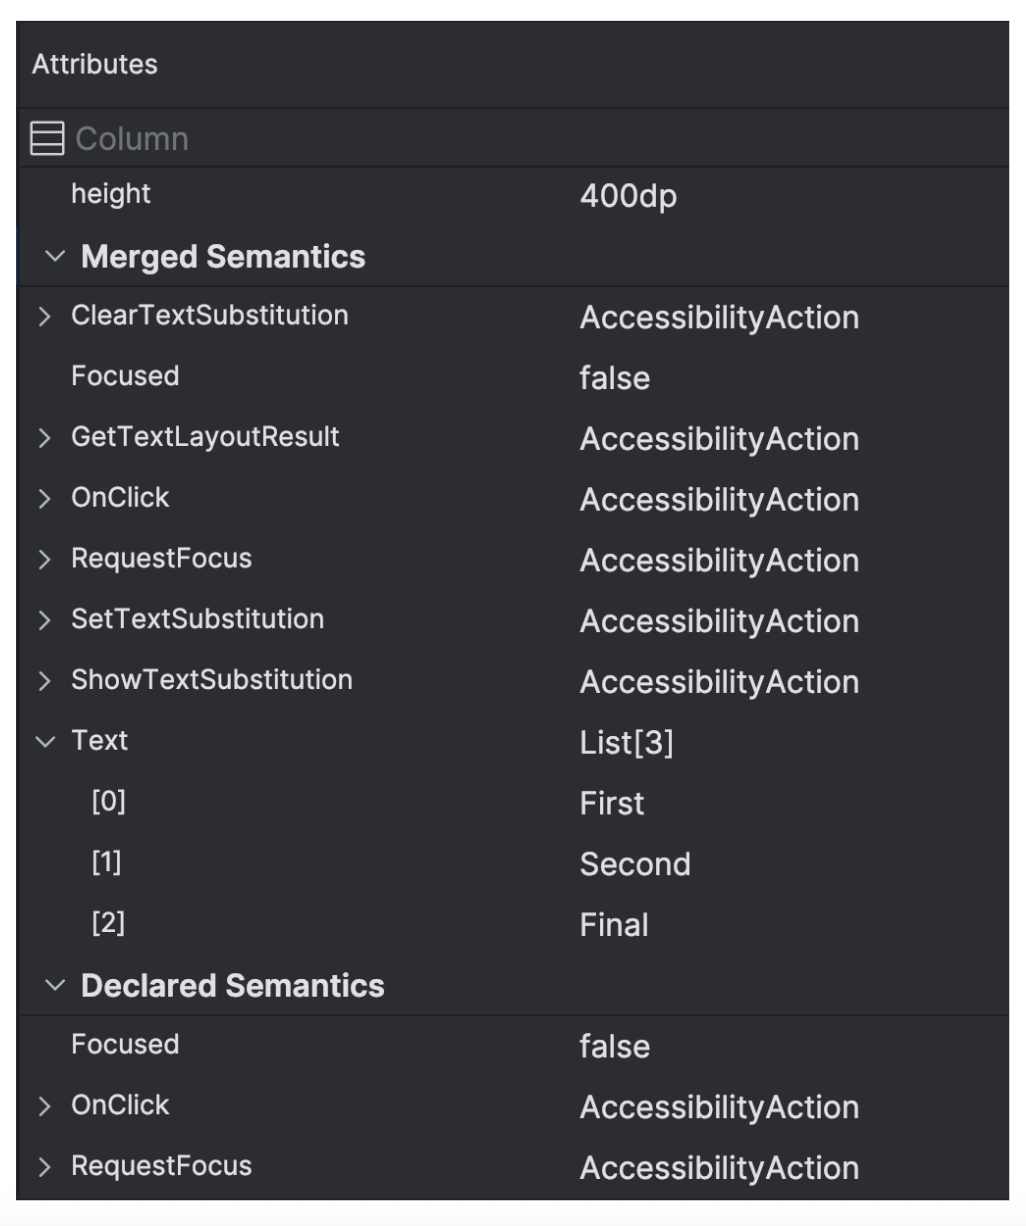
Compose 노드를 선택할 때 Attributes 창을 사용하면 Compose 노드가 시맨틱 정보를 직접 선언하는지 아니면 하위 요소에서 시맨틱을 병합하는지 또는 둘 다 실행하는지 확인할 수 있습니다. 선언되었거나 병합된 시맨틱을 포함하는 노드를 빠르게 식별하려면 Component Tree 창에서 View options 드롭다운을 선택하고 Highlight Semantics Layers를 선택합니다. 그러면 트리에서 시맨틱이 포함된 노드만 강조표시됩니다. 키보드를 사용하여 노드 간에 빠르게 이동할 수 있습니다.
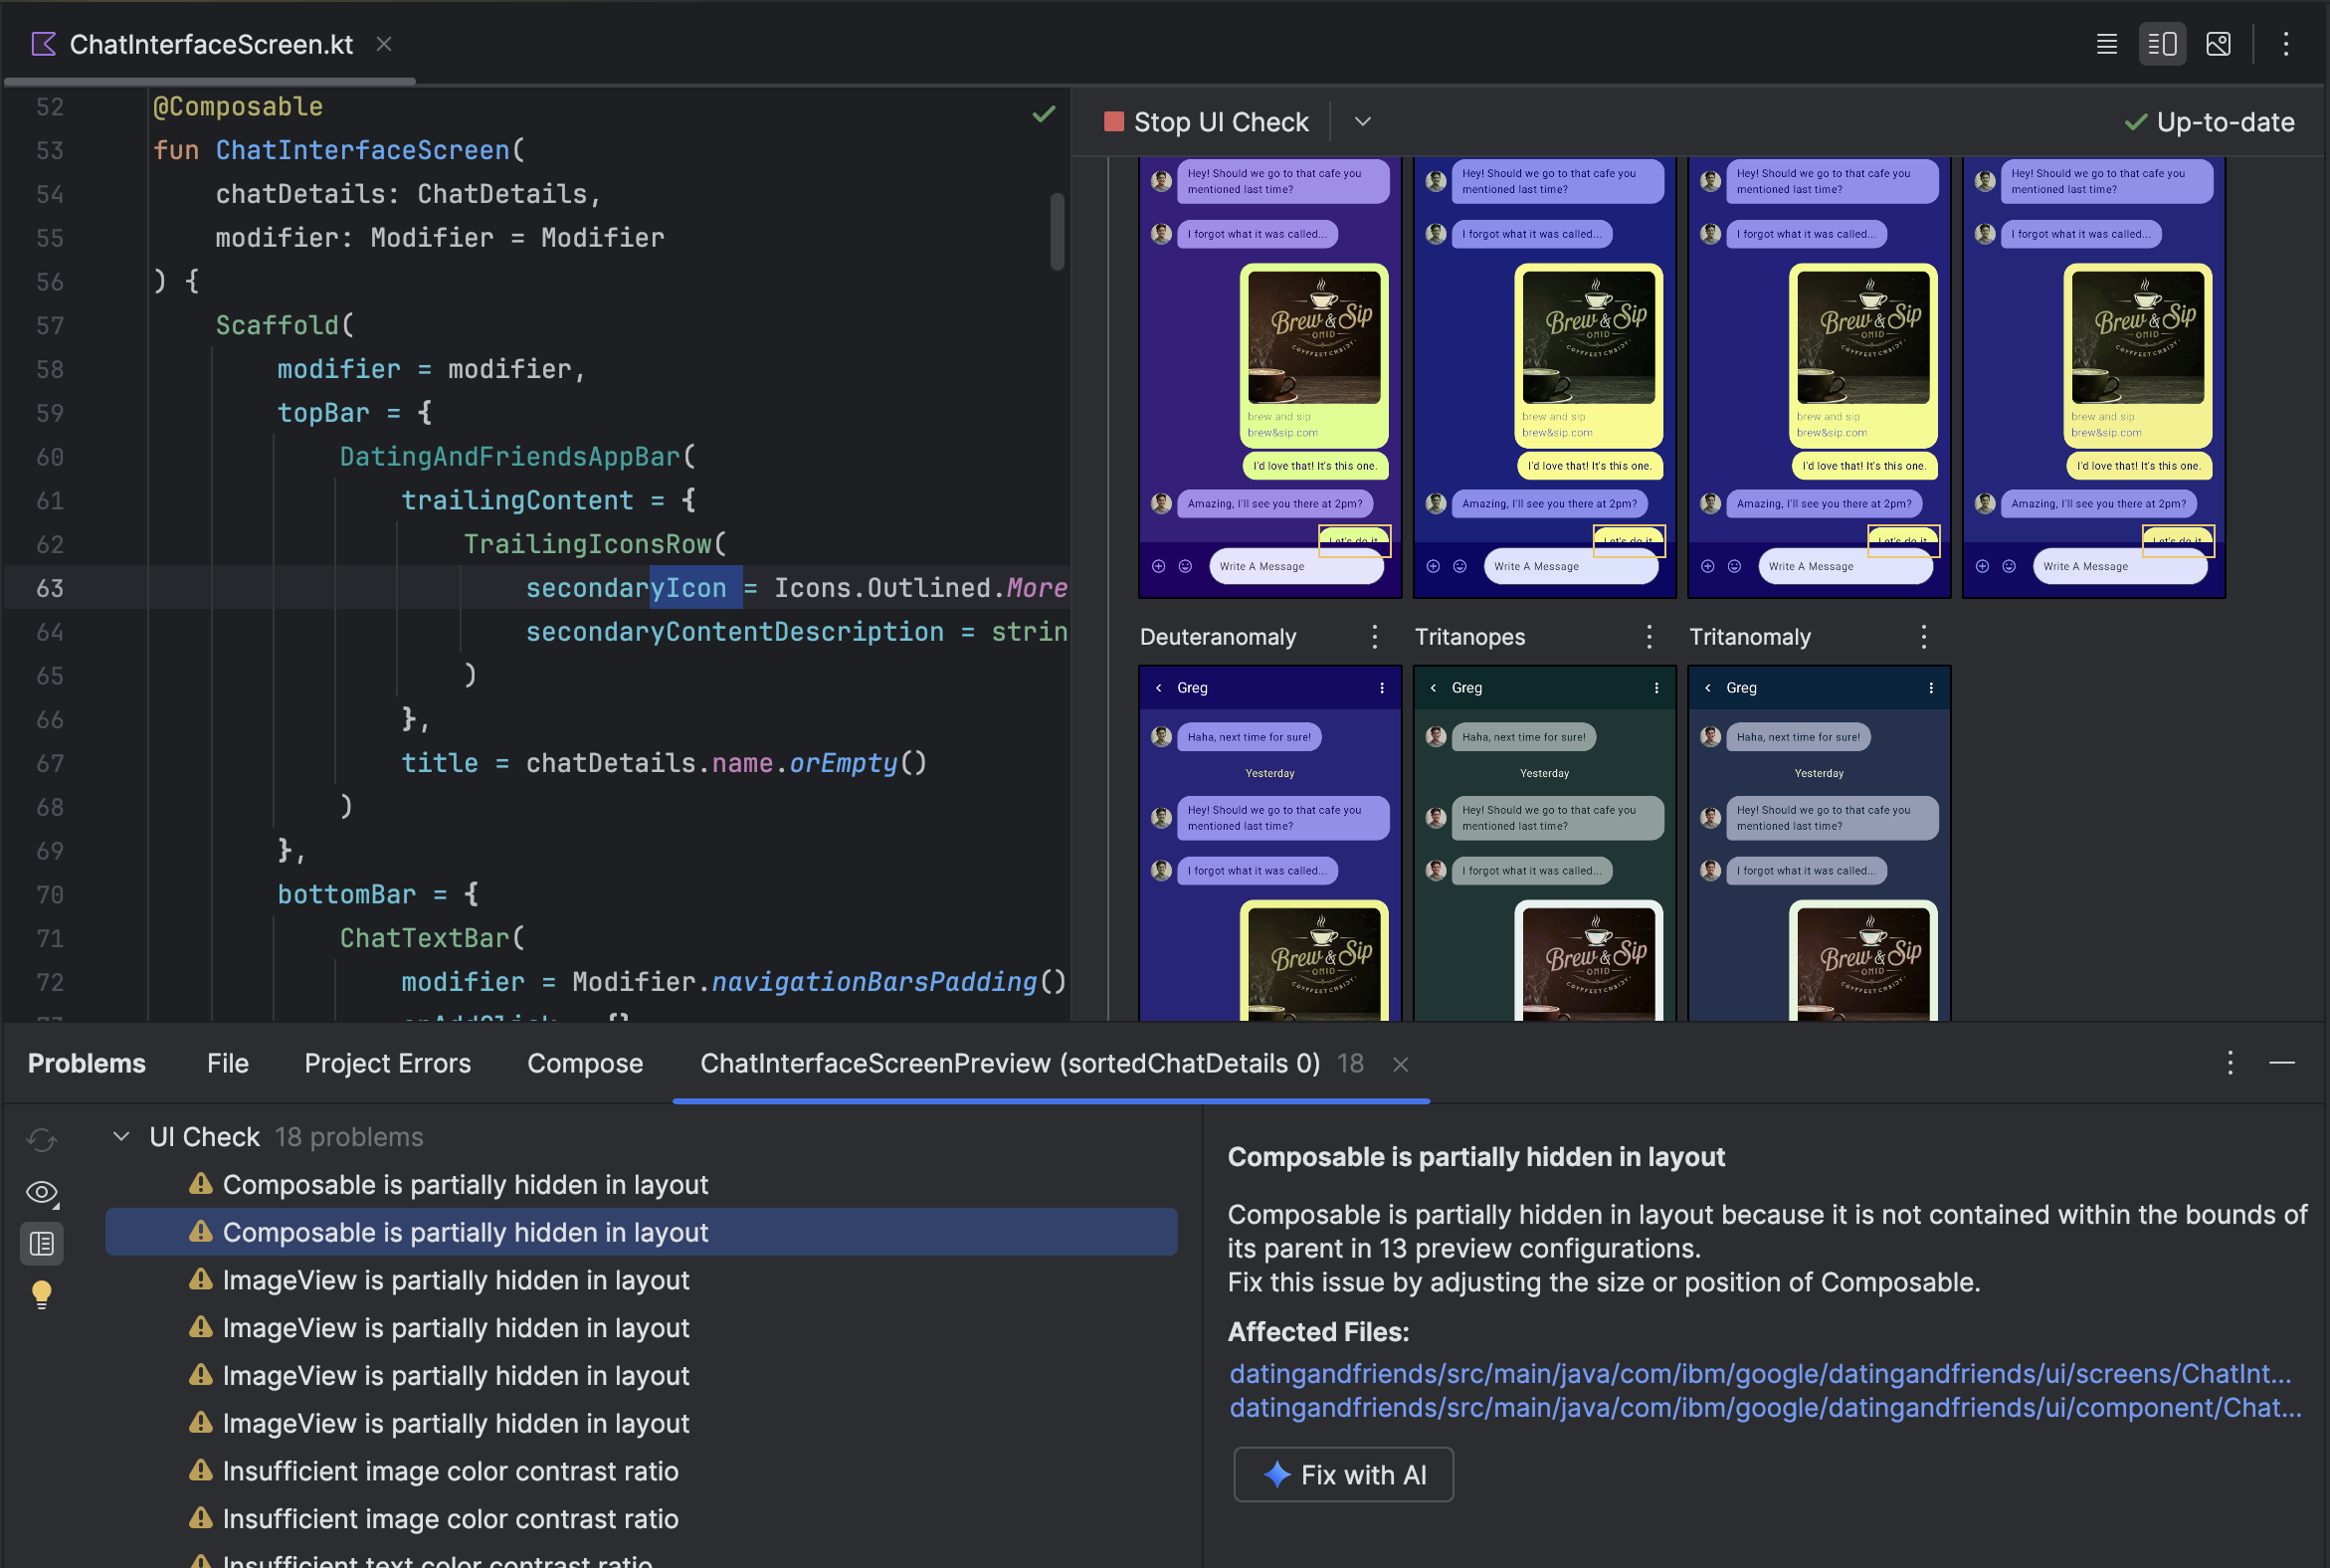
Compose UI 확인
Jetpack Compose에서 더 적응성 있고 접근성 높은 UI를 빌드할 수 있도록 Android 스튜디오는 Compose 미리보기에서 UI 확인 모드를 제공합니다. 이 기능은 뷰의 접근성 검사기와 비슷합니다.
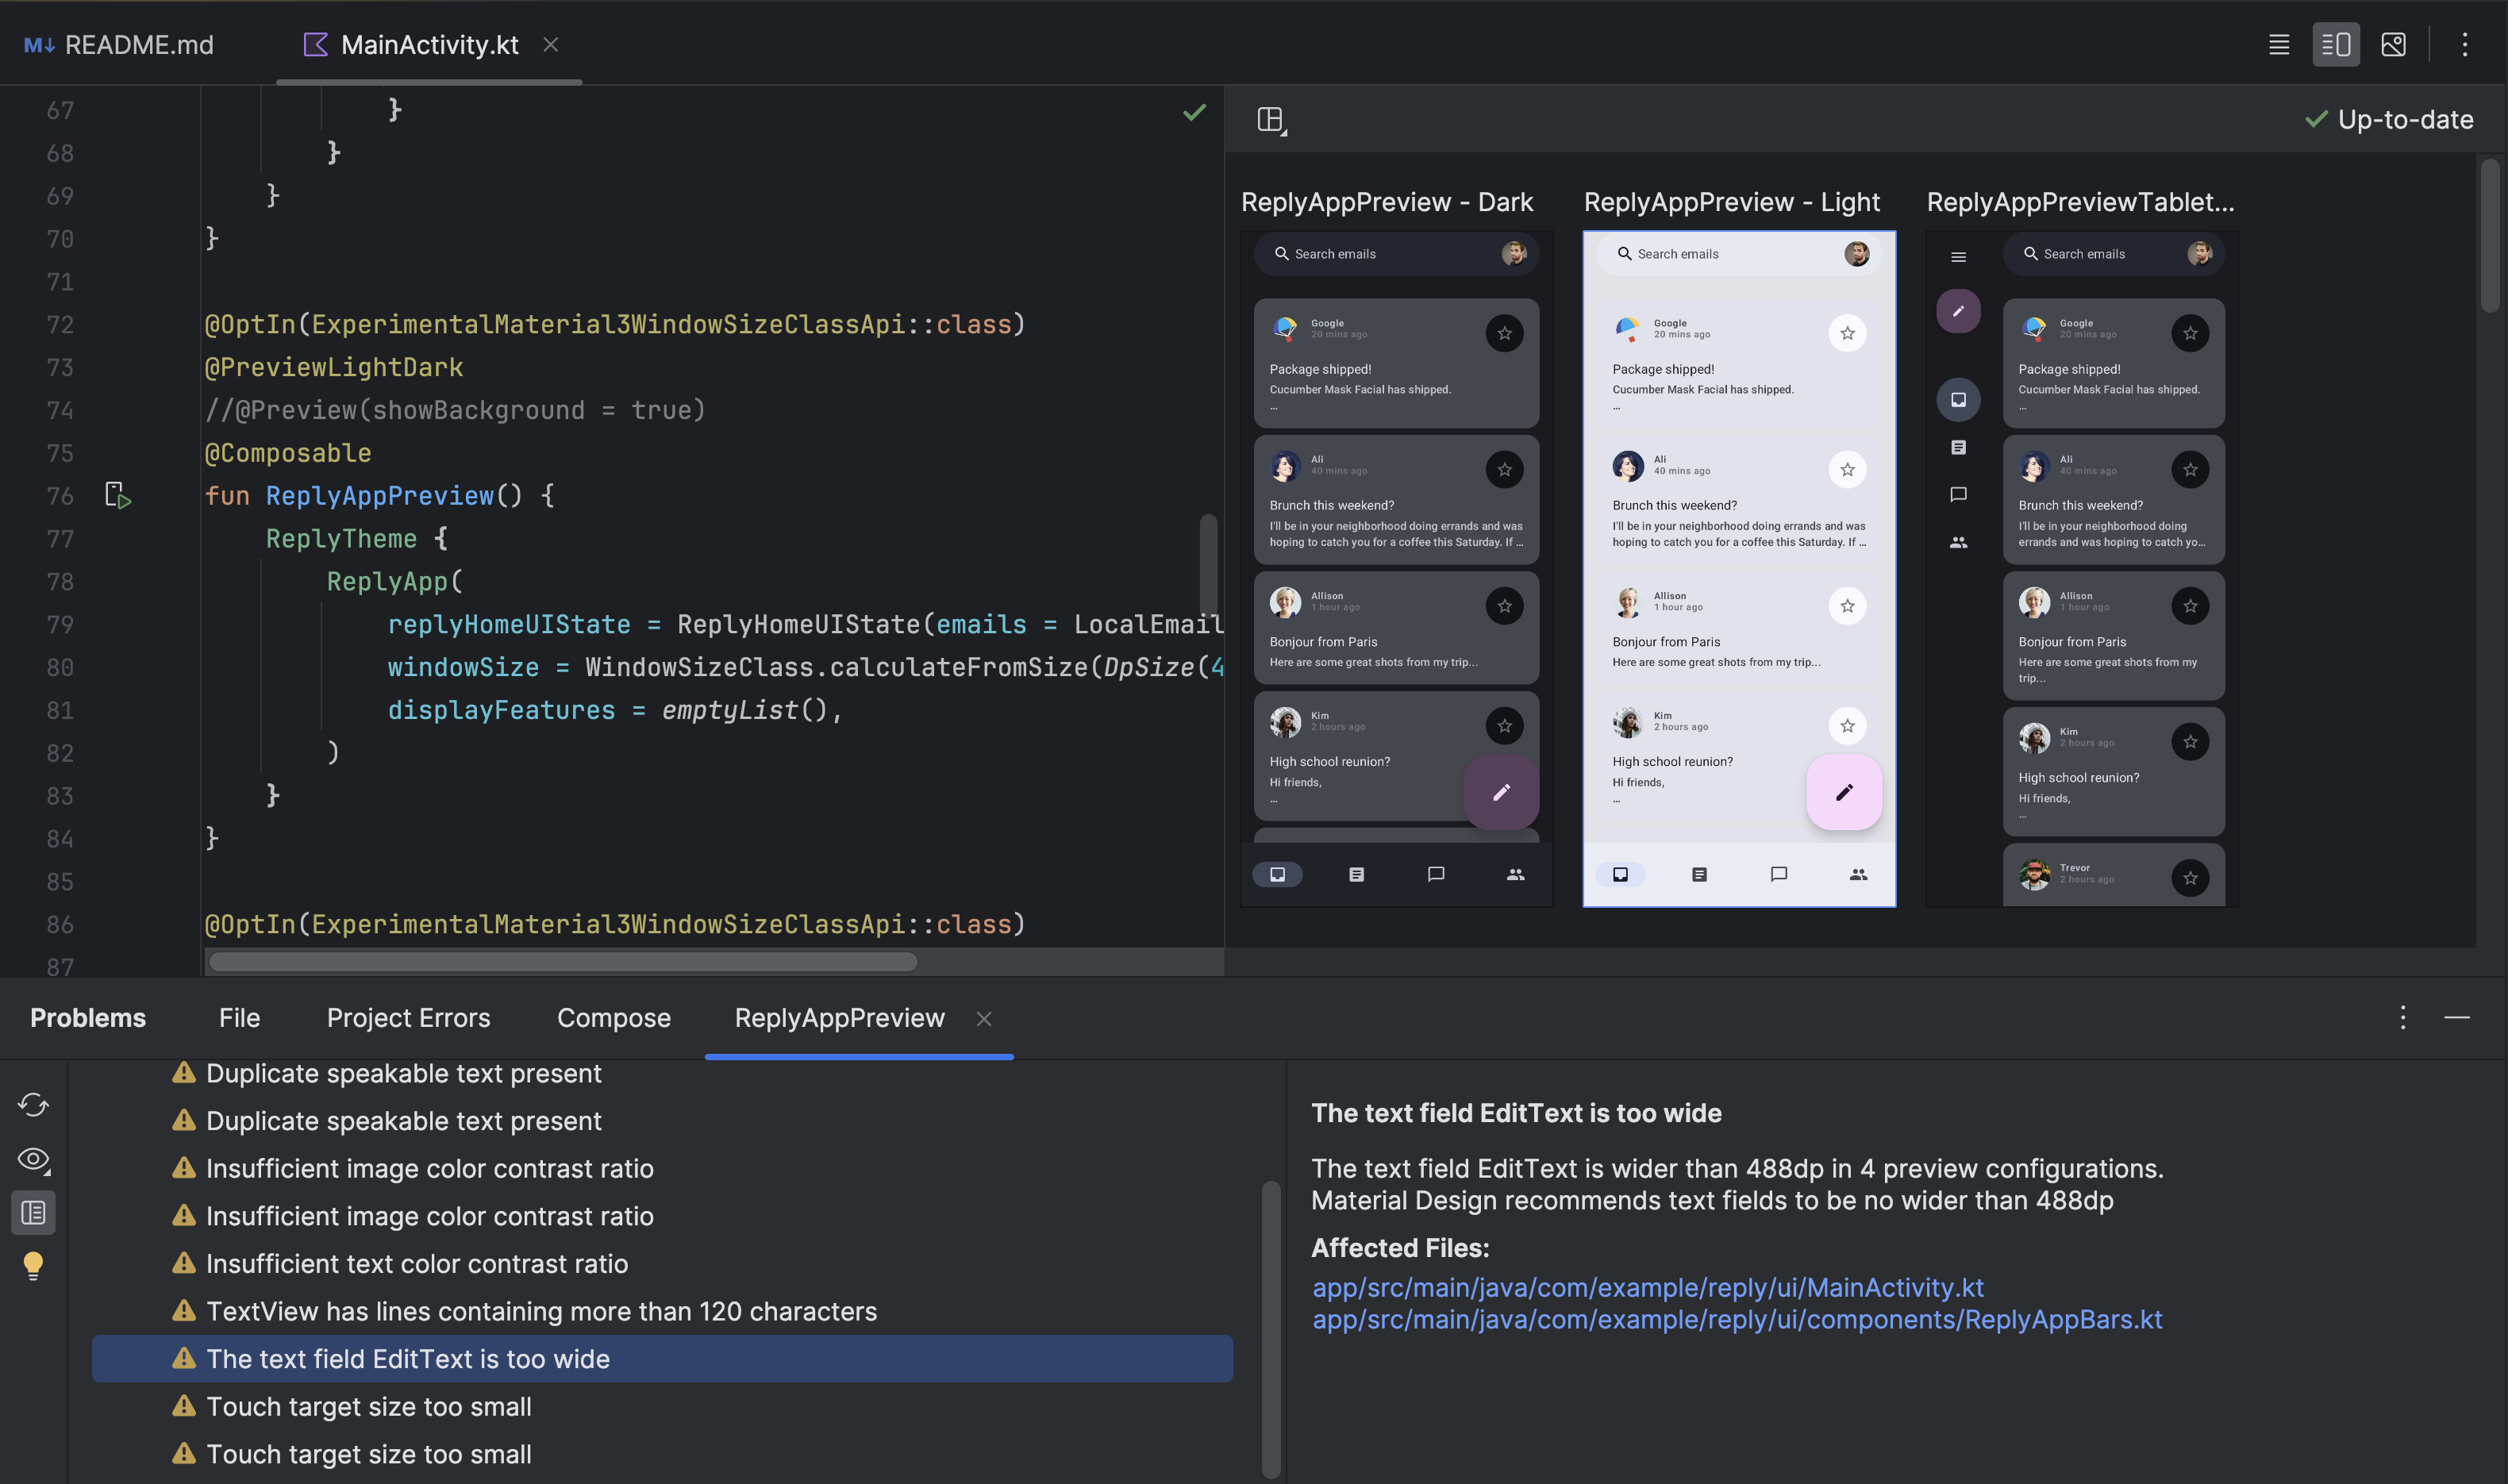
Compose 미리보기에서 Compose UI 확인 모드를 활성화하면 Android 스튜디오에서 Compose UI를 자동으로 감사하고 UI의 접근성과 적응성을 높이기 위한 개선사항을 제안합니다. Android 스튜디오는 다양한 화면 크기에서 UI가 작동하는지 확인합니다. 문제 패널에서 도구는 큰 화면에서 텍스트가 늘어나거나 색상 대비가 낮은 등 감지된 문제를 표시합니다.
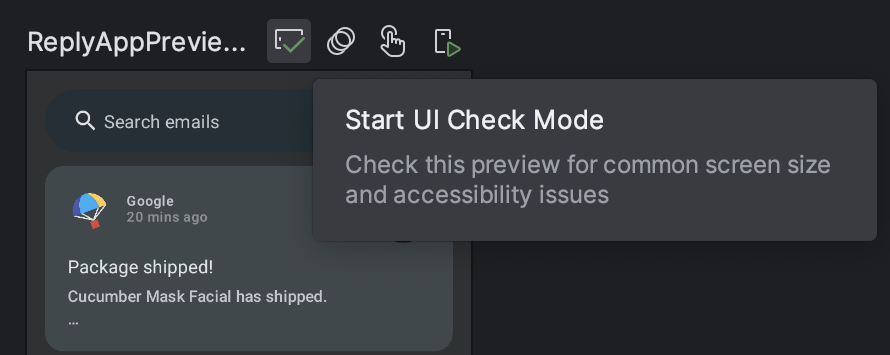
이 기능에 액세스하려면 Compose 미리보기에서 UI 확인 아이콘을 클릭하세요.
UI 검사는 다양한 구성에서 UI를 자동으로 미리 보고 다양한 구성에서 발견된 문제를 강조 표시합니다. 문제 패널에서 문제를 클릭하면 문제의 세부정보, 제안된 수정사항, 문제 영역을 강조 표시하는 렌더링을 확인할 수 있습니다.
AI로 수정
UI 확인 모드에서 감지된 문제의 경우 AI 에이전트를 사용하여 코드 수정사항을 제안하고 적용할 수 있습니다. 문제 패널에서 문제의 AI로 수정 버튼을 클릭합니다. 에이전트는 문제와 코드를 분석하여 접근성 또는 적응형 문제를 해결하는 변경사항을 제안합니다.