Stay organized with collections
Save and categorize content based on your preferences.
Callstacks are useful for identifying CPU hot spots, or sections of code that
take a long time to execute. Callstacks help you understand which part of the
code has been executed, and why it was invoked.
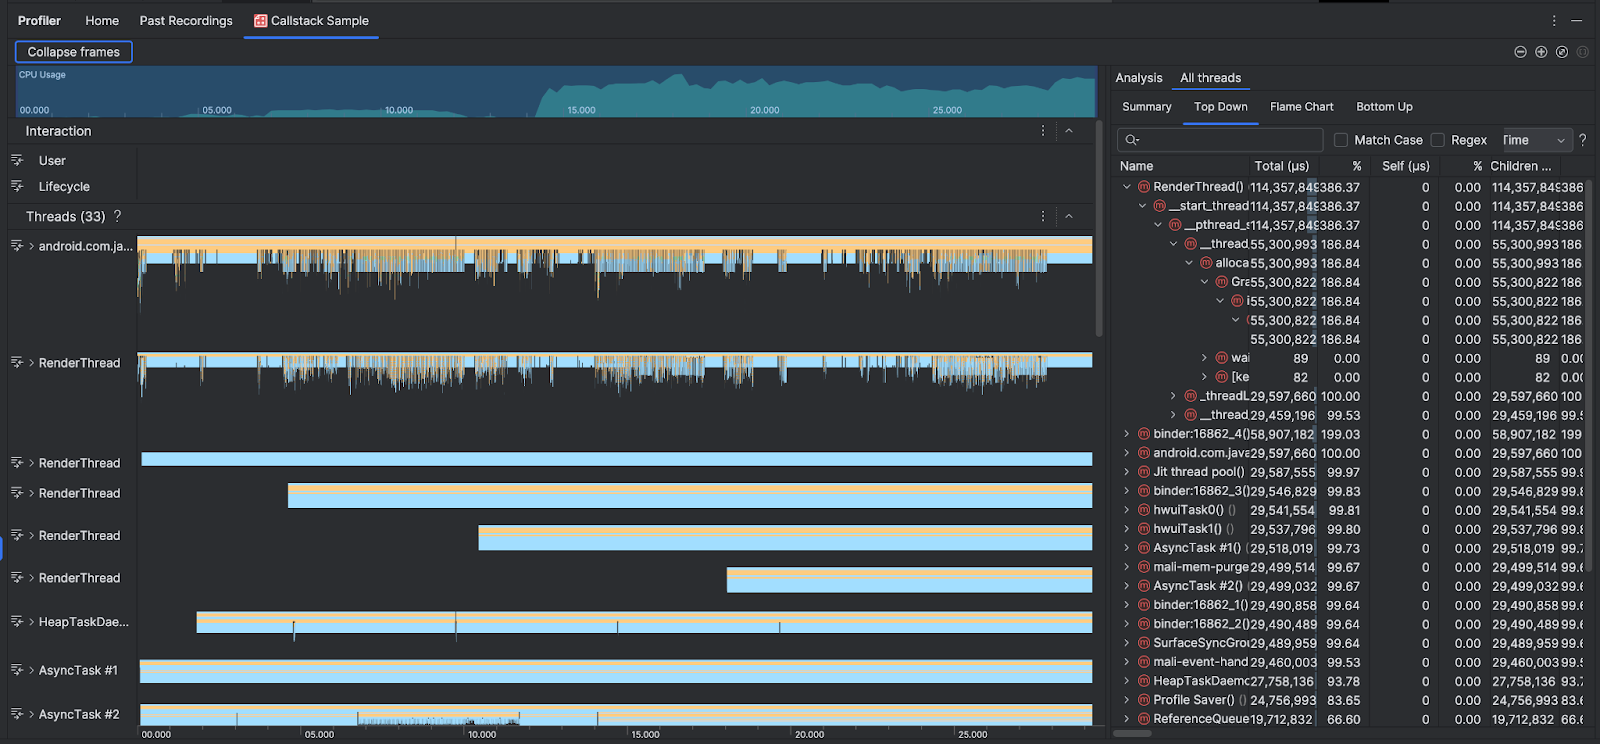
To supplement the
CPU Usage and Interactions timelines,
the Threads section shows frames for every call that your app and the system
makes. Here are some tips for navigating the callstack sample:
Expand the thread of interest and use
keyboard shortcuts
to navigate the stack frames. Click a stack frame to get details about the
event and related calls in the Analysis pane.
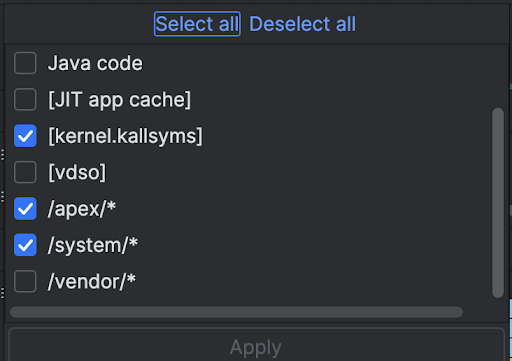
To filter to certain types of stack frames, click Collapse frames and
check the frame types you want to hide. Collapsing frames removes them from
both the Threads and Analysis sections. Depending on your
investigation, you might want to collapse frames from the Java virtual machine
(for example android::AndroidRuntime::start and art::{...}), and the
system kernel (for example [kernel.kallsyms]+{offset}). Usually this
corresponds to collapsing frames related to [kernel.kallsyms], /apex/,
and /system/*.
Because a Java/Kotlin program typically executes through a Java virtual machine,
when Android Studio collects the callstack for a Java/Kotlin program, the
callstack usually includes not just the Java/Kotlin code but also the native
code required to run the program itself and for the program to talk with the
system and hardware.
To jump to the source code associated with a stack frame, right-click the
frame and click Jump to source.
To highlight the stack frame associated with an event in the event table,
click the event.
Internally, Android Studio uses simpleperf to trace
your app's native code. If you want to specify additional options for
Simpleperf, such as sampling specific device CPUs or specifying sampling
durations at a high accuracy, you can
use simpleperf from the command line.
Content and code samples on this page are subject to the licenses described in the Content License. Java and OpenJDK are trademarks or registered trademarks of Oracle and/or its affiliates.
Last updated 2024-08-29 UTC.
[[["Easy to understand","easyToUnderstand","thumb-up"],["Solved my problem","solvedMyProblem","thumb-up"],["Other","otherUp","thumb-up"]],[["Missing the information I need","missingTheInformationINeed","thumb-down"],["Too complicated / too many steps","tooComplicatedTooManySteps","thumb-down"],["Out of date","outOfDate","thumb-down"],["Samples / code issue","samplesCodeIssue","thumb-down"],["Other","otherDown","thumb-down"]],["Last updated 2024-08-29 UTC."],[],[],null,["# Sample the callstack\n\nCallstacks are useful for identifying *CPU hot spots*, or sections of code that\ntake a long time to execute. Callstacks help you understand which part of the\ncode has been executed, and why it was invoked.\n| **Note:** To sample the callstack, you must deploy your app to a device running Android 8.0 (API level 26) or higher.\n\nCallstack sample overview\n-------------------------\n\nTo sample the callstack,\n[select the **Find CPU Hotspots (Callstack Sample)** task](/studio/profile#start-profiling)\nfrom the Android Studio Profiler **Home** tab. After the recording is parsed you\nsee the following visuals:\n\nTo supplement the\n[**CPU Usage** and **Interactions** timelines](/studio/profile/cpu-profiler),\nthe **Threads** section shows frames for every call that your app and the system\nmakes. Here are some tips for navigating the callstack sample:\n\n- Expand the thread of interest and use [keyboard shortcuts](/studio/profile/cpu-profiler#ui-shortcuts) to navigate the stack frames. Click a stack frame to get details about the event and related calls in the **Analysis** pane.\n- To filter to certain types of stack frames, click **Collapse frames** and check the frame types you want to hide. Collapsing frames removes them from both the **Threads** and **Analysis** sections. Depending on your investigation, you might want to collapse frames from the Java virtual machine (for example `android::AndroidRuntime::start` and `art::{...}`), and the system kernel (for example `[kernel.kallsyms]+{offset}`). Usually this corresponds to collapsing frames related to `[kernel.kallsyms]`, `/apex/`, and `/system/*`.\n\nBecause a Java/Kotlin program typically executes through a Java virtual machine,\nwhen Android Studio collects the callstack for a Java/Kotlin program, the\ncallstack usually includes not just the Java/Kotlin code but also the native\ncode required to run the program itself and for the program to talk with the\nsystem and hardware.\n\n- To jump to the source code associated with a stack frame, right-click the frame and click **Jump to source**.\n- To highlight the stack frame associated with an event in the event table, click the event.\n\nFor information about the other visuals, see\n[Record a system trace](/studio/profile/cpu-profiler) and the\n[chart glossary](/studio/profile/chart-glossary/flame-chart).\n\nSample native code using the command line\n-----------------------------------------\n\nInternally, Android Studio uses [simpleperf](/ndk/guides/simpleperf) to trace\nyour app's native code. If you want to specify additional options for\nSimpleperf, such as sampling specific device CPUs or specifying sampling\ndurations at a high accuracy, you can\n[use simpleperf from the command line](https://android.googlesource.com/platform/system/extras/+/master/simpleperf/doc/README.md)."]]