Record native allocations
Stay organized with collections
Save and categorize content based on your preferences.
If you're writing native code and concerned about its memory usage, it's helpful
to profile your app's native allocations to discover if there's opportunity to
optimize.
Why you should profile your app memory
Android provides a managed memory
environment—when Android determines that
your app is no longer using some objects, the garbage collector releases the
unused memory back to the heap. How Android goes about finding unused memory is
constantly being improved, but at some point on all Android versions, the system
must briefly pause your code. Most of the time, the pauses are imperceivable.
However, if your app allocates memory faster than the system can collect it,
your app might be delayed while the collector frees enough memory to satisfy
your allocations. The delay could cause your app to skip frames and cause
visible slowness.
For information about programming practices that can reduce your app's memory
use, read Manage your app's memory.
Native allocations overview
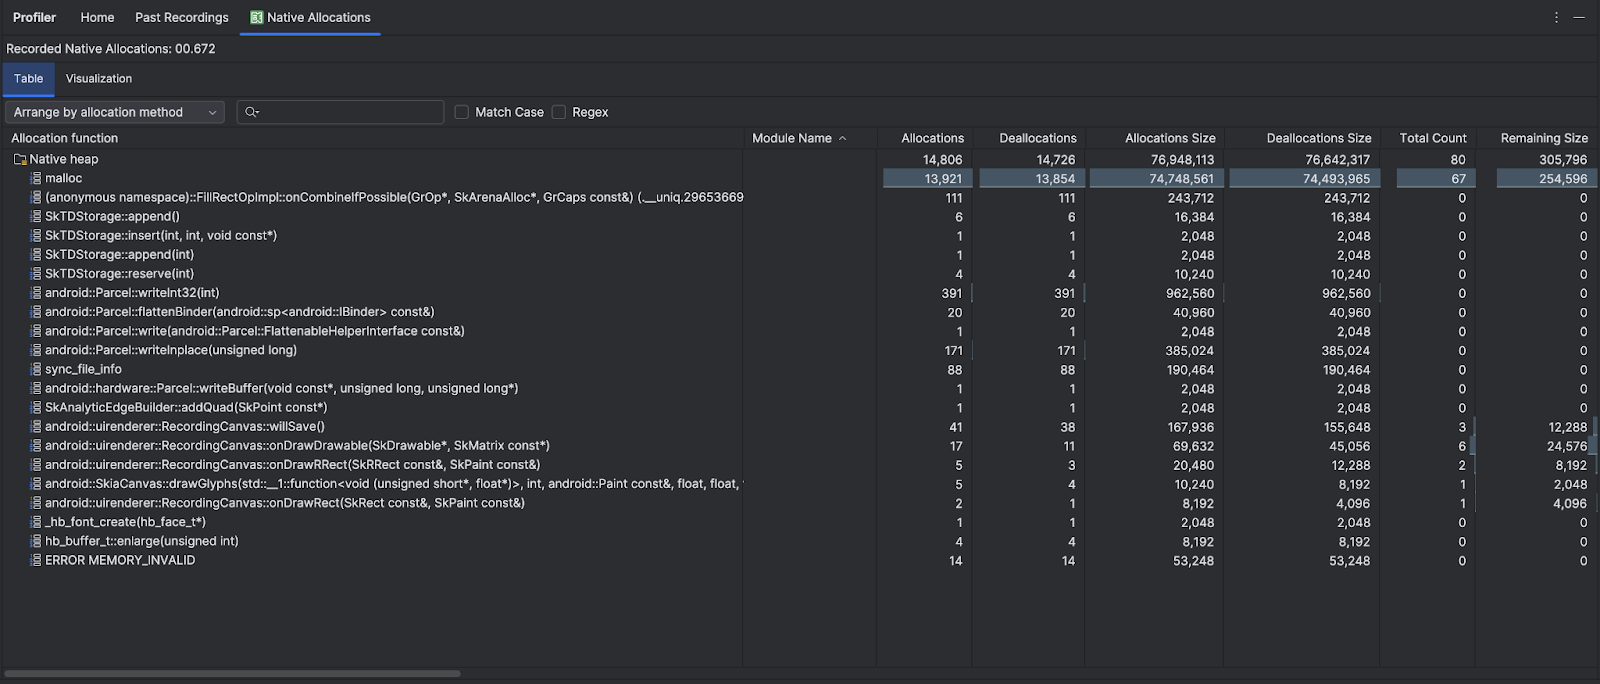
When you run the Track Memory Consumption (Native Allocations) task,
the Android Studio Profiler tracks allocations and deallocations of objects in
native code for the time period that you specify and provides the following
information:
- Allocations: A count of objects allocated using
malloc()
or the new
operator during the selected time period.
- Deallocations: A count of objects deallocated using
free()
or the
delete
operator during the selected time period.
- Allocations Size: The aggregated size in bytes of all allocations during
the selected time period.
- Deallocations Size: The aggregated size in bytes of all freed memory
during the selected time period.
- Total Count: The value in the Allocations column minus the value in
the Deallocations column.
- Remaining Size: The value in the Allocations Size column minus the
value in the Deallocations Size column.

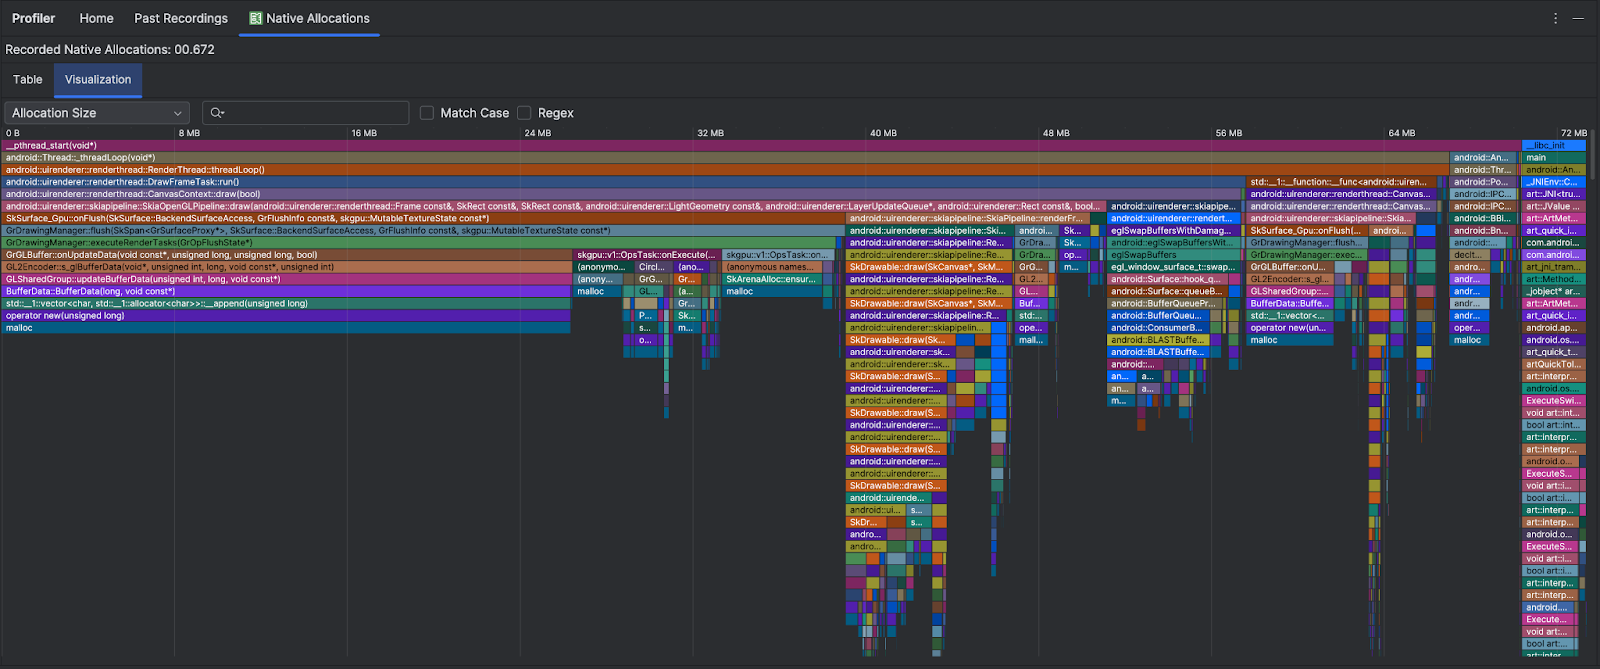
The Visualization tab shows an aggregated view of all the objects related to
native code in the call stack during the time range selected. It essentially
shows you how much total memory the callstack with the instances shown takes.
The first row shows the thread name. By default, the objects are stacked left to
right based on allocation size; use the drop-down to change the ordering.

By default, the profiler uses a sample size of 2048 bytes: Every time 2048 bytes
of memory are allocated, a snapshot of memory is taken. A smaller sample size
results in more frequent snapshots, yielding more accurate data about memory
usage. A larger sample size yields less accurate data, but it consumes fewer
system resources and improves performance while recording. To change the sample
size, see Edit the recording configuration.
Content and code samples on this page are subject to the licenses described in the Content License. Java and OpenJDK are trademarks or registered trademarks of Oracle and/or its affiliates.
Last updated 2025-05-28 UTC.
[[["Easy to understand","easyToUnderstand","thumb-up"],["Solved my problem","solvedMyProblem","thumb-up"],["Other","otherUp","thumb-up"]],[["Missing the information I need","missingTheInformationINeed","thumb-down"],["Too complicated / too many steps","tooComplicatedTooManySteps","thumb-down"],["Out of date","outOfDate","thumb-down"],["Samples / code issue","samplesCodeIssue","thumb-down"],["Other","otherDown","thumb-down"]],["Last updated 2025-05-28 UTC."],[],[],null,["# Record native allocations\n\nIf you're writing native code and concerned about its memory usage, it's helpful\nto profile your app's native allocations to discover if there's opportunity to\noptimize.\n\nWhy you should profile your app memory\n--------------------------------------\n\nAndroid provides a [managed memory\nenvironment](/topic/performance/memory-overview)---when Android determines that\nyour app is no longer using some objects, the garbage collector releases the\nunused memory back to the heap. How Android goes about finding unused memory is\nconstantly being improved, but at some point on all Android versions, the system\nmust briefly pause your code. Most of the time, the pauses are imperceivable.\nHowever, if your app allocates memory faster than the system can collect it,\nyour app might be delayed while the collector frees enough memory to satisfy\nyour allocations. The delay could cause your app to skip frames and cause\nvisible slowness.\n\nFor information about programming practices that can reduce your app's memory\nuse, read [Manage your app's memory](/topic/performance/memory).\n\nNative allocations overview\n---------------------------\n\nWhen you run the [**Track Memory Consumption (Native Allocations)**](/studio/profile#start-profiling) task,\nthe Android Studio Profiler tracks allocations and deallocations of objects in\nnative code for the time period that you specify and provides the following\ninformation:\n\n- **Allocations** : A count of objects allocated using `malloc()` or the `new` operator during the selected time period.\n- **Deallocations** : A count of objects deallocated using `free()` or the `delete` operator during the selected time period.\n- **Allocations Size**: The aggregated size in bytes of all allocations during the selected time period.\n- **Deallocations Size**: The aggregated size in bytes of all freed memory during the selected time period.\n- **Total Count** : The value in the **Allocations** column minus the value in the **Deallocations** column.\n- **Remaining Size** : The value in the **Allocations Size** column minus the value in the **Deallocations Size** column.\n\nThe **Visualization** tab shows an aggregated view of all the objects related to\nnative code in the call stack during the time range selected. It essentially\nshows you how much total memory the callstack with the instances shown takes.\nThe first row shows the thread name. By default, the objects are stacked left to\nright based on allocation size; use the drop-down to change the ordering.\n\nBy default, the profiler uses a sample size of 2048 bytes: Every time 2048 bytes\nof memory are allocated, a snapshot of memory is taken. A smaller sample size\nresults in more frequent snapshots, yielding more accurate data about memory\nusage. A larger sample size yields less accurate data, but it consumes fewer\nsystem resources and improves performance while recording. To change the sample\nsize, see [Edit the recording configuration](/studio/profile#edit-recording)."]]