রেকর্ড নেটিভ বরাদ্দ
সেভ করা পৃষ্ঠা গুছিয়ে রাখতে 'সংগ্রহ' ব্যবহার করুন
আপনার পছন্দ অনুযায়ী কন্টেন্ট সেভ করুন ও সঠিক বিভাগে রাখুন।
আপনি যদি নেটিভ কোড লিখছেন এবং এর মেমরি ব্যবহার সম্পর্কে উদ্বিগ্ন হন, তাহলে অপ্টিমাইজ করার সুযোগ আছে কিনা তা আবিষ্কার করতে আপনার অ্যাপের নেটিভ অ্যালোকেশন প্রোফাইল করা সহায়ক।
কেন আপনি আপনার অ্যাপ মেমরি প্রোফাইল করা উচিত
অ্যান্ড্রয়েড একটি পরিচালিত মেমরি পরিবেশ প্রদান করে — যখন অ্যান্ড্রয়েড নির্ধারণ করে যে আপনার অ্যাপ আর কিছু বস্তু ব্যবহার করছে না, তখন আবর্জনা সংগ্রহকারী অব্যবহৃত মেমরিকে আবার গাদা করে ছেড়ে দেয়। অ্যান্ড্রয়েড কীভাবে অব্যবহৃত মেমরি খোঁজার বিষয়ে যায় তা ক্রমাগত উন্নত করা হচ্ছে, কিন্তু সমস্ত অ্যান্ড্রয়েড সংস্করণে কিছু সময়ে, সিস্টেমটিকে আপনার কোডকে সংক্ষিপ্তভাবে বিরতি দিতে হবে। বেশিরভাগ সময়, বিরতিগুলি দুর্বোধ্য হয়। যাইহোক, যদি আপনার অ্যাপটি সিস্টেমটি সংগ্রহ করতে পারে তার চেয়ে দ্রুত মেমরি বরাদ্দ করে, তবে সংগ্রাহক আপনার বরাদ্দ সন্তুষ্ট করার জন্য যথেষ্ট মেমরি মুক্ত করার সময় আপনার অ্যাপটি বিলম্বিত হতে পারে। বিলম্বের কারণে আপনার অ্যাপ ফ্রেমগুলি এড়িয়ে যেতে পারে এবং দৃশ্যমান ধীরগতির কারণ হতে পারে৷
আপনার অ্যাপের মেমরি ব্যবহার কমাতে পারে এমন প্রোগ্রামিং অনুশীলন সম্পর্কে তথ্যের জন্য, আপনার অ্যাপের মেমরি পরিচালনা করুন পড়ুন।
স্থানীয় বরাদ্দ ওভারভিউ
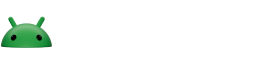
আপনি যখন ট্র্যাক মেমরি কনজাম্পশন (নেটিভ অ্যালোকেশন) টাস্ক চালান, তখন অ্যান্ড্রয়েড স্টুডিও প্রোফাইলার আপনার নির্দিষ্ট করা সময়ের জন্য নেটিভ কোডে বস্তুর বরাদ্দ এবং ডিললোকেশন ট্র্যাক করে এবং নিম্নলিখিত তথ্য প্রদান করে:
- বরাদ্দকরণ : নির্বাচিত সময়ের মধ্যে
malloc()
বা new
অপারেটর ব্যবহার করে বরাদ্দকৃত বস্তুর গণনা। - ডিঅ্যালোকেশন : নির্বাচিত সময়ের মধ্যে
free()
বা delete
অপারেটর ব্যবহার করে ডিললোকেড করা বস্তুর একটি গণনা। - বরাদ্দের আকার : নির্বাচিত সময়ের মধ্যে সমস্ত বরাদ্দের বাইটে একত্রিত আকার।
- ডিঅ্যালোকেশন সাইজ : নির্বাচিত সময়ের মধ্যে সমস্ত মুক্ত মেমরির বাইটে একত্রিত আকার।
- মোট গণনা : বরাদ্দ কলামের মান বিয়োগ ডিঅ্যালোকেশন কলামের মান।
- অবশিষ্ট আকার : বরাদ্দের আকার কলামের মান ডিঅ্যালোকেশন সাইজ কলামের মান বিয়োগ করে।

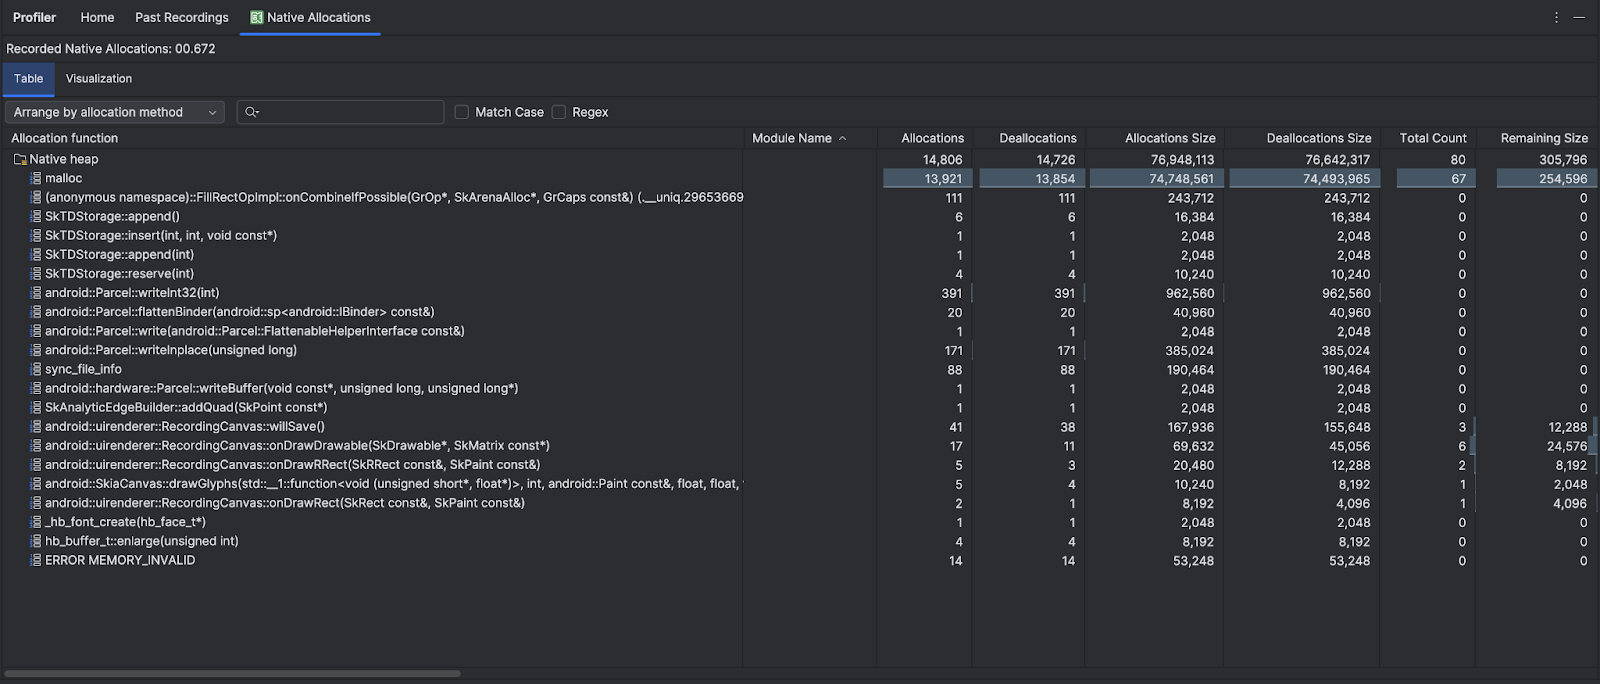
ভিজ্যুয়ালাইজেশন ট্যাবটি নির্বাচিত সময় সীমার মধ্যে কল স্ট্যাকের নেটিভ কোড সম্পর্কিত সমস্ত বস্তুর একটি সমষ্টিগত দৃশ্য দেখায়। এটি মূলত আপনাকে দেখায় যে দেখানো উদাহরণগুলির সাথে কলস্ট্যাকের মোট কত মেমরি লাগে। প্রথম সারিটি থ্রেডের নাম দেখায়। ডিফল্টরূপে, বরাদ্দের আকারের উপর ভিত্তি করে বস্তুগুলিকে বাম থেকে ডানে স্ট্যাক করা হয়; অর্ডার পরিবর্তন করতে ড্রপ-ডাউন ব্যবহার করুন।

ডিফল্টরূপে, প্রোফাইলার 2048 বাইটের একটি নমুনা আকার ব্যবহার করে: প্রতিবার 2048 বাইট মেমরি বরাদ্দ করা হয়, মেমরির একটি স্ন্যাপশট নেওয়া হয়। একটি ছোট নমুনা আকারের ফলে আরও ঘন ঘন স্ন্যাপশট পাওয়া যায়, যা মেমরি ব্যবহার সম্পর্কে আরও সঠিক তথ্য প্রদান করে। একটি বড় নমুনা আকার কম সঠিক তথ্য প্রদান করে, কিন্তু এটি কম সিস্টেম সংস্থান গ্রহণ করে এবং রেকর্ড করার সময় কর্মক্ষমতা উন্নত করে। নমুনার আকার পরিবর্তন করতে, রেকর্ডিং কনফিগারেশন সম্পাদনা করুন দেখুন।
এই পৃষ্ঠার কন্টেন্ট ও কোডের নমুনাগুলি Content License-এ বর্ণিত লাইসেন্সের অধীনস্থ। Java এবং OpenJDK হল Oracle এবং/অথবা তার অ্যাফিলিয়েট সংস্থার রেজিস্টার্ড ট্রেডমার্ক।
2025-07-29 UTC-তে শেষবার আপডেট করা হয়েছে।
[[["সহজে বোঝা যায়","easyToUnderstand","thumb-up"],["আমার সমস্যার সমাধান হয়েছে","solvedMyProblem","thumb-up"],["অন্যান্য","otherUp","thumb-up"]],[["এতে আমার প্রয়োজনীয় তথ্য নেই","missingTheInformationINeed","thumb-down"],["খুব জটিল / অনেক ধাপ","tooComplicatedTooManySteps","thumb-down"],["পুরনো","outOfDate","thumb-down"],["অনুবাদ সংক্রান্ত সমস্যা","translationIssue","thumb-down"],["নমুনা / কোড সংক্রান্ত সমস্যা","samplesCodeIssue","thumb-down"],["অন্যান্য","otherDown","thumb-down"]],["2025-07-29 UTC-তে শেষবার আপডেট করা হয়েছে।"],[],[],null,["# Record native allocations\n\nIf you're writing native code and concerned about its memory usage, it's helpful\nto profile your app's native allocations to discover if there's opportunity to\noptimize.\n\nWhy you should profile your app memory\n--------------------------------------\n\nAndroid provides a [managed memory\nenvironment](/topic/performance/memory-overview)---when Android determines that\nyour app is no longer using some objects, the garbage collector releases the\nunused memory back to the heap. How Android goes about finding unused memory is\nconstantly being improved, but at some point on all Android versions, the system\nmust briefly pause your code. Most of the time, the pauses are imperceivable.\nHowever, if your app allocates memory faster than the system can collect it,\nyour app might be delayed while the collector frees enough memory to satisfy\nyour allocations. The delay could cause your app to skip frames and cause\nvisible slowness.\n\nFor information about programming practices that can reduce your app's memory\nuse, read [Manage your app's memory](/topic/performance/memory).\n\nNative allocations overview\n---------------------------\n\nWhen you run the [**Track Memory Consumption (Native Allocations)**](/studio/profile#start-profiling) task,\nthe Android Studio Profiler tracks allocations and deallocations of objects in\nnative code for the time period that you specify and provides the following\ninformation:\n\n- **Allocations** : A count of objects allocated using `malloc()` or the `new` operator during the selected time period.\n- **Deallocations** : A count of objects deallocated using `free()` or the `delete` operator during the selected time period.\n- **Allocations Size**: The aggregated size in bytes of all allocations during the selected time period.\n- **Deallocations Size**: The aggregated size in bytes of all freed memory during the selected time period.\n- **Total Count** : The value in the **Allocations** column minus the value in the **Deallocations** column.\n- **Remaining Size** : The value in the **Allocations Size** column minus the value in the **Deallocations Size** column.\n\nThe **Visualization** tab shows an aggregated view of all the objects related to\nnative code in the call stack during the time range selected. It essentially\nshows you how much total memory the callstack with the instances shown takes.\nThe first row shows the thread name. By default, the objects are stacked left to\nright based on allocation size; use the drop-down to change the ordering.\n\nBy default, the profiler uses a sample size of 2048 bytes: Every time 2048 bytes\nof memory are allocated, a snapshot of memory is taken. A smaller sample size\nresults in more frequent snapshots, yielding more accurate data about memory\nusage. A larger sample size yields less accurate data, but it consumes fewer\nsystem resources and improves performance while recording. To change the sample\nsize, see [Edit the recording configuration](/studio/profile#edit-recording)."]]