Recording Java/Kotlin allocations helps you identify undesirable memory patterns that might be causing performance problems. The profiler can show you the following about object allocations:
- What types of objects were allocated and how much space they use.
- The stack trace of each allocation, including in which thread.
- When the objects were deallocated.
You should record memory allocations during normal and extreme user interaction to identify exactly where your code is either allocating too many objects in a short time or allocating objects that become leaked. Learn more about why you should profile your app memory.
How to record Java/Kotlin allocations
To record Java/Kotlin allocations, select the Track Memory Consumption (Java/Kotlin Allocations) task from the profiler Home tab. Note that you need a debuggable app (use Profiler: run 'app' as debuggable (complete data)) to record Java/Kotlin allocations.

Android Studio captures all object allocations in memory by default. If you have an app that allocates a lot of objects, you might observe visible slowdowns with your app while profiling. To improve performance while profiling, go to the Allocation Tracking drop-down and select Sampled instead of Full. When sampling, the profiler collects object allocations in memory at regular intervals.
To force a garbage collection event while recording, click the garbage icon
 .
.
Java/Kotlin allocations overview
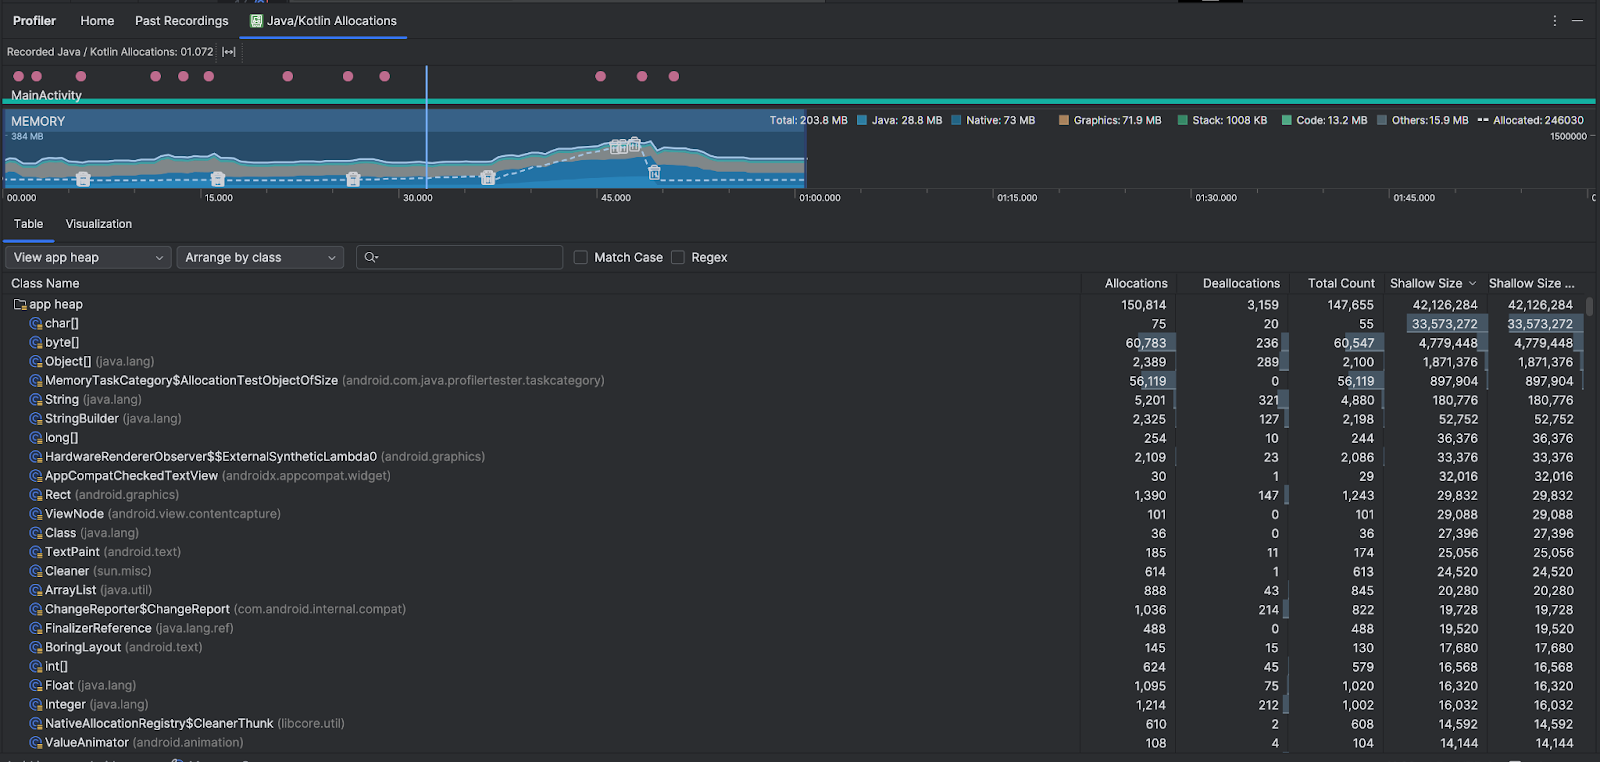
After you stop the recording, you see the following:

- The event timeline shows activity states, user input events, and screen rotation events.
- The memory use timeline shows the following info. Select a portion of the
timeline to filter to a certain time range.
- A stacked graph of how much memory is being used by each memory category, as indicated by the y-axis on the left and the color key at the top.
- A dashed line indicates the number of allocated objects, as indicated by the y-axis on the right.
- An icon for each garbage collection event.
- The Table tab shows a list of classes. The Total Count is the number of allocations at the end of the selected time range (Allocations minus Deallocations), so it might make sense to debug classes that have the highest Total Count values first. If you're more interested in troubleshooting classes based on peak allocations during the time range selected, prioritize by Allocations. Similarly the Remaining Size is the Allocations Size minus the Deallocations Size in bytes.
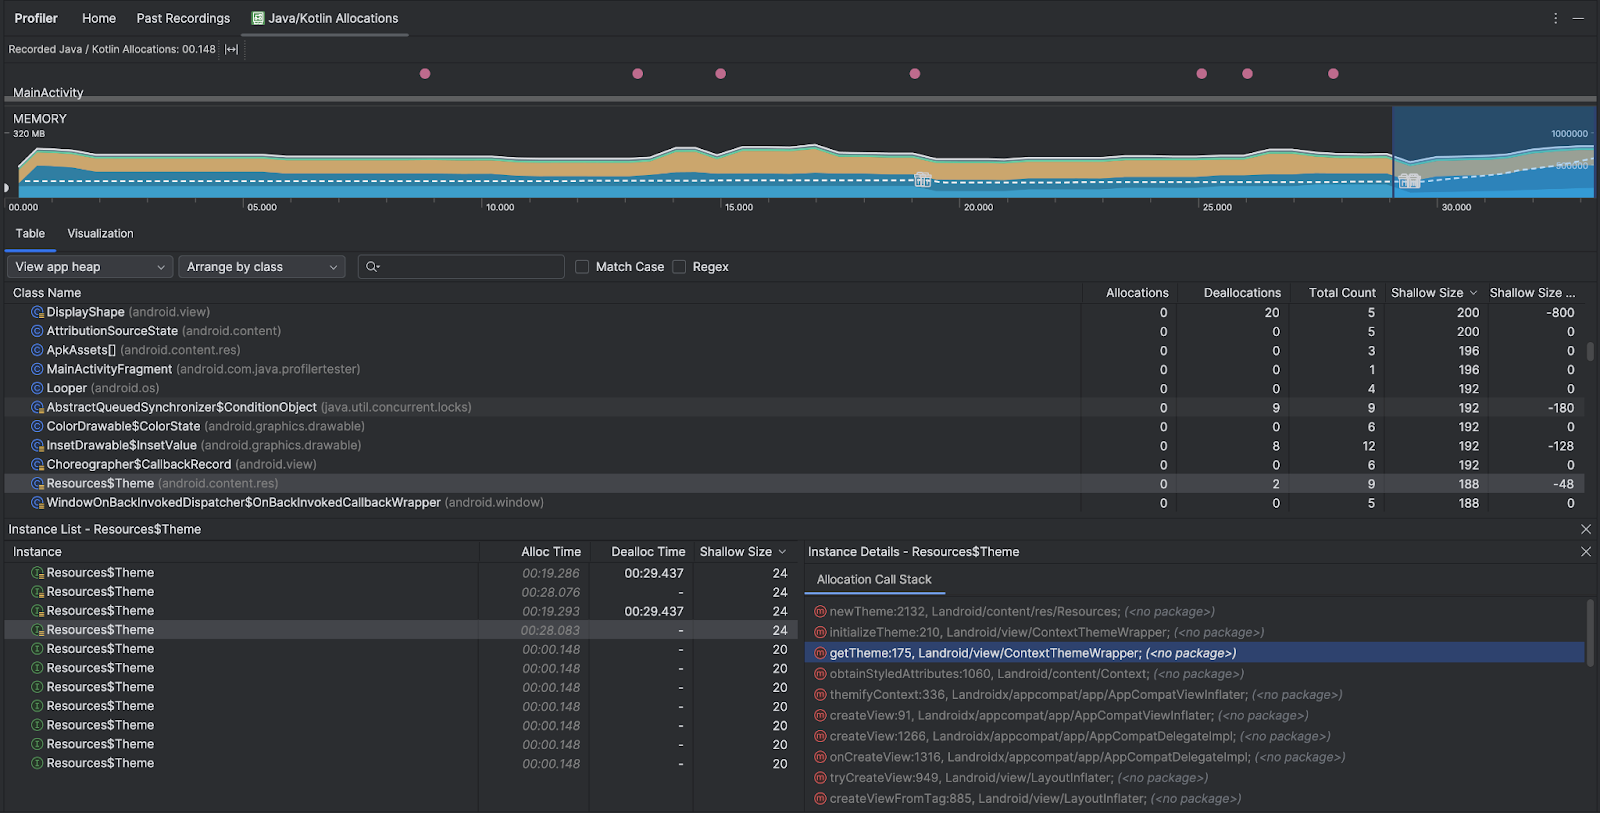
- When you click a class in the Table list, the Instance pane opens with a list of associated objects, including when they were allocated, when they were deallocated, and their shallow size.
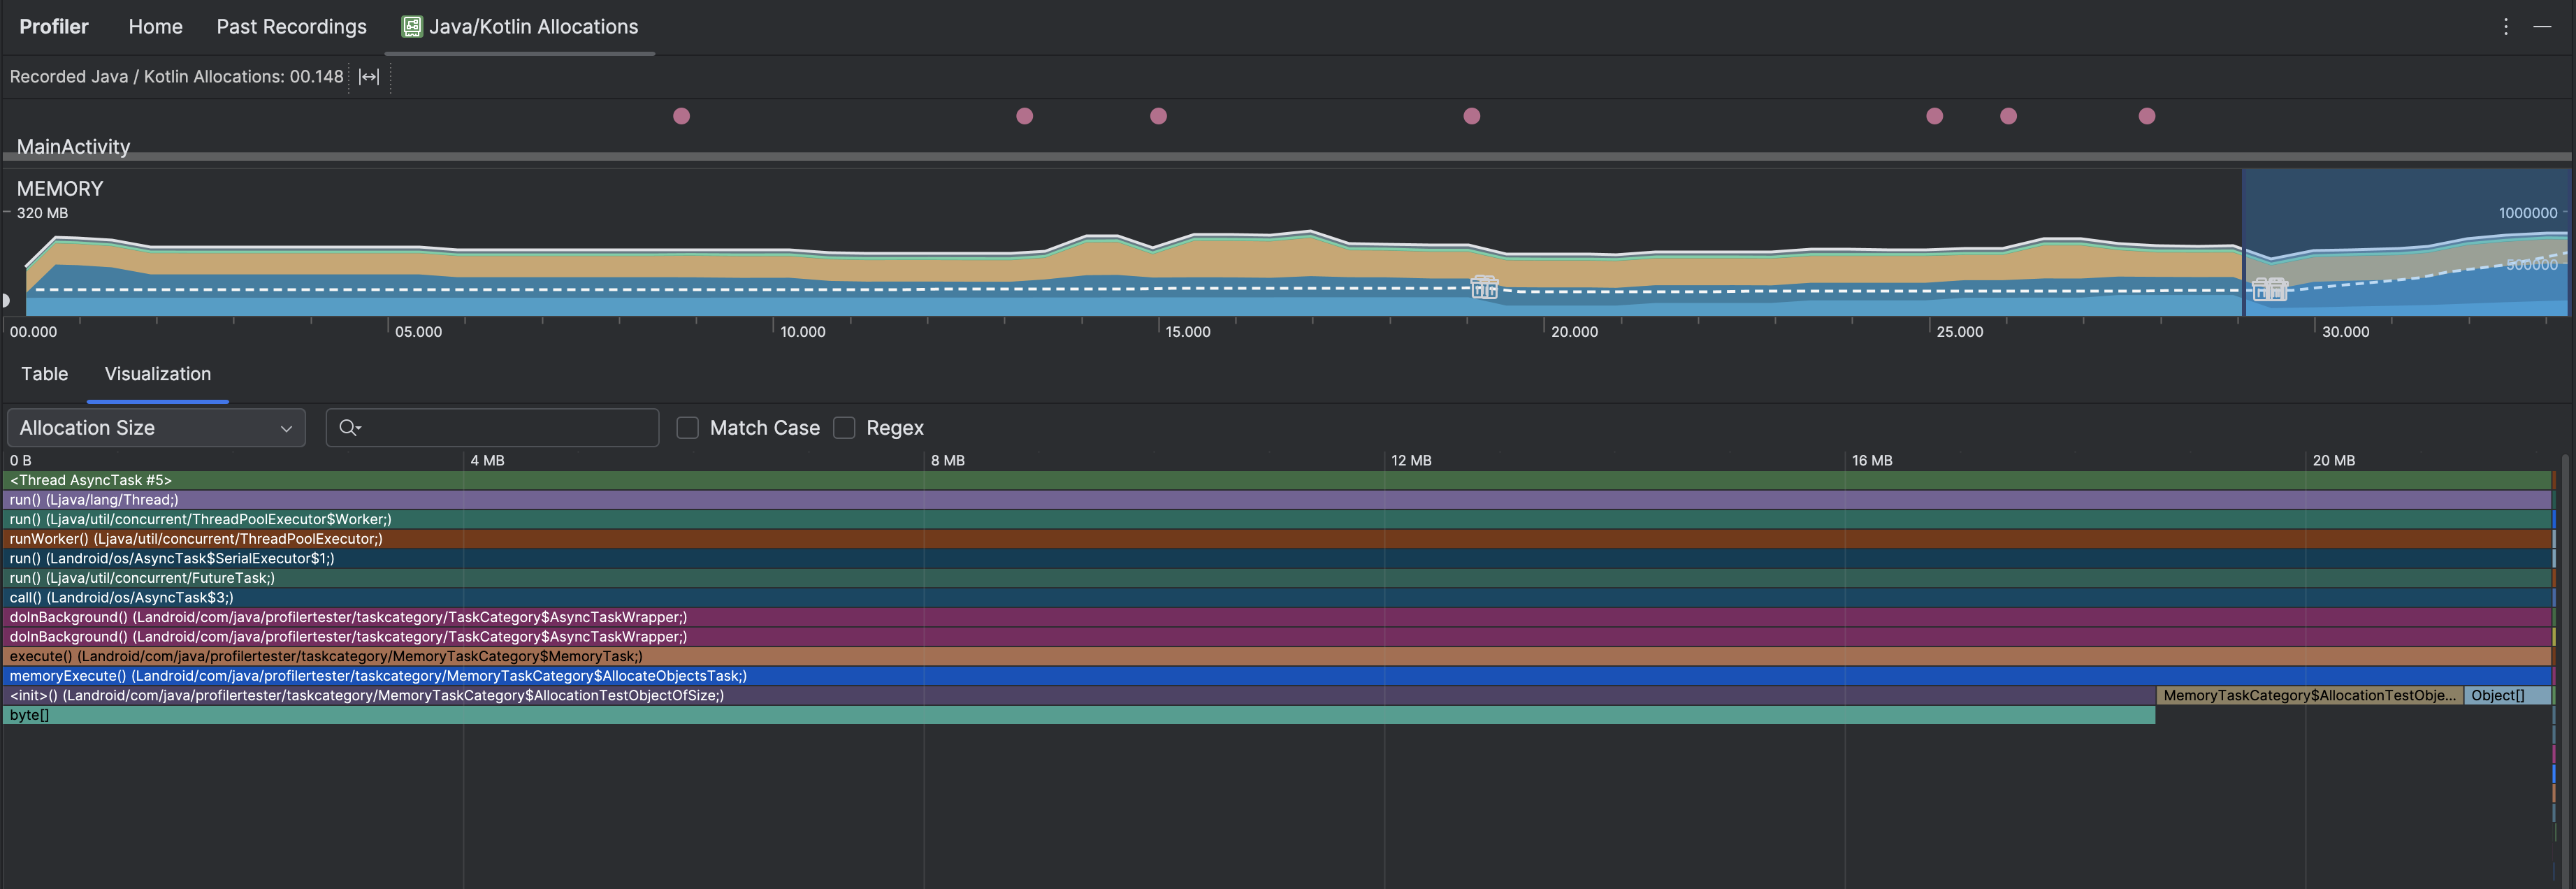
The Visualization tab shows an aggregated view of all the objects in the call stack during the time range selected. It essentially shows you how much total memory the callstack with the instances shown takes. The first row shows the thread name. By default, the objects are stacked left to right based on allocation size; use the drop-down to change the ordering.

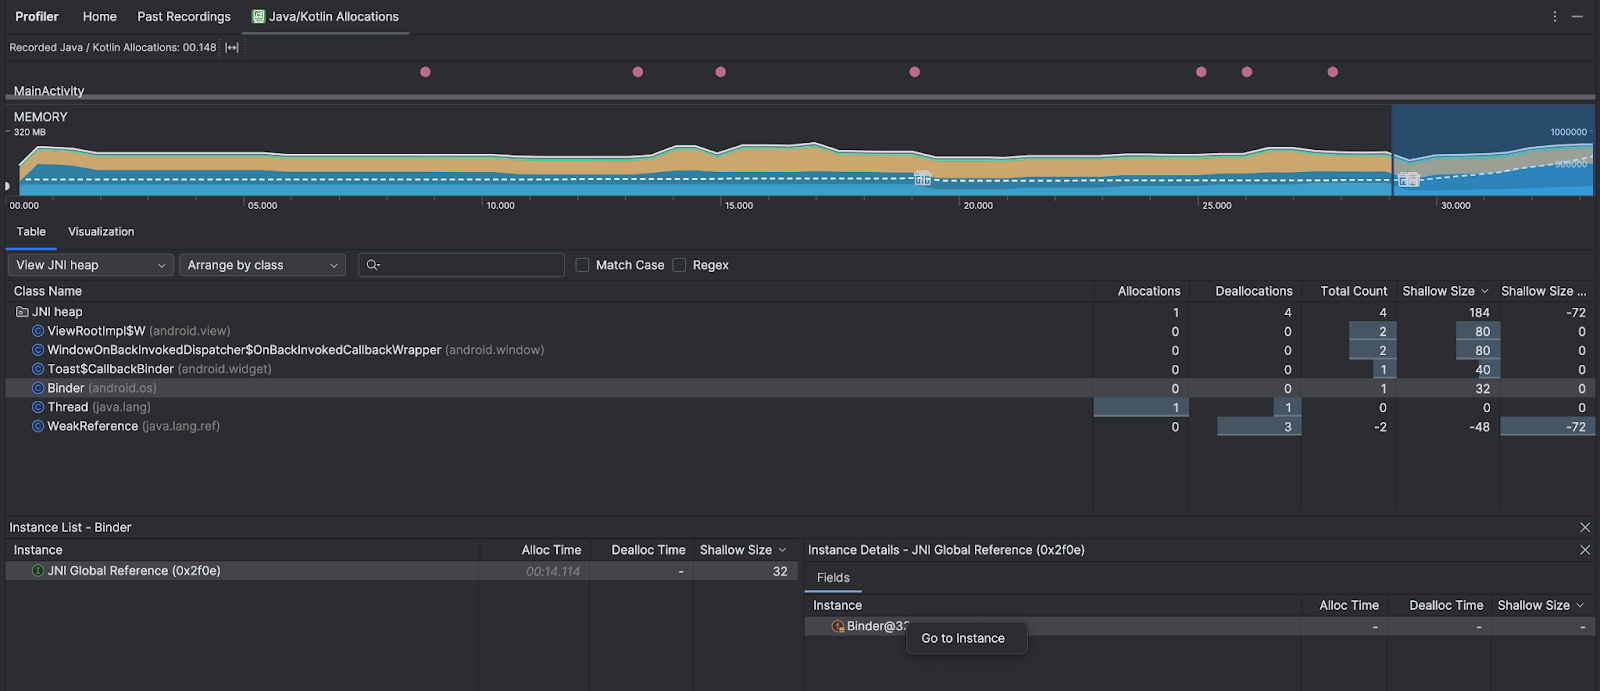
Use the heap drop-down to filter to certain heaps. In addition to the filters available when you capture a heap dump, you can filter to classes in the JNI heap, the heap that shows where Java Native Interface (JNI) references are allocated and released.
Use the arrangement drop-down to choose how to arrange the allocations. In addition to the arrangements available when you capture a heap dump, you can arrange by callstack.
How memory is counted
The numbers you see at the top of are based on all the private memory pages that your app has committed, according to the Android system. This count doesn't include pages shared with the system or other apps. The categories in the memory count are as follows:

- Java: Memory from objects allocated from Java or Kotlin code.
Native: Memory from objects allocated from C or C++ code.
Even if you're not using C++ in your app, you might see some native memory used here because the Android framework uses native memory to handle various tasks on your behalf, such as when handling image assets and other graphics— even though the code you've written is in Java or Kotlin.
Graphics: Memory used for graphics buffer queues to display pixels to the screen, including GL surfaces, GL textures, and more. Note that this is memory shared with the CPU, not dedicated GPU memory.
Stack: Memory used by both native and Java stacks in your app. This usually relates to how many threads your app is running.
Code: Memory that your app uses for code and resources, such as DEX bytecode, optimized or compiled DEXcode, .
solibraries, and fonts.Others: Memory used by your app that the system isn't sure how to categorize.
Allocated: The number of Java/Kotlin objects allocated by your app. This doesn't count objects allocated in C or C++.
Inspect the allocation record
To inspect the allocation record, follow these steps:
- Browse the class list in the Table tab to find objects that have unusually large Allocations or Total Count values (depending on what you're optimizing for) and that might be leaked.
- In the Instance View pane, click an instance. Depending on what's applicable to that instance, the Fields or Allocation Call Stack tab opens. Use the information in the Fields or Allocation Call Stack tabs to determine if instances are truly needed or unnecessary duplications.

Right-click any list entry to jump to the relevant source code.
View global JNI references
Java Native Interface (JNI) is a framework that lets Java code and native code call each other. JNI references are managed manually by the native code, so it's possible for issues including the following to occur:
- Java objects used by native code are kept alive for too long.
- Some objects on the Java heap might become unreachable if a JNI reference is discarded without first being explicitly deleted.
- The global JNI reference limit is exhausted.
To troubleshoot such issues, select View JNI heap in the profiler to browse all global JNI references and filter them by Java types and native call stacks. Right-click on an instance field in the Fields tab and select Go to instance to see the relevant allocation call stack.

The Allocation Call Stack tab shows you where the JNI references are allocated and released in your code.

For more information on JNI, see JNI tips.
